USDCHF Is Not Weak – It’s Testing Support!USD/CHF is currently trading inside a well-defined rising channel, and the recent move lower looks more like a pullback into trend support rather than a breakdown.
For me, this is typical behavior in trending markets. Strong moves don’t continue in a straight line, price pulls back, tests support, and then decides the next direction based on reaction.
As long as the rising support holds, the broader structure remains intact. The next move will depend on how price behaves from this zone, not on short-term volatility.
This is a structure observation, not a prediction.
Disclaimer: This analysis is for educational purposes only and does not constitute financial advice. Trading involves risk.
Forexanalysis

GBPUSD – Support Holding, Watching Reaction From RangeGBP/USD has reacted from a well-defined support zone, an area where buyers have stepped in multiple times before. Price is currently trading between clear support and resistance, indicating a short-term range environment.
As long as this support holds, upside reactions toward the resistance zone remain possible. A clean break below support, however, would weaken this structure and change the short-term bias.
This is a reaction-based zone, not a prediction. Let price confirm the next move.
Disclaimer: This analysis is for educational purposes only and does not constitute financial advice. Trading involves risk. Please manage risk responsibly.

EURUSD – Breakout From Falling Resistance, Retest Holding WellEUR/USD was trading under a falling resistance trendline for a long time, with sellers consistently stepping in at higher levels. Recently, price managed to break above this trendline, which was the first sign that bearish pressure was easing.
After the breakout, price came back for a retest of the broken structure and previous resistance area. This retest is holding well so far, showing that buyers are defending the level and not allowing price to slip back below the structure.
What stands out here is how price respected the retest and then pushed higher, leaving behind a small imbalance. This often indicates acceptance above the breakout level rather than a false move.
As long as price holds above the retest zone and structure support, the path of least resistance remains to the upside, with higher resistance levels marked on the chart. A clean breakdown below this area would invalidate the bullish view.
This is a structure-based idea, not a prediction. Let price continue to confirm.
Disclaimer: This analysis is for educational purposes only and does not constitute financial advice. Trading involves risk. Please manage risk responsibly.

Gold in Final Bullish Wave – Last Push Higher ExpectedGold (XAU/USD 4H) is in a strong bullish trend and is currently moving in the last part of Wave (5). The clear breakout above the previous resistance shows that buyers are in control, and the bullish structure is still valid. As long as the price stays above the main support area, the outlook remains positive, with the next target around 4,580–4,650 , where this upward move is likely to finish. For short-term trades, a sensible stop-loss can be placed below 4,420 , while the bullish view becomes invalid if the price falls below 4,360 . If everything goes as expected, Gold should make one final move higher and then take a normal corrective pullback (A-B-C) after the strong rally.
Stay tuned!
@Money_Dictators
Thank you :)

EUR/USD – Accumulation After Sell-Off, Structure-Based Long IdeaEUR/USD has seen a strong sell-off, followed by a sharp reaction from a well-defined support zone. This area has already proven its strength by absorbing selling pressure and pushing price higher.
After the bounce, price is now consolidating near support instead of breaking down further, indicating potential accumulation at these levels.
What Price Is Telling Us: Price is holding above the support zone with multiple rejections and overlapping candles, showing a clear loss of bearish momentum. Sellers are failing to push price lower despite earlier strength.
This type of behavior often appears before a corrective move or continuation higher, especially after an impulsive decline.
If this analysis helped you, like, follow, and comment for more clean Forex breakdowns.
Disclaimer: This analysis is for educational purposes only and does not constitute financial advice. Trading involves risk, and past performance does not guarantee future results. Please manage risk responsibly.

EUR/USD – Trap or Trend Continuation?EUR/USD – Trap or Trend Continuation?
The market has recently transitioned from a strong directional advance into a phase of hesitation and balance. After a sustained upward expansion marked by clear momentum and orderly price progression, buying pressure has begun to slow. This slowdown is evident through reduced follow-through, shorter price extensions, and increased overlap between successive price movements.
Current price action reflects a state of consolidation rather than continuation. The market is no longer accelerating higher, but it is also not showing aggressive selling. This suggests that participants who benefited from the prior move are reassessing exposure, while new buyers are less willing to commit at current levels. As a result, price is fluctuating within a relatively narrow range, indicating temporary equilibrium between demand and supply.
Attempts to push higher have been met with limited acceptance, hinting at exhaustion in the recent upward move. Momentum appears to be waning, and price behavior shows signs of distribution, where activity becomes choppy and directional conviction weakens. This phase often precedes either a corrective move or a renewed expansion, depending on which side regains control.
If downside pressure increases, price is likely to seek lower valuation areas where participation previously increased. Such a move would be considered a corrective adjustment within the broader context of the prior advance rather than an outright reversal, unless selling becomes impulsive and sustained. Conversely, if buyers regain confidence and price is accepted above the recent consolidation zone, the market could resume its prior expansion with renewed strength.
Overall, the market is at an inflection point. The dominant move that brought price to current levels has lost momentum, and the next meaningful direction will depend on whether balance resolves in favor of continuation or correction. Patience is warranted until price demonstrates clear acceptance in one direction, as trading during this phase carries elevated risk of false moves.

EUR/USD Decision PhaseEUR/USD Decision Phase
Recent candles indicate a slowdown in upside follow-through, implying that short-term positioning may be crowded. This pause does not immediately invalidate the broader constructive tone but introduces the risk of a corrective rotation as liquidity is rebalanced. The projected move on the chart highlights a scenario where price may seek efficiency before determining the next directional leg.
Overall conditions suggest the market is transitioning from expansion into evaluation. Continuation higher would require renewed participation, while failure to attract follow-through could lead to a deeper reset driven by profit-taking and short-term repricing. Patience is advised as the market reveals whether this phase resolves through continuation or corrective realignment.
Price action reflects a market that has recently expanded after a prolonged phase of balanced participation. The sequence of higher intraday pushes shows growing initiative from buyers, supported by repeated structure continuation and shallow pullbacks, suggesting confidence rather than urgency. Momentum has remained constructive, with price spending more time advancing than correcting, a sign of controlled accumulation rather than emotional buying.
Recent candles indicate a slowdown in upside follow-through, implying that short-term positioning may be crowded. This pause does not immediately invalidate the broader constructive tone but introduces the risk of a corrective rotation as liquidity is rebalanced. The projected move on the chart highlights a scenario where price may seek efficiency before determining the next directional leg.
Overall conditions suggest the market is transitioning from expansion into evaluation. Continuation higher would require renewed participation, while failure to attract follow-through could lead to a deeper reset driven by profit-taking and short-term repricing. Patience is advised as the market reveals whether this phase resolves through continuation or corrective realignment.

Gold Reaches Exhaustion Zone — Sell Momentum LoadingGold Reaches Exhaustion Zone — Sell Momentum Loading
Gold is showing signs of upside exhaustion, with price repeatedly failing to gain momentum as it approaches the mid-range premium zone near the 4,245 area. The recent structure reflects a market transitioning from short-term recovery into renewed weakness, with each bullish attempt losing strength faster than the previous one.
Order flow remains dominated by distribution behaviour, and the chart signals a potential liquidity sweep followed by a bearish continuation. The projected rejection zone suggests that buyers are running into an area of heavy supply, where institutional activity has previously triggered aggressive downside extensions. Volume distribution across the range also highlights diminishing demand at higher prices, reinforcing the likelihood of a downward rotation.
As the market continues to respect its broader range ceiling, the probability increases for price to revisit deeper value regions. With momentum fading and the current leg showing hesitation, gold is positioned for a potential sell-side move toward lower mean-reversion levels.

EUR/USD Trend Analysis: Will Bulls Take Control?EUR/USD Trend Analysis: Will Bulls Take Control?
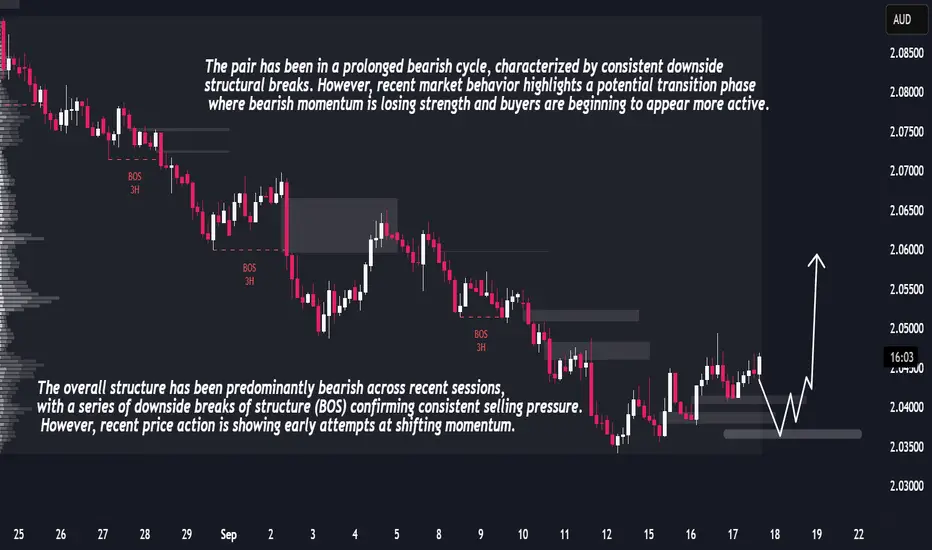
EURUSD continues to trade inside a broad descending structure that has been active for several weeks, with repeated breaks of structure marking the gradual weakening of bearish momentum. The pair has shown consistent attempts to reclaim internal structure, revealing that sellers are losing dominance at each successive swing.
The recent price action highlights a slowdown in the bearish cycle, with the pair forming a compressed consolidation near the lower boundary of the channel. This type of price behavior typically represents absorption, where liquidity is collected before a potential directional shift. Multiple bullish breaks within the current leg signal that the market is preparing for a transition phase.
The chart illustrates a clear reaction to the most recent liquidity sweep, followed by a controlled reset in order flow. Buyers have stepped in aggressively in previous cycles after similar setups, suggesting that the market is once again positioning itself for a recovery attempt toward higher inefficiencies.
Volume distribution from the left side of the chart shows earlier institutional engagement, and the current region aligns with historical accumulation behaviors seen in prior EURUSD reversals. If the pair maintains strength within this consolidation pocket, the next move could be a bullish repricing wave targeting unmitigated zones above.
Overall, EURUSD is showing signs of shift and structural recovery, with the current pattern favoring a bullish reaction in the coming sessions.

EURUSD – Bullish Setup Toward 1.16EURUSD – Bullish Setup Toward 1.17
EURUSD is showing strong signs of a bullish reversal after an extended period of downside movement. The 3H chart highlights several Market Structure Shifts (MSS) and Breaks of Structure (BOS) suggesting that bearish momentum is fading and buyers are regaining control near the 1.1500 demand zone.
The price is forming a solid accumulation base, indicating that smart money may be positioning for a move higher. A clean break above the 1.1680–1.1730 resistance area could confirm a trend reversal, opening the way for a sustained bullish rally toward the mid-1.18 region.
With momentum strengthening and structure turning positive, EURUSD looks poised for a potential breakout continuation in the days ahead.
📈 Key Insights:
Structure: Bullish reversal forming on 3H timeframe
Support zone: 1.1500 – strong accumulation base
Upside targets: 1.1680 → 1.1730 → 1.1800
Outlook: Buyers regaining control; bullish continuation likely

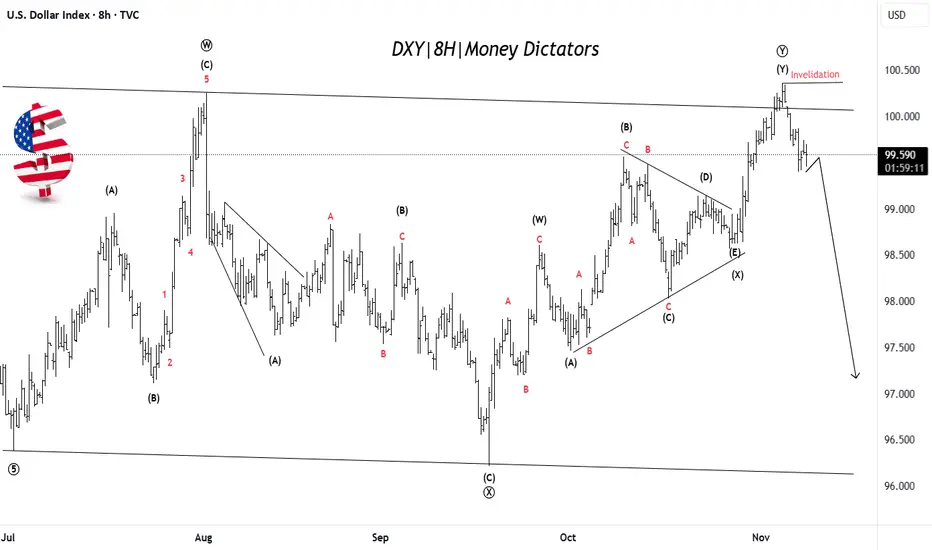
US Dollar Weakness Likely After Final Push UpDXY has completed a complex corrective W–X–Y pattern, with the final leg (Y) recently topping near the 100.50 zone. Price has failed to break above the invalidation level, suggesting the uptrend is losing strength. This signals that the dollar may have finished its corrective phase and could now start a fresh bearish wave targeting lower zones near 97–98. The overall structure indicates that momentum is shifting from bullish to bearish. In simple terms: rally is likely over → downside move toward new lows expected next.
Stay tuned!
@Money_Dictators
Thank you :)
GOLD RANGE PLAY — CLEAN SUPPLY & DEMAND REACTIONS AHEAD🧭 DAILY TRADING PLAN — GOLD (XAU/USD)
Date: Nov 3, 2025
Main Timeframe: M30 – H1
Strategy: SMC + Trendline Structure + Supply/Demand Zones
🌐 MARKET CONTEXT
Gold continues to consolidate inside a symmetrical triangle, forming clear supply and demand zones within a tightening range.
Current structure shows a bearish bias below 4039 but still holding a bullish base above 3970–3980.
Both buyers and sellers have clear liquidity zones to play from — ideal for short-term reactions and fade setups.
📈 TECHNICAL OUTLOOK
🔹 BUY SCENARIO 1 (Main Setup)
BUY 3980 – 3978
→ SL: 3973 (6 pips)
→ TP1: 4010 | TP2: 4038
Structure support + local BOS. Wait for bullish rejection or engulfing confirmation.
R:R ≈ 5–9 depending on TP target.
🔹 BUY SCENARIO 2 (Aggressive Entry)
BUY 3970 – 3968
→ SL: 3963
→ TP1: 4000 | TP2: 4038
Deep retest into lower trendline + demand imbalance zone.
Only valid if market respects structure and holds above 3960.
🔸 SELL SCENARIO 1
SELL 4027 – 4029
→ SL: 4034
→ TP1: 4000 | TP2: 3970
Short from supply zone with bearish CHoCH confirmation on lower timeframe.
Rejection at this level can target liquidity below 3980.
🔸 SELL SCENARIO 2 (Higher Supply)
SELL 4037 – 4039
→ SL: 4044
→ TP1: 4010 | TP2: 3970
This is the weak high area — potential sweep zone before reversal.
Look for liquidity grab + bearish candle confirmation before entry.
🧩 STRUCTURE RECAP
Bias: Range-bound → Bearish within triangle
BOS / CHoCH: Confirmed on M30 around 4029 zone
Weak High: 4039
Strong Support: 3970–3980
Major Resistance: 4045–4128
⚙️ TRADE MANAGEMENT
Risk per setup ≤ 1–2%
Move SL → BE after TP1
Avoid entries during high-impact news
Wait for confirmation (no blind limits)
🧠 SUMMARY
Gold is ranging within a compressed structure, where shorts from supply and buys from demand both align with liquidity targets.
The cleanest play remains:
→ Buy near 3978 / Sell near 4038, trade between zones until a breakout occurs.
If price breaks and holds above 4045, expect bullish continuation to 4128.
If breaks below 3960, bearish expansion likely resumes toward 3920.

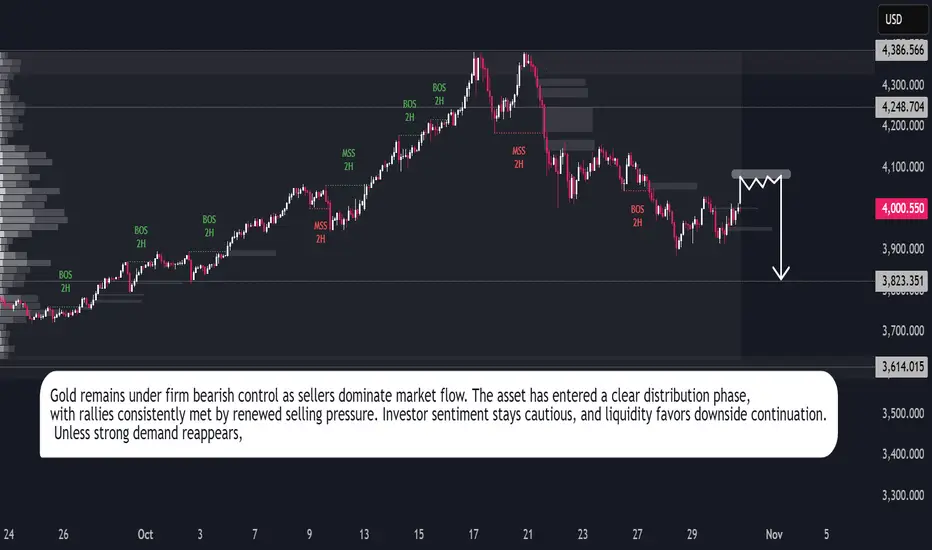
Gold Outlook: Bears Stay in ControlGold continues to operate within a bearish market environment characterized by persistent liquidation and declining momentum. The recent structural shift reflects an ongoing reallocation of capital away from defensive metals toward higher-yield instruments, signaling a broader change in market positioning.
Trading activity indicates that each upward movement is being met with renewed selling interest, suggesting limited participation from institutional buyers. This behavior aligns with the prevailing sentiment of caution, as investors prioritize stability over speculative exposure.
The broader outlook remains subdued, with market conditions favoring continued downside until clearer evidence of renewed demand emerges. Gold’s performance reflects a phase of market adjustment, where declining liquidity and moderate volatility reinforce the persistence of bearish sentiment across the short-term horizon.
AUD/CAD Approaching Support: Strong Bounce IncomingAUD/CAD has finished a strong 5-wave move to the upside, completing Wave (1)/(A). Since then, price has been moving in a corrective channel and is now forming an A-B-C decline toward the lower support zone. The current structure suggests one more push down to complete Wave C of (2)/(B), where buyers are likely to step back in. Once that final dip finishes, the chart expects a powerful Wave (3)/(C) rally to the upside, targeting new highs. In simple terms: small drop left → correction ends → strong bullish continuation ahead.
Stay tuned!
@Money_Dictators
Thank you :)

Gold Declines as Sellers Dominate the MarketGold is undergoing a controlled correction phase after an extended period of sustained gains. Market behavior over recent sessions reflects a shift from expansion to contraction as liquidity flow decreases and momentum weakens across key time horizons.
The previous upward cycle attracted substantial speculative interest, but current market dynamics suggest profit-taking by institutional participants and reduced accumulation from large holders. The recent structural shift confirms that sentiment has turned defensive, aligning with global market caution amid evolving economic conditions.
Despite short-term consolidation, the broader setup indicates that gold remains sensitive to global financial stability concerns and policy signals. Market participants are now waiting for clarity on upcoming economic data and interest rate outlooks, which could determine whether the correction deepens or transitions into a new accumulation phase.
In the near term, volatility is expected to remain elevated as investors reassess exposure levels. The prevailing outlook maintains a cautious bias, with traders closely observing how price reacts to continued shifts in liquidity and macro sentiment. Sustained capital outflow from hedge assets could pressure gold further, while renewed demand for safety could limit downside potential in the medium term.

Euro Under Pressure from Strong USDThe euro continues to show weakness against the dollar as global risk sentiment cools and investors shift toward safer assets. Market participants remain cautious ahead of key inflation data from the Eurozone and upcoming comments from Federal Reserve officials, which could clarify the next phase of U.S. monetary policy.
The recent euro recovery attempts have met consistent supply, reflecting pressure from subdued European growth and stronger U.S. economic resilience. The dollar remains supported by robust labor market conditions and persistent inflation expectations, which sustain demand for U.S. yields and Treasury assets.
Liquidity patterns suggest that institutions are still offloading positions near recent highs, keeping EUR/USD confined within a broader corrective cycle. Energy price fluctuations and diverging rate expectations between the ECB and the Fed continue to weigh on sentiment.
Overall, the pair remains under macroeconomic strain, with capital flows favoring the dollar as global markets seek stability am

EURUSD Outlook: Dollar Dominance Extends as Euro WeakensThe EURUSD pair remains under downward pressure as investors continue favoring the U.S. dollar amid global economic uncertainty. The Federal Reserve’s consistent stance on keeping interest rates higher for longer has reinforced the dollar’s appeal, while weak Eurozone data — including sluggish industrial output and fading consumer confidence — has weighed on the euro’s recovery.
Market sentiment shows limited bullish strength for the euro, with traders closely monitoring upcoming U.S. inflation and ECB policy comments. Unless the Eurozone presents stronger economic momentum or fiscal support, the euro is likely to remain on the defensive.
Overall, the fundamental tone supports continued USD dominance. The broader market structure reflects bearish tendencies for EURUSD in the medium term, with investors preferring dollar exposure as a safer bet amid global uncertainty.

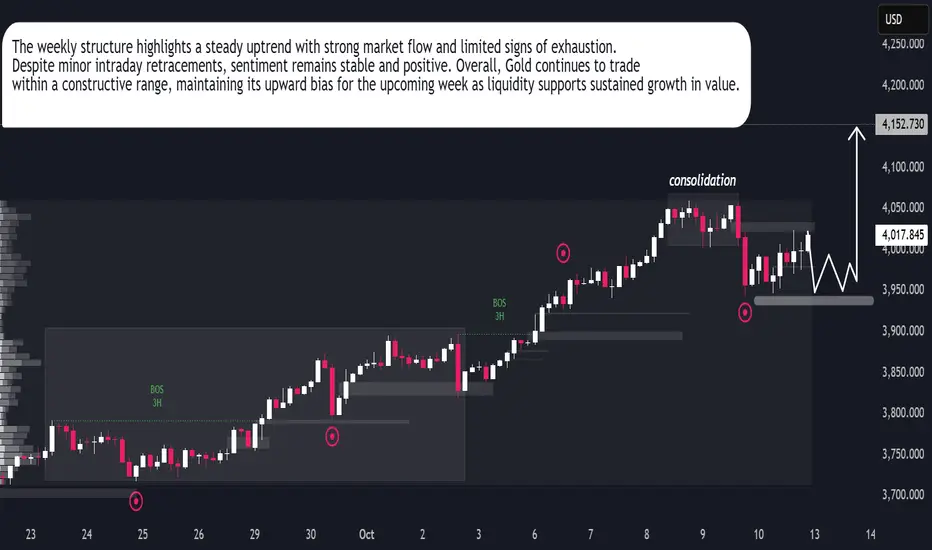
XAUUSD | Bulls Maintain Weekly ControlGold continues to display firm momentum as investor confidence remains stable despite short-term fluctuations. The latest weekly candle structure shows price holding within a steady consolidation range, signaling accumulation rather than weakness. Market behavior suggests large participants are preparing for another expansion phase after absorbing liquidity in the lower zones.
Institutional interest remains evident, with consistent buying pressure observed on dips, indicating sustained optimism for further growth. The current behavior aligns with broader market sentiment favoring safe-haven assets amid global uncertainty. Overall, Gold retains its dominance as capital flows stay supportive of the uptrend, positioning the metal for renewed strength in the upcoming sessions.
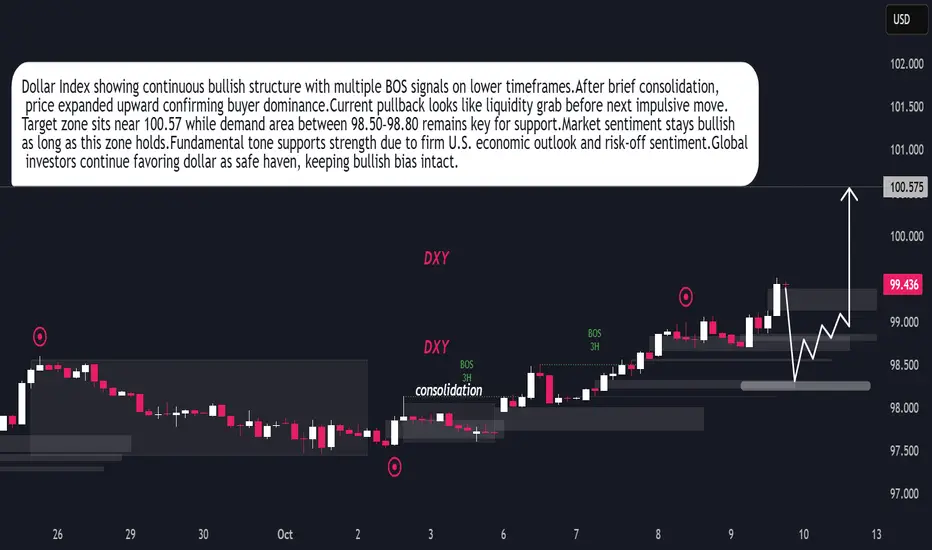
DXY Ready for Next Bullish Leg After Liquidity SweepDollar Index maintaining bullish structure after recent BOS on 3H timeframe.Market formed consolidation phase early October before expansion.Buyers showing control pushing price towards 100.57 objective.Current retracement indicates liquidity grab before next bullish impulse.Demand zone 98.50–98.80 remains key area for continuation.Technical sentiment stays positive as long as price holds above 98.50.Fundamentally, dollar supported by strong U.S. data and cautious global tone favoring safe-haven demand.Momentum outlook remains bullish with potential continuation toward 100.50+ zone.
AUDNZD Trading Idea – Momentum & Liquidity OutlookThe pair has been in a clear expansion phase, showing strength after multiple structure breaks. Momentum has favored the upside, while recent consolidation reflects market participants taking profits and rebalancing orders.
A corrective wave appears to be unfolding, which is typical after strong impulsive moves. Such phases often allow liquidity collection before the next directional expansion. The broader sentiment suggests that buyers are still active, but short-term volatility may create temporary pullbacks.
Educational Note: Markets move in cycles of impulse and correction. Recognizing these phases helps traders avoid chasing moves and instead prepare for continuation opportunities once the correction stabilizes.

USDCAD Analysis – Market Recovery and Bullish OutlookUSDCAD Analysis – Market Recovery and Bullish Outlook
USDCAD Market Report
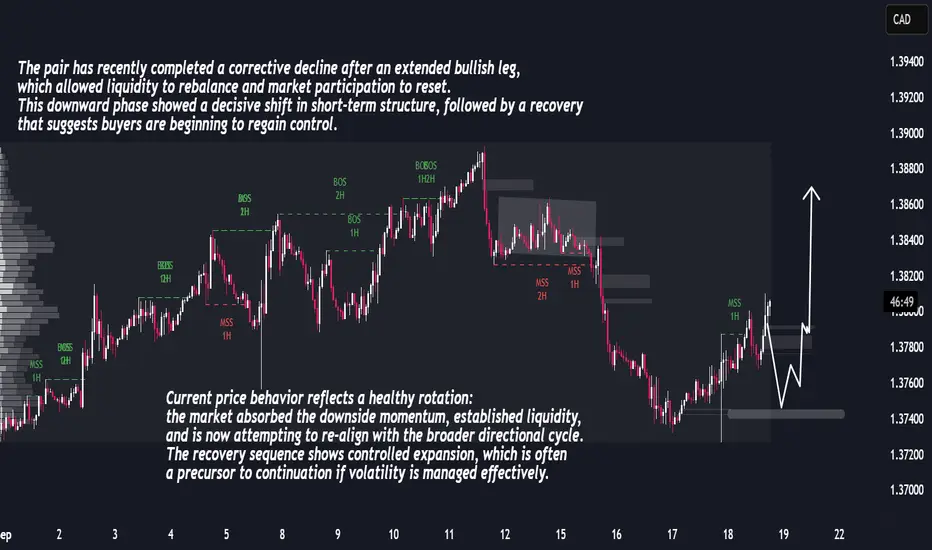
USDCAD is emerging from a completed downside leg into a constructive recovery cycle. The prior bearish momentum created imbalance, but recent order flow shows that liquidity has been absorbed, allowing buyers to regain control. The transition reflects a clean structural shift, where corrective pressure is evolving into directional expansion.
The sequence of price action highlights disciplined progression: accumulation at lower levels, controlled impulsive candles, and measured volatility. This behavior signals that the market is not in exhaustion but in the early stages of a potential bullish leg. The rotation from decline into expansion suggests renewed confidence from larger market participants.
Looking ahead, the pair remains positioned for continuation. The rhythm of correction followed by orderly advancement underlines a resilient structure, with market dynamics favoring sustained upside development in the medium term.
GBPJPY Analysis – Bullish Outlook and Market ForecastGBPJPY Analysis – Bullish Outlook and Market Forecast
GBP/JPY Market Outlook
The structure of GBP/JPY continues to highlight an orderly bullish cycle. Price action is showing clear phases of expansion, retracement, and continuation, reflecting strong market rhythm rather than random volatility. Recent break-of-structure signals confirm that short-term corrections are consistently being absorbed, with liquidity cycles providing fuel for further upside development.
The current pullback is part of a healthy market rotation, where positioning is reset before the next directional move. This type of behavior often signals strength, as it reflects deeper participation rather than exhaustion. The broader flow suggests that buyers remain in control, with momentum favoring sustained upside progression over the medium term.
In summary, GBP/JPY is maintaining structural integrity, with corrections serving as opportunities within an established bullish framework. The outlook remains constructive, supported by consistent market behavior and trend alignment.

GBPAUD Forecast – Liquidity Sweep Before Strong Upside RallyGBPAUD has been moving through an extended bearish cycle, confirmed by multiple downside breaks of structure that signaled strong sell-side control. Each leg cleared liquidity and left inefficiencies behind, reflecting a market environment dominated by distribution phases. Recently, however, the dynamics are shifting. Price action has begun to compress, with shorter bearish candles and emerging higher lows that point toward weakening seller momentum and the early signs of accumulation.
Order flow analysis suggests that institutional participants may be absorbing positions within the current range. The market appears poised to engineer a downward liquidity sweep to trigger weak longs and attract late sellers before reversing upward. This type of behavior is typical of smart money accumulation phases, where liquidity is harvested before expansion.
Volume and volatility add weight to this narrative. Downside moves are losing strength, showing seller exhaustion, while volatility has contracted, signaling the market is coiling energy for a breakout. Given the structural setup and liquidity positioning, the probability favors a bullish expansion following a brief dip.