EURUSD – Clean HTF Discount Zone Re-test With Bullish ContinuatiPrice has returned into a deep HTF discount zone, and the reaction from this area aligns well with my overarching bullish narrative. The marked zones represent the regions where I want to see LTF confirmational behavior before considering any long entries.
The structure remains intact as long as price holds above the lower boundary of the zone. A decisive close below that level will invalidate the bullish bias completely and shift the entire directional expectation.
Bullish Path:
• Price taps into the discount zone
• LTF confirms accumulation / BOS
• Price pushes toward the mid-structure continuation level
• Final objective lies near the upper liquidity pool (DOL), assuming underlying conditions remain unchanged
Key Levels Noted on the Chart:
• Entry Interest: All highlighted zones (LTF confirmation required)
• Mid-structure Expectation: Level where I want price to show EDD for continuation
• Final DOL Target: Only if macro conditions remain aligned
• Bias Invalidation: A clean close below the lower major zone
⚠️ ENTRY CONDITION (IMPORTANT):
I will execute the trade only if the LTF mirrors the structural behavior I’m expecting from the HTF.
No LTF confirmation = No trade.
Forexsetup

USDJPYHello & welcome to this analysis
It failed to reverse from the Bullish Harmonic Cypher pattern.
Now next bullish harmonic pattern is the Alt Shark at 137.75 while 141.80 appears to be a very strong resistance now

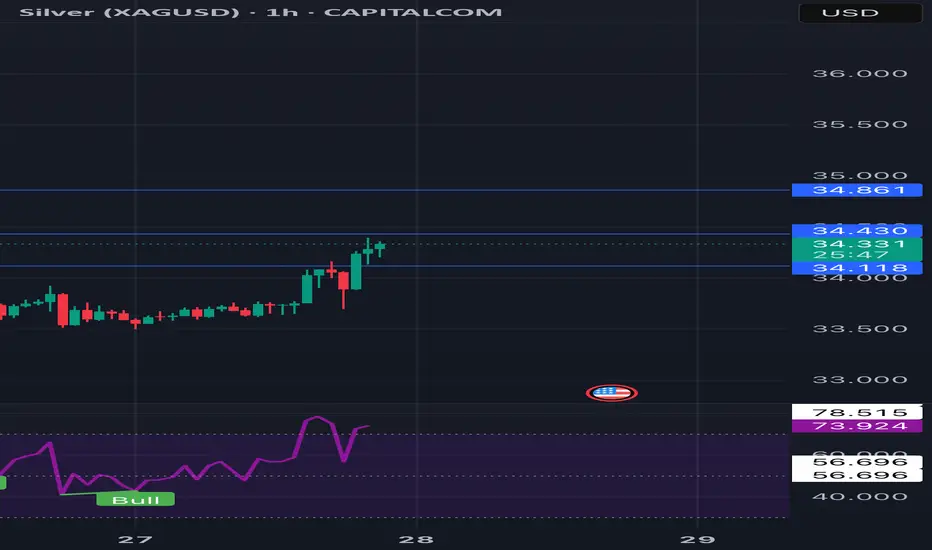
Silver Price Alert: Is XAG/USD Headed for $34.108? Learn Why!"Join us for an educational session on XAG/USD as we analyze key market trends and technical signals pointing to a potential drop toward $34.108. Understand the factors driving gold prices and gain insights to improve your trading strategy!
#chartanalysis
#xagusd
#trendanalysis
GBPNZD - Channel Boundaries in Play! What’s Next?The weekly chart of GBPNZD shows price action respecting an ascending channel structure. The pair has been moving within a well-defined ascending channel since early 2023.
GBPNZD weekly chart highlights price action within an ascending channel structure with key levels in play. Watch for bullish opportunities near the support zone at 2.1400–2.1800 or bearish continuation if price breaks below this zone. What’s your bias? Let me know in the comments! #GBPNZD #Forex #TechnicalAnalysis
Disclaimer:
This analysis is for informational purposes only and should not be considered financial advice. Forex trading involves significant risk of loss and may not be suitable for all investors.

EUR/USD Daily Chart Analysis – Smart Money Perspective
Current Market Bias: Bearish
The price action indicates that the overall structure remains bearish, with lower highs and lower lows being formed. Despite recent bullish retracements, the price has failed to break key resistance levels, signaling that sellers remain in control.
Key Areas on the Chart:
1. Order Block (OB) & Fair Value Gap (FVG) Zone:
• The highlighted gray zone represents an order block (OB), which is a supply area where institutions likely placed large sell orders.
• The presence of a fair value gap (FVG) within this zone indicates an inefficiency in price, making it a strong area for potential reversals.
• Price recently tapped into this area and reacted downward, confirming bearish momentum.
2. Liquidity Grab Possibility:
• The lower dashed line represents a previous swing low, where liquidity (stop-loss orders) is likely resting.
• Smart Money often seeks liquidity before reversing or continuing trends.
• There is a high probability that price will sweep this low before any potential bullish move occurs.
3. Market Structure Shift for a Bullish Setup:
• Although the bias remains bearish, a market structure shift (MSS) is required before considering any long (buy) setups.
• A key level to watch is 1.05351, where a break above could signal a reversal.
• Until then, selling pressure is likely to dominate.
Conclusion & Trade Plan:
• Bearish bias remains active.
• Price might sweep the previous low to grab liquidity before a potential reversal.
• A confirmed market structure shift above 1.05351 is required for bullish confirmation.
• Until that happens, traders should focus on shorting opportunities near supply zones or order blocks.
Final Thought:
By following Smart Money Concepts (SMC), traders can align their trades with institutional movements. Patience is key—wait for confirmations before entering positions. Keep an eye on liquidity sweeps and market structure shifts for the best trade setups.

Gold Expected Move Gold expected move for today
Xauusd can give a good drop initially till 2621 and then shall give a sharp long move till 2647-48

EURJPY SHOWING A GOOD UPWARDMOVE WITH 1:10 RISK REWARD EURJPY SHOWING A GOOD UPWARD MOVE WITH 1:10 RISK REWARD
DUE TO THESE REASON
A. its following a rectangle pattern that stocked the market
which preventing the market to move any one direction now it trying to break the strong resistant lable
B. after the break of this rectangle it will boost the market potential for break
C. also its resisting from a strong neckline the neckline also got weeker ald the price is ready to break in the outer region
all of these reason are indicating the same thing its ready for breakout BREAKOUT trading are follws good risk reward
please dont use more than one percentage of your capitalfollow risk reward and tradeing rules
that will help you to to become a bettertrader
thank you

EURJPY(h1) : Entry Buy Now Hello Traders,
📈 EJ chart review :
- D1 candle has got a strong reversal
- H1 has got a swing higher high and higher low, so it is a uptrend on h1 timeframe
🎯In my trading opinion:
- You can buy here, now.
📚 Remember that: Always follow your trading plan regarding entry, risk management, and trade management.
Good luck!

Usoil Order Block | SWING TRADEUSOIL SWING TRADE
Usoil 1hr Order Block This Order block is vimp because its
1 hr POI.
At this level we can see some Liquidty pool.
Here we can take trade with 5 min CHoCH.
Follow for Daily Forex Update
Note - Only for education purpose.

XAUUSD or LongMy view on this script Bullish
Ofter breaking Resistance with good dynamics
I took long entry...💹💲

EURUSD Order Block |SWING TRADE EURUSD SWING TRADE
EURUSD Order Block This Order block is vimp because its
1DAY Demand Zone.
At this level we can see some Liquidty pool.
Here we can take trade with 15 min CHoCH.
Follow for Daily Forex Update
Note - Only for education purpose.

Usoil Order Block | SWING TRADEUSOIL SWING TRADE
Usoil 1hr Order Block This Order block is vimp because its
1 hr + 4Hr Demand Zone.
At this level we can see some Liquidty pool.
Here we can take trade with 5 min CHoCH.
Follow for Daily Forex Update
Note - Only for education purpose.

Usoil Order Block | SWING TRADEUsoil 1hr Order Block
At this level we can see some Liquidty Pool.
Take trade at after 8:30 PM.
in 5 Min CHoCH.
Follow For Daily Update.
Note - Only for Education Purpose

NZDCAD - Swing Trade on Buy SideSymbol - NZDCAD
NZDCAD is currently trading at 0.80920
I'm seeing a trading opportunity on buy side.
Buying NZDCAD pair at CMP 0.80920
I will be adding more if 0.80200 comes & will hold with SL of 0.79000 - 0.79200
Targets I'm expecting are 0.82500 - 0.82800 & beyond.
Disclaimer - Do not consider this as a buy/sell recommendation. I'm sharing my analysis & my trading position. You can track it for educational purposes. Thanks!

BTC SHORT SETUP BTC SHORT SETUP
Trendline Breakdowns are some fo the Best Setups to trade with very easy and sharp levels
BTC trendline breakdown
1% Trade Opportunity
Entry level 70550
Target 69550 600

EURUSD took Dot Support from our LevelEURUSD took Dot Support from our Level
Eurusd took perfect support from 15 min FVG & Daily FVG and now heading towards its Target
Target 1.09655 - 1.09995

Usoil Order Block | SWING TRADEUSOIL SWING TRADE
Usoil 1hr Order Block This Order block is vimp because its
1 hr + 4Hr Demand Zone.
At this level we can see some Liquidty pool.
Here we can take trade with 5 min CHoCH.
Follow for Daily Forex Update
Note - Only for education purpose.

AUDUSD buy ideaPossible AUDUSD trade idea
can look for buys from above mention level
above setup is 1:3 RR
please manage risk properly
Enter at your own risk !
Indicator based SMC approach.
follow and like for more such setups.

XAU/USD is clearly bearing after fed affirmation of possible cutToday we can look for sell opportunities around 2031 , For a target of 2009- 2002 , Market has turned bearish yesterday after announcement of the following.
Fed's Waller: Data in the last few months allowing Fed to consider cutting rates this year
Waller Q&A: It will be up to committee on timing of when to start cuts
Also the technical indicators, H4 & D1 charts suggesting further bearish momentum throughout the day. Stops should be above 2042.00

AUD/CHF PAIR VIEW As Per Chart We Can See This Pair have Formed Double bottom And Also Given Breakout .
So Now It could Be good Swing Trade For Buy Side With Stop loss Around 0.57624 .
Disclaimer :- Trade With Your Risk management .


Audnzd breakout - Forex analysis Audnzd has shown a breakout after a bullish impulse move and consolidating.
We are expecting price to continue moving upside.

usdjpy long setup usdjpy long setup after liquidity breach
if we can find internal liquidity between
