XAUUSD – Bullish Continuation, ATH Expansion Still in PlayGold continues to trade within a strong bullish channel, maintaining its ATH expansion structure. The recent pullback is corrective in nature and shows clear signs of liquidity absorption rather than distribution.
On the macro side, sustained USD weakness, safe-haven flows, and a still-cautious Fed outlook keep gold supported at elevated levels.
➡️ This environment favors trend continuation, not top-picking.
Structure & Price Action
H1 structure remains bullish with Higher Highs and Higher Lows intact.
The recent drop has respected key demand zones and the ascending trendline.
No bearish CHoCH confirmed → downside moves remain corrective.
Price is rebalancing after an impulsive leg, preparing for the next expansion.
Key takeaway:
👉 Pullbacks are opportunities to position with the trend, not signs of reversal.
Trading Plan – MMF Style
Primary Scenario – BUY the Pullback
Focus on patience and structure confirmation.
BUY Zone 1: 5,045 – 5,020
(Rebalance area + intraday demand)
BUY Zone 2: 4,985 – 4,960
(Trendline confluence + deeper liquidity)
➡️ Only execute BUYs after bullish reaction (rejection wicks / structure hold).
➡️ Avoid chasing price at highs.
Upside Targets (ATH Extension):
TP1: 5,106
TP2: 5,198 (upper extension zone)
Alternative Scenario
If price holds firmly above 5,106 without a meaningful pullback, wait for a break & retest to join continuation BUYs.
Invalidation
A confirmed H1 close below 4,960 would weaken the bullish structure and require a reassessment.
Summary
Gold remains in a controlled ATH expansion phase. As long as structure and demand zones hold, the path of least resistance stays to the upside.
The MMF approach remains unchanged: buy pullbacks, follow structure, and let the trend do the work.
Forextrading

Gold in Decision Zone – GAP Reaction Defines Next MoveMarket Context (Fundamentals → Flow)
Recent sessions continue to be driven by elevated geopolitical and macro uncertainty. Risk sentiment remains fragile as markets reassess global political tensions and their implications for trade, energy routes, and monetary stability.
As a result:
USD remains under pressure, lacking strong follow-through buying.
Equities show signs of fatigue near highs.
Gold continues to attract defensive flows, keeping the broader bullish structure intact.
This environment supports trend continuation, but not without technical pullbacks.
Technical Structure (H1–H4)
Gold is trading within a well-defined ascending channel.
Multiple BOS (Break of Structure) confirm the bullish trend.
The recent impulsive leg created a bullish GAP / imbalance.
Price is now reacting near the mid-channel decision zone, where continuation vs. deeper retrace is decided.
➡️ Trend is bullish, but location matters.
Key Levels to Watch
Current resistance: 5,080 – 5,100
GAP / reaction zone: 5,020 – 5,000
Major demand (FVG): 4,960 – 4,940
Invalidation: H1 close below 4,940
Scenarios (If – Then)
Scenario 1 – GAP Holds (Primary Bias)
If price holds above 5,000
Buyers defend the imbalance
→ Continuation toward 5,120 – 5,180 within the channel.
Scenario 2 – Deeper Pullback (Healthy Correction)
If price loses 5,000
Expect a retrace into 4,960 – 4,940 FVG.
Bullish reaction here keeps the higher-timeframe trend intact.
Only a clean break and acceptance below 4,940 would weaken the bullish structure.
Summary
Gold is not topping — it is pausing at a decision zone. In a risk-sensitive environment, pullbacks are opportunities, not threats.

GBP/AUD: Corrective Rally, Downtrend IntactGBP/AUD is trading in a clear bearish Elliott Wave structure on the 4H timeframe. The market has already completed a strong impulsive decline and is currently moving in a Wave 4 corrective pullback, which is happening inside a downward channel and near key Fibonacci retracement levels. This correction looks weak and corrective, suggesting sellers are still in control. As long as price remains below the invalidation level around 2.0050 , the bearish bias stays valid. The expectation is for the correction to finish soon, followed by Wave 5 to the downside, targeting the lower channel area and the 1.96–1.95 zone. Overall, the trend remains bearish, and any short-term bounce is likely a selling opportunity before the next leg lower.
Stay tuned!
@Money_Dictators
Thank you :)

GBPUSD – Support Holding, Watching Reaction From RangeGBP/USD has reacted from a well-defined support zone, an area where buyers have stepped in multiple times before. Price is currently trading between clear support and resistance, indicating a short-term range environment.
As long as this support holds, upside reactions toward the resistance zone remain possible. A clean break below support, however, would weaken this structure and change the short-term bias.
This is a reaction-based zone, not a prediction. Let price confirm the next move.
Disclaimer: This analysis is for educational purposes only and does not constitute financial advice. Trading involves risk. Please manage risk responsibly.

XAUUSD – H1: Strong UptrendXAUUSD – H1 Technical Outlook: Extension Risk Near Highs as Geopolitical Tension Builds | Lana ✨
Gold continues to trade in a strong bullish structure, with price pushing higher along an ascending trendline. However, as the market approaches upper resistance zones, price action suggests the rally may be entering a more sensitive phase, where extension risk and volatility increase.
📈 Market Structure & Price Action
The short-term trend remains bullish, with price respecting the rising trendline.
Recent price action shows strong impulsive buying, followed by shallow pullbacks — a sign of aggressive demand.
However, price is now trading near the upper boundary of the trend channel, where upside continuation often becomes less efficient and more reactive.
The current structure favors continuation, but risk increases as price stretches further from value.
🔍 Key Technical Zones on H1
Immediate resistance / reaction zone: 4987 – 5000
This area represents a short-term ceiling where price may hesitate or form a temporary consolidation.
Sell zone (extension area): 5053 – 5070
A premium zone where upside becomes increasingly extended and profit-taking or corrective reactions are more likely.
Key support & value zones below:
4663 – 4629 (prior acceptance + structural support)
4595 – 4570 (deeper value area aligned with Fibonacci retracement)
These lower zones remain important reference points if price transitions from extension into correction.
🎯 Trading Scenarios
Primary scenario (bullish continuation):
If price consolidates above 4987 and accepts higher, the market may extend into the 5053–5070 zone. Any move into this area should be monitored closely for exhaustion signals rather than late breakout chasing.
Alternative scenario (pullback into structure):
Failure to hold above 4987–5000 could trigger a corrective move back toward 4663–4629, where buyers may look to re-engage at better value.
Lana prefers waiting for reactions at key zones, not chasing price when it is already extended.
🌍 Geopolitical Context (Why Volatility Matters Now)
Recent reports indicate that the USS Abraham Lincoln carrier strike group has entered the Indian Ocean, with expectations of moving toward the Arabian Sea in the coming days. The increased U.S. military presence in the Middle East, amid concerns of potential escalation involving Iran, adds a layer of geopolitical uncertainty.
Historically, such developments tend to:
Increase short-term volatility in gold
Support gold as a hedge, while also triggering sharp profit-taking swings
This backdrop reinforces the importance of risk management and patience, especially when price is trading near premium zones.
🧠 Lana’s Perspective
Gold remains bullish, but not every bullish phase is a good place to buy. As price trades higher into premium and extension zones, Lana focuses on structure, value, and reaction, not emotional momentum.
✨ Respect the trend, manage extension risk, and let price come to your levels.

XAUUSD (H3) – Liam PlanXAUUSD (H3) – Liam Plan
Late-stage expansion | Look for distribution and sell reactions
Quick summary
Gold has rallied aggressively and is now trading in late-stage bullish expansion, sitting near premium pricing after multiple impulsive legs.
On the macro side, political commentary from Europe highlights a structural shift in global power:
Europe’s influence is weakening as US–Russia discussions bypass Brussels.
BRICS and SCO now represent over half of the world’s population.
Calls for renewed EU–Russia energy cooperation underline long-term uncertainty in Europe’s geopolitical positioning.
This backdrop keeps gold structurally supported, but at current levels, risk shifts toward distribution rather than clean continuation.
Macro context (supportive, but asymmetric risk)
The global balance of power continues to shift from West to East, reinforcing long-term demand for hard assets.
However, much of the near-term geopolitical premium is already priced in after the recent vertical move.
Result: upside continuation is possible, but risk/reward now favors reaction sells over fresh buys.
➡️ Conclusion: don’t fight the macro trend, but don’t chase price either.
Technical view (H3 – based on the chart)
Gold remains in a broader uptrend, but price action shows signs of deceleration and potential distribution near the highs.
Key levels from the chart:
✅ Premium sell zone: 5000 – 5050 (upper range / distribution area)
✅ Sell reaction zone: 4920 – 4950 (local highs / rejection area)
✅ Bullish retracement support: 4700 – 4750 (fib + structure)
✅ Major liquidity / deep support: 4350 – 4450
Price is trading far above equilibrium, increasing the probability of rotation back into value or sell-side liquidity.
Trading scenarios (Liam style: trade the level)
1️⃣ SELL scenarios (priority – late-stage reaction)
A. SELL at premium / distribution zone
✅ Sell: 5000 – 5050
Condition: clear rejection / loss of momentum on M15–H1
SL: above the high
TP1: 4920
TP2: 4750
TP3: 4450 (if distribution expands)
Logic: Late-stage rallies often form rounded tops or distribution patterns before rotating lower. This zone favors risk-defined shorts, not breakout buys.
B. SELL lower high / reaction
✅ Sell: 4920 – 4950
Condition: failure to hold highs + bearish shift on lower TF
TP: 4750 → 4450
Logic: This area acts as a reaction zone inside the distribution range — ideal for tactical sells.
2️⃣ BUY scenario (secondary – value only)
BUY only at deep retracement
✅ Buy zone: 4350 – 4450
Condition: liquidity sweep + strong bullish reaction
TP: 4700 → 4920
Logic: This is the first area where long-term buyers regain a clear R:R edge. No interest in buying above value.
Key notes
Late-stage trends punish impatience.
Avoid mid-range entries.
Expect false breakouts near the highs.
Confirmation > conviction.
What’s your bias here:
selling distribution near the highs, or waiting patiently for a deeper pullback into 4700–4450 value?
— Liam

USD/CHF Approaching Breakdown from RangeUSD/CHF is moving in a sideways corrective pattern, not a strong trend. The price is forming an A-B-C-D-E structure, which usually happens before the market makes a bigger move. Right now, price is in the last part of this pattern (wave E) and is sitting near a resistance area, where it has failed to move higher and has started to turn down. This behavior often means sellers are becoming stronger. As long as the price stays below 0.795–0.798 , the outlook remains bearish, and the market is expected to move lower toward the 0.782–0.775 support area. If this move happens, it would complete the corrective pattern after a short pause, and then the market can decide its next big direction.
Stay tuned!
@Money_Dictators
Thank you :)

XAUUSD (H4) – Liam Buying StrategyXAUUSD (H4) – Liam Continuation Plan
Trend remains strong, but price is extended | Buy pullbacks, not highs
Quick summary
Gold continues to trade firmly within a strong bullish structure. Macro pressure on safe-haven demand has eased slightly as US–EU geopolitical and trade tensions cool, while rising oil prices (supported by Saudi Aramco’s demand outlook) keep inflation expectations alive.
Despite the bullish trend, price is currently extended near the upper range, so execution today should focus on buying pullbacks at structure, not chasing breakouts.
Macro context (supportive, but less explosive)
Reduced geopolitical friction between the US and Europe has eased panic-driven flows.
Oil prices pushing higher keeps inflation expectations sticky, limiting downside pressure on gold.
USD remains relatively stable (USD/CAD holding firm), suggesting gold strength is structure-driven rather than pure fear trade.
➡️ Conclusion: trend-friendly environment, but volatility is now more technical than headline-driven.
Technical view (H4 – based on the chart)
Gold is respecting a clean ascending trendline, with impulsive legs followed by shallow pullbacks.
Key levels from the chart:
✅ Upper extension / continuation target: 5000+ zone
✅ Bullish continuation buy zone: 4580 – 4620 (previous breakout + fib support)
✅ Trendline support: dynamic (ascending)
✅ Deeper correction support: 4400 – 4450
Price is currently trading above the 1.618 fib expansion, which increases the probability of short-term consolidation or pullback before continuation.
Trading scenarios (Liam style: trade the level)
1️⃣ BUY scenarios (priority – trend continuation)
A. BUY pullback into structure (preferred setup)
✅ Buy zone: 4580 – 4620
Condition: hold above trendline + bullish reaction on M15–H1
SL: below structure / trendline
TP1: recent high
TP2: 4900
TP3: extension toward 5000+
Logic: This zone aligns with prior resistance turned support and fib retracement — a higher-probability continuation entry than buying highs.
B. BUY deeper dip (only if volatility increases)
✅ Buy zone: 4400 – 4450
Condition: strong rejection / liquidity sweep
TP: 4580 → 4800+
Logic: This is the last clean structural support within the current trend. A dip here would likely be corrective, not trend-ending.
2️⃣ SELL scenario (counter-trend, tactical only)
❌ No swing SELL bias while price holds above the ascending trendline. Shorts only make sense as very short-term scalps at highs with clear lower-TF rejection.
Key notes
Strong trends punish impatience — wait for pullbacks.
Avoid entries mid-leg after impulsive candles.
If price accelerates vertically without retrace, stand aside.
What’s your approach: waiting for the 4580–4620 pullback to join the trend, or staying flat until a deeper correction toward 4450?
— Liam

XAUUSD – ATH now normal, $5,000 target.Market Context – When ATH Is No Longer a Spike
Gold has entered a phase where every pullback is being aggressively bought, signaling strong institutional acceptance of higher prices. The market is no longer reacting emotionally to new highs — instead, ATHs are forming within structure, not as exhaustion.
With:
Persistent safe-haven demand
A cautious Fed outlook
Ongoing geopolitical and macro uncertainty
➡️ $5,000 is evolving from a psychological level into a realistic technical target.
Structure & Price Action (H1)
Bullish structure remains intact with Higher Highs and Higher Lows.
Current declines are corrective pullbacks, not reversals — no bearish CHoCH confirmed.
Price continues to respect the ascending channel and demand zones, confirming trend continuation.
Key takeaway:
👉 No distribution signs at the top — ATHs are being defended by structure.
Trading Plan – MMF Style
Primary Scenario – Trend-Following BUY
Focus on buying pullbacks, not chasing ATH:
BUY Zone 1: 4,837 – 4,782 (Demand + trendline confluence)
BUY Zone 2: 4,713 (Deeper IP / demand zone)
➡️ Execute BUYs only after clear bullish reactions.
➡️ Avoid FOMO at extended levels.
Upside Targets (ATH Continuation):
TP1: 4,919
TP2: 5,027 (Extension zone approaching the $5,000 milestone)
Alternative Scenario
If price holds above 4,919 without a meaningful pullback, wait for a break & retest before looking for continuation BUYs.
Invalidation
H1 close below 4,713 invalidates the bullish structure and requires a full reassessment.
Summary
Gold remains in ATH continuation mode. The optimal strategy is not trying to top-pick, but patiently buying pullbacks in alignment with higher-timeframe flow. At this stage, $5,000 is no longer a question of “if” — only “when.”

EURUSD – Breakout From Falling Resistance, Retest Holding WellEUR/USD was trading under a falling resistance trendline for a long time, with sellers consistently stepping in at higher levels. Recently, price managed to break above this trendline, which was the first sign that bearish pressure was easing.
After the breakout, price came back for a retest of the broken structure and previous resistance area. This retest is holding well so far, showing that buyers are defending the level and not allowing price to slip back below the structure.
What stands out here is how price respected the retest and then pushed higher, leaving behind a small imbalance. This often indicates acceptance above the breakout level rather than a false move.
As long as price holds above the retest zone and structure support, the path of least resistance remains to the upside, with higher resistance levels marked on the chart. A clean breakdown below this area would invalidate the bullish view.
This is a structure-based idea, not a prediction. Let price continue to confirm.
Disclaimer: This analysis is for educational purposes only and does not constitute financial advice. Trading involves risk. Please manage risk responsibly.

GBPUSD – Breakout Retest Looks Healthy, Bulls in ControlGBP/USD has been trading below a falling resistance trendline for quite some time. Recently, price managed to break above this trendline, which is the first sign that selling pressure is weakening.
After the breakout, price did not continue straight up. Instead, it came back for a retest, and that retest is holding well so far. This is usually a healthy sign, showing that buyers are willing to step in at higher levels instead of letting price fall back below structure.
What Price Is Telling Us:
Price is respecting the previous resistance as support and forming higher lows. Sellers are trying, but they are unable to push price back below the trendline. This behavior often appears when the market is preparing for continuation rather than reversal.
As long as price holds above this zone, the bullish bias remains intact, with upside levels marked on the chart. A clean breakdown below the structure would invalidate this view.
This is a structure-based idea, not a prediction. Let price do the work.
If this analysis helped you, like, follow, and comment for more clean Forex breakdowns.
Disclaimer: This analysis is for educational purposes only and does not constitute financial advice. Trading involves risk, and past performance does not guarantee future results. Please manage risk responsibly.

USDCHF – Gap Down From Resistance, Price Testing Key Support!USD/CHF was trading near a well-defined resistance zone where price has faced repeated rejection in the past. This clearly showed that sellers were active at higher levels and the market was struggling to sustain upside momentum.
From this resistance, the market opened with a gap down, which often signals aggressive selling and position unwinding rather than a slow intraday move. The gap was also supported by short-term U.S. dollar weakness, as the market adjusted expectations around risk sentiment and interest rates. When dollar weakness aligns with technical resistance, price usually reacts sharply.
After the gap down, price moved lower toward a major support zone, an area where buyers have previously stepped in. This makes the current zone a key decision point, either buyers defend again, or further downside continuation opens up.
This move is a result of both technical rejection and fundamental pressure, not random price action.
Disclaimer
This analysis is for educational purposes only and does not constitute financial advice. Trading involves risk, and past performance does not guarantee future results. Please manage risk responsibly.

XAUUSD – H2 Technical AnalysisXAUUSD – H2 Technical Outlook: Pullback Builds Value Before the Next Expansion | Lana ✨
Gold continues to trade within a strong bullish structure on the H2 timeframe. The recent rally was clearly impulsive, and the current move looks like a technical pullback to rebalance liquidity, not a trend reversal.
📈 Market Structure & Trend Context
XAUUSD remains bullish, with the higher-high / higher-low structure still intact. Price is also respecting the ascending trendline, which has acted as key dynamic support throughout this uptrend.
The current sequence aligns well with a classic bullish cycle: Impulse → Pullback → Continuation. As long as structural support holds, Lana’s primary bias remains: BUY with the trend, not sell against it.
🔍 Key Technical Zones & Value Areas
Buy POC (Value Zone): 4764 – 4770 This area aligns with a high-volume node (POC/VAH) and the rising trendline, making it a strong value zone for dip-buying opportunities.
Near-term resistance: 4843 A key level that needs to be re-accepted to confirm the next continuation leg.
Psychological reaction zone: 4900 Likely to produce hesitation, profit-taking, or short-term volatility.
Upper expansion targets: 5000 and potentially the 2.618 Fibonacci extension, where higher-timeframe liquidity may be resting.
🎯 Trading Plan (H2 Structure-Based) ✅ Primary Scenario: BUY the Pullback
Buy entry: 👉 4766 – 4770
Lana prefers to engage only if price pulls back into the POC zone and shows bullish confirmation on H1–H2 (trendline hold, clear rebound / rejection of lower prices).
Stop Loss: 👉 4756 – 4758 (Placed ~8–10 points below entry, under the POC zone and below the ascending trendline)
🎯 Take Profit Targets (Scaled Exits)
TP1: 4843 First resistance — scale partial profits and reduce risk.
TP2: 4900 Psychological level — expect possible reactions.
TP3: 5000 Major psychological objective and expansion milestone.
TP4 (extension): 5050 – 5080 Potential 2.618 Fibonacci extension / higher-timeframe liquidity zone.
Lana’s approach is to scale out into targets, then protect the position by managing risk (e.g., moving SL to breakeven once price confirms continuation).
🌍 Macro Context (Brief)
Gold remains supported by its role as a safe-haven and strategic reserve asset amid ongoing geopolitical and financial uncertainty. Recent headlines highlighting the rise in the value of large gold reserves reinforce that institutional demand for gold as a long-term hedge remains active, which supports the medium-term bullish bias.
🧠 Lana’s View
This is a pullback within an uptrend, not a bearish reversal. Lana focuses on buying value, not chasing highs. Stay patient, trade the structure, and let price come into your zone.
✨ Respect the trend, stay disciplined, and let the market come to your levels.

XAUUSD (Gold) – 15M Risk-Reward Based Long SetupGold is currently reacting from a key intraday demand zone after a corrective move within the broader structure. Price has shown rejection from lower levels and is attempting to reclaim structure support.
🔹 Bias: Bullish (Intraday)
🔹 Timeframe: 15 Minutes
🔹 Entry Zone: Demand / Support area
🔹 Stop Loss: Below demand zone (structure invalidation)
🔹 Target: Previous highs / Upper resistance
🔹 RR: Favorable risk-to-reward setup
📌 Confluence Used:
Demand zone support
Previous price reaction area
Structure alignment
Trend channel context
📈 If price holds above the marked support and shows continuation, upside momentum towards the target zone is expected.
⚠️ Invalidation if price closes decisively below the demand zone.
💡 Trade with proper risk management. This is a technical view, not financial advice.

XAUUSD – H2 Technical OutlookXAUUSD – H2 Technical Outlook | Lana ✨
Gold continues to trade within a strong bullish structure, and price action is confirming that the market is still respecting the ascending trend channel on the H2 timeframe.
📈 Market Structure & Trend Context
The overall trend remains bullish, with higher highs and higher lows clearly intact.
Price has successfully flipped the 4445–4450 zone from resistance into support, confirming strong buyer commitment.
The impulsive leg toward the current highs suggests we are still in a continuation phase, not a distribution phase.
🔍 Key Technical Zones & Liquidity
Buy resistance flip: 4445–4450
This zone has already shown clean reactions and acts as a structural base for further upside.
POC Buy zone: 4595–4600
This is a high-volume node where price is likely to rebalance liquidity before the next expansion.
Sellside liquidity sits just below current price, making a shallow pullback into value very possible before continuation.
🎯 Bullish Scenarios
Primary plan: Look for BUY setups on pullbacks into 4595–4600 (POC) with bullish confirmation.
Continuation target: If price accepts above current highs, the next upside objective sits around 4747, where higher-timeframe liquidity is resting.
A clean hold above the trendline keeps the bullish thesis valid.
🧠 Notes
Avoid chasing price at highs; wait for pullbacks into value and liquidity zones.
Trade in alignment with trend + structure, not short-term noise.
Patience is key while the market builds liquidity before the next expansion.
✨ Stay disciplined, trade the structure, and let price come to your zone.

XAUUSD (H1) – Powell Subpoena ImpactXAUUSD (H1) – Powell Subpoena Shock: Gold enters a high-volatility week, trade liquidity zones
News that the US Department of Justice has issued a criminal subpoena involving Fed Chair Jerome Powell is an extremely rare type of headline. When the market’s confidence in the Fed and US policy stability gets questioned, gold and silver can surge fast — but the price action often comes with violent two-way swings: a sharp push to grab liquidity, a hard pullback, then the real direction shows.
That’s why this week I’m not chasing candles. The best approach is to trade reactions at key liquidity / support-resistance zones and let the market come to your levels.
Macro context: why gold is moving differently right now
Pressure on the Fed (and its independence) can reprice expectations for rates, which directly hits USD and US yields.
If the market starts pricing aggressive cuts, gold tends to stay supported. But if yields whip around, gold can whipsaw too — fast.
So instead of predicting the headline outcome, the priority is simple: wait for price to hit clean technical zones.
Technical view (H1): uptrend structure holds, but price is trading in “premium”
The structure still sits inside an ascending channel. After a strong impulsive leg up, price is consolidating near the top — a common setup before another expansion, but also a zone where liquidity grabs are frequent.
Key zones to focus on
Sell zone (premium): 4655 – 4660
Buy zone (value): 4413 – 4417
Mid-range resistance (chop zone): around the 45xx area
Trading scenarios (Liam style: trade the level)
1) Primary plan: BUY the pullback into value
If price retraces into the major value support:
Buy: 4413 – 4417
SL: 4403
TP1: 4500 – 4520
TP2: 4655 – 4660
This is the “clean structure” setup: a reset into value, then continuation with the channel.
2) Short-term scalp: SELL the premium reaction
If price pushes into the major supply/liquidity zone:
Sell (scalp): 4655 – 4660 (only with clear rejection on H1/M15)
SL: 4670
TP: 4580 → 4520
This is a reaction sell — a common “profit-taking” area after headline-driven pumps.
3) Continuation setup: BUY after a confirmed hold above mid resistance
If price breaks and holds above the mid resistance (45xx area):
Look for a pullback after breakout to buy
Targets remain towards 4655–4660, then higher along the channel.
Conclusion
This is a headline-risk week, so the key is no FOMO and no entries in the middle of the range. The two zones that matter most:
Buy value: 4413 – 4417
Sell premium (short-term): 4655 – 4660
Which side are you leaning towards — waiting for the dip into 4415 to buy, or hunting a rejection near 4660 to sell?
👉 If this plan helps, follow LiamTradingFX to get the next XAUUSD updates early.

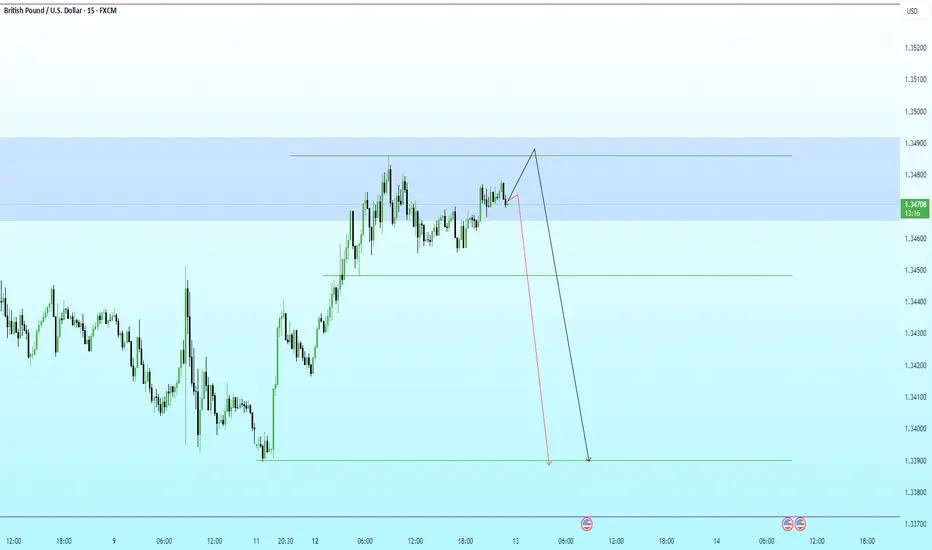
GBPUSD · 15M · SMC OutlookPrice is trading deep into premium, pressing against a well-defined HTF supply zone.
HTF Framework
Clear bullish leg already completed.
Buy-side liquidity resting above recent highs.
Premium zone aligns with prior distribution and weak highs.
LTF Structure
Momentum is slowing near the highs.
Price is consolidating under resistance, hinting at distribution.
Minor pullbacks are being absorbed, classic liquidity buildup behavior.
Expectation
A final push higher to sweep buy-side liquidity.
Reaction from supply after the sweep.
Strong bearish displacement targeting:
Internal range low
Prior demand imbalance
HTF discount zone below
Execution Plan
Avoid longs in premium.
Wait for:
Liquidity sweep above highs
Bearish displacement
LTF MSS for confirmation
Shorts favored post-confirmation.
Partial profits at range low, runners into discount.
The Silent Trap of Overconfidence in Gold Trading!Hello Traders!
There is a trap in Gold trading that doesn’t look dangerous at all. It doesn’t come with panic, fear, or frustration. In fact, it often feels good. Calm. Confident. Almost comfortable. And that’s why it’s so deadly.
That trap is overconfidence.
It usually appears after a few good trades. You start reading Gold better. Entries feel smoother. Drawdowns feel smaller. Somewhere quietly, the market stops being respected and starts being assumed. That’s when Gold prepares its lesson.
How Overconfidence Slowly Enters Gold Trading
Overconfidence doesn’t arrive suddenly. It builds quietly, trade by trade.
A few winning trades make setups feel obvious
You start trusting instinct more than structure
Risk rules feel flexible because “this one looks sure”
Nothing looks wrong on the surface.
But discipline starts loosening, silently.
Why Gold Punishes Confidence So Hard
Gold is not a market that rewards certainty. It thrives on uncertainty, liquidity, and reaction. The moment a trader becomes sure, Gold usually does the opposite.
Entries get taken earlier than planned
Stop losses get tighter or ignored
Position size increases without logic
Gold doesn’t need you to be wrong on direction.
It only needs you to be careless with timing and risk.
The Difference Between Confidence and Overconfidence
Healthy confidence comes from following rules.
Overconfidence comes from recent results.
Confidence respects invalidation
Overconfidence ignores warning signs
Confidence waits for confirmation
Gold can sense when traders stop waiting.
How This Trap Affected My Gold Trading
I’ve experienced this phase myself. After a good run, trades started feeling easy. I trusted my read a little too much. I pushed entries, adjusted stops emotionally, and expected Gold to behave.
Losses came faster than expected
Good setups failed without warning
Emotional frustration returned suddenly
Gold didn’t change.
My discipline did.
Rahul’s Tip
The moment you feel too comfortable trading Gold, reduce size and slow down. Comfort is not mastery. In Gold, discomfort keeps you alert, and alert traders survive longer.
Final Thought
Gold doesn’t trap traders with fear alone.
It traps them with confidence.
When you feel unstoppable, pause.
When trades feel easy, question them.
The market respects humility far more than belief.
If this post reflects a phase you’ve experienced in Gold trading, drop a like or share your thoughts in the comments.
More real lessons coming.

XAUUSD (H1) – Following the bullish channelpatience before continuation ✨
Market structure
Gold remains in a well-defined ascending channel on the H1 timeframe. Despite recent intraday pullbacks, the overall structure is still bullish with higher highs and higher lows preserved. Current price action shows consolidation inside the channel rather than any sign of trend reversal.
Technical outlook (Lana’s view)
Price is rotating around the midline of the rising channel, indicating healthy digestion after the previous impulsive leg.
The recent pullback appears to be a controlled correction, likely aimed at collecting buy-side liquidity before the next expansion.
Market is still respecting structure and trendline support — no breakdown confirmed so far.
Key levels to watch
Buy-side focus
FVG Buy zone: 4434 – 4437
A clean reaction here could offer a good continuation entry within the trend.
Major buy zone: 4400 – 4404
This is the stronger demand area aligned with channel support and previous structure.
Sell-side reaction (short-term only)
4512 – 4515
This zone aligns with Fibonacci extension and channel resistance, where short-term profit-taking or reactions may appear.
Scenario outlook
As long as price holds above the lower channel boundary, bullish continuation remains the primary scenario.
A pullback into FVG or the lower buy zone followed by confirmation would favor another push toward channel highs and liquidity above.
Only a clean break and acceptance below 4400 would force a reassessment of the bullish bias.
Lana’s trading mindset 💛
No chasing price near resistance.
Let price come back into value zones inside the channel.
Trade reactions, not predictions.
Trend is your friend — until structure says otherwise.
This analysis reflects a personal technical perspective for educational purposes only. Always manage risk carefully.

XAUUSD H3 – Liquidity Dominates Near ATHGold is trading in a sensitive zone just below all-time highs, where liquidity, Fibonacci extensions, and trend structure are converging. Price action suggests a controlled rotation rather than a clean breakout, with clear reaction levels on both sides.
TECHNICAL STRUCTURE
Gold remains in a broader bullish structure, with higher lows supported by an ascending trendline.
The recent impulse confirmed bullish intent, but price is now stalling near premium liquidity, signaling potential short-term distribution.
Market behavior shows buy-the-dip dynamics, while upside extensions are being tested selectively.
KEY LEVELS FROM THE CHART
Upper liquidity / extension zone:
Fibonacci 2.618 extension near the top band
This area represents profit-taking and sell-side liquidity, especially if price reaches it with weak momentum.
Sell reaction zone:
4412 – 4415 (Fibonacci 1.618 + prior ATH reaction)
A classic area for short-term rejection if price fails to break and hold above.
Buy-side focus:
4480
This level acts as a buy-on-pullback zone, aligned with trendline support and prior bullish structure.
Expected flow:
Price holds above 4480 → attempts to push toward ATH → potential extension into the 2.618 zone.
Failure to hold 4480 → rotation back toward lower structure for liquidity rebalance.
MARKET BEHAVIOR & LIQUIDITY LOGIC
Current structure favors reaction-based trading, not chasing breakouts.
Liquidity above ATH is attractive, but the market may need multiple attempts or a deeper pullback before a sustained breakout.
As long as higher lows are respected, pullbacks remain corrective.
MACRO CONTEXT – DXY BACK ABOVE 99
The US Dollar Index (DXY) has climbed above 99 for the first time since December 10, gaining 0.14% on the day.
A firmer USD can slow gold’s upside momentum in the short term.
However, gold’s ability to hold structure despite a stronger dollar highlights underlying demand and strong positioning.
This divergence suggests gold is not purely trading off USD weakness, but also off liquidity, positioning, and risk hedging flows.
SUMMARY VIEW
Gold remains structurally bullish on H3
Short-term price action is driven by liquidity near ATH
4480 is the key level defining bullish continuation
Upside extensions may require consolidation or pullbacks before a clean break
In this environment, patience and level-based execution matter more than directional bias.

Why Gold Loves Trapping Both Buyers and Sellers!Hello Traders!
If you have traded Gold for some time, you’ve probably felt this frustration more than once. You take a clean buy, price stops you out and reverses. You flip to sell, and the same thing happens again. It starts feeling personal, like Gold is hunting you specifically.
The truth is, Gold doesn’t hate buyers or sellers.
Gold loves liquidity, and liquidity comes from trapped traders on both sides.
This is not manipulation in the emotional sense. This is how a highly liquid, institution-driven market functions.
Why Gold Rarely Moves in a Straight Line
Gold is one of the most actively traded instruments in the world. Because of this, it cannot afford to move cleanly for long. Straight moves don’t provide enough participation.
Clean trends attract late buyers at the worst possible prices
Obvious breakdowns invite emotional sellers too early
Both sides place stops at similar, predictable levels
Before Gold commits to direction, it usually clears both sides first.
How Buyers Get Trapped in Gold
Buy side traps often appear after a strong bullish candle or breakout. The structure looks convincing, momentum feels strong, and buyers feel safe.
Price breaks a visible resistance and attracts breakout buyers
Stops get placed just below the breakout level
Gold pulls back sharply to test liquidity below
Buyers aren’t wrong on direction.
They’re early, and early entries are expensive in Gold.
How Sellers Fall Into the Same Trap
Sell-side traps usually form after a sharp rejection or false breakdown. Fear builds quickly, and sellers assume the move is done.
Price dips below support and invites aggressive shorts
Stops cluster just above the rejected level
Gold spikes upward to clear those stops
Again, direction is not the issue.
Timing is.
Why Gold Needs Both Traps
Gold doesn’t choose a side until enough liquidity is collected. Buyers provide one side of liquidity. Sellers provide the other.
Trapped buyers fuel downside liquidity
Trapped sellers fuel upside liquidity
Only after both sides react does structure become clean
This is why Gold feels chaotic to emotional traders and logical to patient ones.
How This Changed My View on Gold
Once I understood that traps are part of the process, not mistakes, my trading became calmer.
I stopped reacting to the first breakout
I waited for both sides to show their hand
I focused more on reactions than predictions
Gold didn’t change.
My expectations did.
Rahul’s Tip
If Gold traps you once, learn from it.
If it traps you repeatedly, it’s not the market, it’s impatience. The real opportunity usually appears after frustration peaks on both sides.
Buyers get trapped.
Sellers get trapped.
Patient traders get paid.
If this post matches your Gold trading experience, drop a like or share your thoughts in the comments.
More real, experience-based lessons coming.

XAUUSD (H1) – Inverse Head & Shoulders confirmed, caution POC.Market overview
Spot gold has pushed above $4,470/oz, extending its strong performance after setting multiple record highs throughout 2025. The broader bullish backdrop remains intact, supported by trade-war concerns, ongoing geopolitical instability, and accommodative monetary policy across major economies. Strong and persistent buying from central banks continues to underpin gold’s long-term outlook into 2026.
Technical view – Inverse Head & Shoulders
On the H1 chart, gold has clearly formed an Inverse Head & Shoulders structure:
Left shoulder: Formed after the initial sharp sell-off
Head: A deeper liquidity sweep with strong rejection
Right shoulder: Higher low, showing sellers losing momentum
Neckline / POC zone: Around the 4460–4470 area, where price is currently reacting
The breakout above the neckline confirms bullish intent. However, price is now trading around a POC (Point of Control), which is often prone to psychological reactions and choppy price action.
Key levels to watch
Bullish continuation zone
Holding above the neckline keeps the bullish structure valid.
A clean acceptance above the POC opens the door for continuation toward higher liquidity and Fibonacci extension targets.
Pullback & risk zone
Liquidity risk: 4333 – 4349
If the market fails to hold above the neckline, a deeper pullback into this liquidity zone is possible before buyers step back in.
Fundamental context
Gold’s recovery is driven by trade-war fears, geopolitical tensions, and expectations of looser monetary policy globally.
Central bank demand remains a key pillar supporting prices.
In 2026, gold performance will continue to be influenced by USD valuation, overall risk sentiment, and central bank policy decisions.
Lana’s trading approach
No chasing near the POC. Expect reactions and fake moves.
Prefer buying pullbacks rather than entering at highs.
If price holds above the neckline with strong structure, bullish continuation remains the main scenario.
If the neckline fails, wait patiently for liquidity to be taken lower before looking for new buy setups.
This analysis reflects Lana’s personal market view and is for study purposes only. Always manage risk carefully. 💛

Gold Rewards Timing, Not Activity🟡 Gold Rewards Timing, Not Activity ⏳✨
Gold is not a market that rewards constant action.
It rewards waiting, observation, and precise timing.
Many traders believe that trading more means earning more. In Gold, this mindset often leads to overtrading, emotional decisions, and unnecessary losses.
⏱️ 1. Gold Moves in Phases, Not Constant Trends
Gold spends a large amount of time in:
consolidation 🔄
slow accumulation 🧩
controlled ranges 📦
During these phases, price appears “boring,” but the market is actually preparing.
Trading aggressively in these conditions usually means trading noise, not opportunity.
🧠 2. Activity Feeds Emotions, Timing Controls Risk
High activity leads to:
impatience 😤
forced entries 🎯
emotional exits ❌
Good timing, on the other hand, comes from:
understanding context 🧭
waiting for price to show intent 📊
acting only when conditions align ✅
Gold punishes impatience faster than most markets.
🏦 3. Institutions Trade Less, But Trade Better
Large players do not chase every candle.
They wait for:
liquidity to build 💧
weak hands to exit 🧹
price to reach meaningful zones 📍
When timing is right, Gold often moves fast and decisively — leaving overactive traders behind.
⚡ 4. Big Gold Moves Come After Quiet Periods
Some of the strongest Gold expansions begin after:
low volatility 😴
reduced participation 📉
trader boredom 💤
This is why patience is not passive — it is strategic.
🧩 Key Insight
In Gold, doing less at the right time often outperforms doing more at the wrong time.
🎯 Final Takeaway
❌ More trades ≠ more profits
✅ Better timing = cleaner execution
🟡 Gold rewards discipline, context, and patience
Master timing, and activity will take care of itself.
