LiamTrading – XAUUSD M45 | Fibonacci perspective on the ...LiamTrading – XAUUSD M45 | Fibonacci perspective on the upward wave: watch for sell at 2.618 @ 4229–4231, wait to buy at FVG 4174–4172
Quick context: News of the US government reopening eases tensions, but gold prices in the Asian session this morning only rose slightly before moving sideways – accumulating. On M45, the triangle has broken upwards but buying momentum hasn't truly exploded; the market may test the price gap areas (FVG) before choosing the next direction.
Technical Analysis
Trendline & M45 structure: The rise after breakout is running along the short-term upward trendline; the old triangle peak becomes resistance near 4215.
Fibonacci Extension:
2.272 ≈ 4215: pivot point; staying above this opens the path for higher levels.
2.618 ≈ 4229–4231: extended resistance – a zone prone to rejection/short reversal.
FVG & Liquidity Zones:
FVG #1: 4195–4198 – likely to fill before continuing upwards.
Liquidity: 4184–4188 – volume attraction zone between FVG and trendline.
Fibo 0.618 + FVG: 4172–4174 – strong confluence for the buyback scenario in line with the trend.
Invalidation point: breaking 4166 weakens the M45 upward structure, risking a pullback to lower zones.
Trading Scenarios
Scenario 1 – Trend-following Buy (priority)
Entry: 4172–4174 (Fibo 0.618 + FVG)
SL: 4166
TP: 4190 → 4215 → 4240 → 4280
Note: Prioritise when a clear rejection candle/lower wick appears at 417x.
Scenario 2 – Counter-trend Sell scalp at extended resistance
Entry: 4229–4231 (Fibo 2.618)
SL: 4236 (above the nearest peak)
TP: 4215 → 4196 → 4186 → 4175
Note: Quick scalp; abandon if M45 closes strongly above 4231–4233.
Scenario 3 – Buy on break & hold of 4215 (break & retest)
Condition: M45 closes above 4215, retests holding 4212–4216
Entry: 4216–4218
SL: 4207
TP: 4229–4231 → 4260 → 4285–4300
Which price zone do you find noteworthy today? Comment below & hit Follow on LiamTrading channel for the latest updates.
Forextrading

XAU/USD OUTLOOK – TODAY 13/11/25
The US House has approved the reopening of the government, now just awaiting President Trump's signature. This means US economic data will gradually be released again, promising a week of strong and unpredictable fluctuations.
In terms of technicals, gold maintains an upward trend after breaking the H4 sideway boundary, but signs of overbought conditions and H4 peak divergence are emerging.
In smaller time frames (M30 – H1), slight divergence is also beginning to appear, so BUY positions need to be selected carefully, avoiding FOMO. SELL should only be short-term reactive trades.
🎯 Scenario for the day
Morning
Expecting sideway ~30 points within the 4180 – 4212 range
You can WATCH FOR TRADES WITHIN THIS RANGE
if the price breaks through 4212, then wait for a retest back to 4205 to buy up.
Afternoon
Wait for gold to adjust to reasonable BUY zones:
4160 – 4162
4152 – 4148
4123 – 4120
If a strong adjustment occurs:
Beautiful BUY at 4070 – 4040 (deep support zone).
🎯 Target increase:
4280 – 4285
4300 – 4305
🎯 Reactive SELL:
4255, 428X, 430X
(SL 10 – TP 10)
⚠️ Important Note
The overall trend is still uptrend, but attention is needed:
H4 shows signs of overbought + peak divergence.
M30 – H1 shows slight divergence, indicating the market may have a short adjustment before continuing to rise.
BUY should only be entered at beautiful support zones, if a bad candle is seen → close short and exit quickly.
SELL is only reactive selling at strong resistance zones, not holding for long.

XAUUSD – REFERENCE SCENARIO FOR 13/11 – TRACKING ELLIOTT WAVE 5💛 XAUUSD – REFERENCE SCENARIO FOR 13/11 – TRACKING ELLIOTT WAVE 5 🎯
🌤 Overview
Hello everyone 💬
Gold is currently trading around the 4210 region, indicating that the upward momentum has slowed after two strong days of gains.
According to Elliott wave, wave 5 may not have ended yet, and this region is becoming a strong resistance – where prices can accumulate or adjust at any moment.
Besides technical factors, political news from the US President's administration is causing significant USD fluctuations, leading to a wide range of gold movements in the short term. Therefore, today it is crucial to prioritise risk management and monitor price reactions in the 4210–4260 region.
💹 Technical Analysis
📈 On the H4 chart, gold is approaching the resistance area of 4210–4260, which also coincides with the 0.236 Fibonacci and the previous FVG zone.
🟣 The bearish view (ABC correction) will be confirmed when the price breaks below 4180 – targeting an adjustment to 4120–4050.
🔹 The bullish view remains valid if the price closes the H4 candle above 4212, in which case the trend could extend to 4250–4280.
🎯 Reference Trading Plan
💖 BUY Scenario (on breakout)
Entry: 4230–4232 | SL: 4225
TP: 4165 – 4190 – 4250
💢 SELL Scenario (reaction at resistance)
Entry: 4265–4267 | SL: 4273
TP: 4249 – 4215 – 4200
⚠️ Important Note
Closely monitor reactions at the levels: 4246 – 4212 – 4260 – 4280.
USD is highly volatile due to political factors, which may cause rapid fluctuations in gold.
🌷 Gold is at a crucial transition zone – Elliott wave 5 may soon end or expand further 💛
Be patient for clear confirmation, as at this stage, even a small deviation can change the entire price structure.
If you find this useful, please 💛 like – 💬 comment – 🔔 follow LanaM2 to keep updated with daily gold insights with me ✨

LiamTrading – XAUUSD H2 | USD strengthens again, gold ...LiamTrading – XAUUSD H2 | USD strengthens again, gold consolidates in an upward channel; await correction to 4090/4041 – break 4145 to confirm further rise
Quick context: USD recovery causes gold to move sideways during the Asian session. Price is moving within an upward channel, hitting the upper trendline and reacting around 4100, not forming a lower low yet. To confirm the continuation of the uptrend, a break of 4145 is needed; otherwise, prioritise the technical correction scenario towards liquidity zones.
Technical Analysis (Volume Profile • Trendline • S/R • Fibonacci)
Channel & Trendline: Channel top coincides with 4135–4145 → likely to see profit-taking pressure. Holding the lower edge of the channel ~4085–4090 keeps the upward structure valid.
Liquidity & FVG:
Liquidity 4090: price pull/volume attraction zone before choosing direction.
Fibonacci Retracement + old resistance ~4041–4043: strong confluence for a bounce if deep correction occurs.
Main resistance: 4130–4135 (retest of channel top), 4145 (pivot confirming rise), 4200 (sell scalp area if clear rejection appears).
Main support: 4084–4086 (channel edge/liq), 4041–4043 (Fib + S/R), deeper 4020 is a defensive point for buyers.
Trading Scenarios (optimised for mobile reading)
Scenario 1 – Buy shallow pullback (trend-following priority)
Entry: 4084–4086
SL: 4078
TP: 4098 → 4112 → 4135 → 4160
Suggestion: Wait for rejection candle at 4090 or M15 reversal signal before entry.
Scenario 2 – Buy deep (Fib + S/R)
Entry: 4041–4043
SL: 4036
TP: 4056 → 4072 → 4095 → 4120
Suggestion: Prioritise when price fills the gap and leaves a clear lower wick.
Scenario 3 – Sell scalp at resistance (counter-trend)
Entry: 4130–4132
SL: 4138
TP: 4112 → 4100 → 4088 → 4060
Note: Quick scalp only; abandon if H1/H2 closes strongly above 4145.
Bonus – Sell scalp 4200
Condition: Clear rejection on smaller timeframe.
SL: above the nearest recent high.
Reference TP: 4185 → 4166 → 4145.
Risk Management & Invalidation
Short-term bullish bias remains valid if price holds above 4085–4090.
H2 closes above 4145 → prioritise buying on breakout, limit all sell orders.
H2 closes below 4036 → risk of deeper test around 4020.
Risk per trade 0.5–1%, move SL to breakeven at +1R, do not average against the trend.
Which price zone do you find noteworthy today? Comment below & hit Follow on LiamTrading channel for the earliest updates.

XAUUSD – PRIORITISE BUYING WHEN PRICE ADJUSTS💛 XAUUSD – PRIORITISE BUYING WHEN PRICE ADJUSTS 🎯
🌤Overview
Good morning traders 💬
Gold is experiencing a slight adjustment after encountering resistance at the VAH zone on the Volume Profile. This is a natural reaction in the current uptrend.
The price observation zone for today's adjustment is around the H4 trendline at 4078, deeper is the VAH zone 4020, where there is good liquidity for buyers.
Although there might be a short-term adjustment, the main trend remains upward. Therefore, I prioritise waiting to Buy at the support zone, rather than entering a trade against the trend.
💹 Technical Analysis (ICT Perspective)
📈 The price is maintaining a medium-term upward structure, with no reversal signals yet.
🟣 The 4075–4078 zone coincides with the trendline + liquidity zone – a potential buying area for short trades.
🔹 VAH around 4020 is strong support, suitable for long-term Buy if the price adjusts deeply.
💫 The 4200–4203 zone remains a major resistance (Sell Zone) – expect a downward reaction when the price approaches.
🎯 Reference Trading Plan
💖 Buy scalping (short-term)
Entry: 4075–4078 | SL: 4070
TP: 4095 – 4105
💖 Buy zone (main priority)
Entry: 4018–4021 | SL: 4011
TP: 4035 – 4042 – 4075 – 4095
💢 Sell zone (short reaction)
Entry: 4200–4203 | SL: 4210
TP: 4186 – 4165 – 4140
💢 Sell scalping (short-term)
Entry: 4122–4124 | SL: 4130
TP: 4105 – 4086 – 4060 – 4040
⚠️ Important Note
The 4048 zone is strong resistance – closely observe price reactions here.
Prioritise Buy according to the main trend, Sell should only be considered as a short-term reaction.
🌷Be patient and wait for the price to adjust to the support zone to buy according to Smart Money flow.
If you find this useful, please 💛 like – 💬 comment – 🔔 follow LanaM2 for daily gold insights ✨

LiamTrading – XAUUSD H2 | A corrective phase might occur todayLiamTrading – XAUUSD H2 | A corrective phase might occur today
Follow Liquidity 4090, FVG 4053–4069 & VAH ~4025
Quick glance: Gold remains in an uptrend but shows signs of stalling at the upper boundary of the rising channel. With the USD potentially volatile as the US nears “reopening”, a technical correction towards liquidity zones is a scenario to prepare for.
Technical Analysis
Trendline/Price Channel: Price is moving within an ascending channel; the channel top around 4130–4140 is prone to profit-taking/stalling.
Liquidity: 4085–4092 – a price pull/volume attraction point before choosing the next direction.
FVG #1: 4053–4069 – a price gap likely to fill and rebound.
VAH (Volume Profile): 4023–4028 – volume value peak; strong confluence support during deep corrections.
POC: ~3985–3990 – a magnetic level if the market weakens more than expected.
Resistance: 4135–4140 (near channel top + short-term offer), further 4166 (Fibo/channel top extension).
Fibonacci: The latest upward wave shows the expansion area around 4135–4166 as a “liquidity pocket” – suitable for scalp sell upon clear rejection; retracement levels 0.382–0.5 converge around 406x–402x, matching FVG & VAH → priority buy point if price corrects.
Trading Scenarios
Buy shallow pullback (trend-following)
Entry: 4083–4085
SL: 4077
TP: 4098 → 4112 → 4140 → 4166
Note: Require rejection/wick at Liquidity 4090; move SL to breakeven at +1R.
Buy deep at VAH/Volume Profile
Entry: 4025–4028
SL: 4020
TP: 4040 → 4065 → 4100 → 4112
Note: Prioritize when FVG 4053–4069 fills and rebounds; exercise caution with volume.
Sell scalp at channel resistance (counter-trend)
Entry: 4135–4140
SL: 4148
TP: 4122 → 4105 → 4090
Note: Only a scalp trade; abandon if H1/H2 closes strongly above 4140.
H1/H2 closes below 4077 → risk of testing 4053–4069; breaking further 4020 might drag to POC ~3990.
Each trade risks 0.5–1%, do not average against the trend; adhere to Dow (enter only when support/resistance is confirmed broken on entry timeframe).
Which level are you watching for gold today? Comment below & hit Follow on LiamTrading channel for the fastest updates.

XAUUSD – PRIORITISE BUYING ON TUESDAY💛 XAUUSD – PRIORITISE BUYING ON TUESDAY 🎯
🌤 Overview
Hello everyone 💬
Gold continues its upward momentum in the first two days of the week, supported by the cash distribution policy for low-income individuals and the reopening moves by the US government under President Trump.
These factors are putting downward pressure on the USD, helping gold prices maintain a short-term upward trend.
💹 Technical Analysis
🟣 Currently, the price is touching the VAH area according to the Volume Profile and showing a slight reaction – however, the support trendline around 4110–4113 remains an ideal buying zone to continue following the trend.
🔹 The 4200–4203 area (Fibonacci Extension 2.618) coincides with the strong resistance of H4, likely to see a short adjustment reaction before continuing to extend to the 43xx area.
🎯 Trading Plan Reference
💖 BUY Scenario (priority trend-following)
Entry: 4110–4113 | SL: 4106
TP: 4132 – 4150 – 4175 – 4200 – 4250
💢 SELL Scenario (short-term reaction)
Entry: 4200–4203 | SL: 4207
TP: 4188 – 4165 – 4148
⚠️ Important Notes
Prioritise buying according to the main upward trend, especially when the price reacts at the H4 trendline.
Sell orders are only for short-term reactions, and profits should be secured early when the first TP is reached.
USD volatility remains a key factor to closely monitor this week.
🌷 Conclusion
The upward trend of gold is still maintained 💛
Be patient and wait for the price to react at the 4110–4113 area to buy according to the trend, and take advantage of pullbacks at resistance to manage orders effectively.
If you find this useful, don't forget to 💛 like – 💬 comment – 🔔 follow LanaM2 for daily gold insights ✨

XAUUSD – PRICE STRUCTURE UPDATE: MAINTAINING THE TRADING ...💛 XAUUSD – PRICE STRUCTURE UPDATE: MAINTAINING THE TRADING SCENARIO 🎯
🌤 Overview
Hello everyone 💬
The price structure of gold is still on track as per the previous scenario — those who have bought according to the prior plan might have already profited and should continue to hold their ground.
The price in the Asian session at the start of the week has risen steadily, breaking through the 4021 zone, confirming a short-term uptrend and aiming to retest the upper edge of the H4 price channel.
This is a positive signal before the market might enter a deeper correction in the mid-week sessions.
In terms of news, the latest statement from US President Trump indicates that the government shutdown might soon end — this is a factor that could cause significant USD volatility, thereby having a short-term impact on gold prices.
💹 Technical Analysis
📈 On the H4 frame, the price remains within the medium-term upward channel, maintaining the structure of “higher lows”.
🟣 Breaking the 4021 zone confirms that upward momentum is prevailing, and the Sell Zone Liquidity 4090–4100 continues to be the short-term target for testing.
🔹 After hitting this zone, a correction is expected towards the 3920 – 3785 zone (Buy Zone Fibonacci) – where buyers might return strongly.
💫 The current price signal is entirely in line with the previous technical scenario, with no need to change the trading plan.
🎯 Reference Trading Plan
💢 SHORT scenario (short-term)
Entry: 4098–4102 | SL: 4112
TP: 4078 – 4025 – 3998 – 3920 – 3875 – 3785
💖 LONG scenario (long-term strategy)
Entry: 3785–3789 | SL: 3777
TP: 3810 – 3865 – 3925 – 3988
🌷 Conclusion
Gold prices are moving exactly as predicted in the structure 💛
Be patient, maintain discipline, and stick to the key price zones – this is the time when perseverance will yield the greatest advantage.

LiamTrading – XAUUSD | Early Week Bullish Scenario...LiamTrading – XAUUSD | Early Week Bullish Scenario: Successful Box Breakout, Watch for Retest at 4056 & Deep Buy at 3998–4000
The price has just broken out of the accumulation box and accelerated as per the weekend scenario. Bullish inclination for the day, with a near-term target of 4080 → 4110; the 4110–4112 zone is a suitable psychological resistance for scalping. Prioritise buying at the 4056 retest or deep buying at 3998–4000 when the price sweeps liquidity and then rebounds.
The US Senate takes further procedural steps to end the shutdown. Expectation of systemic risk cooling → pressure on USD decreases, supporting gold in the short term.
The process still has a few steps, fluctuations around news hours might be volatile → adhere to technicals, manage risks tightly.
Technical Analysis (H1/H2) – Volume Profile • Trendline • S/R • Fibonacci
Structure & Trendline: Box breakout upwards, trend-following capital dominates. Short-term uptrend when the price holds above 4056 (retest point of breakout zone).
Support/Resistance (S/R):
Support: 4056 (retest), 4025–4038 (FVG liquidity fill), 3998–4000 (Buy Zone Liquidity).
Resistance: 4110–4112 (psychological + short-term supply cluster), 4160–4165 (Fibo extension).
Fibonacci Extension:
1.618 coincides with 4110–4112 → likely reaction/scalp sell.
2.272 targets ~4160 → extended target/final profit exit.
Today's Trading Scenario
Continuation Buy (priority)
Entry: 4056–4060 (retest of breakout zone)
SL: 4048
TP: 4080 → 4110 → 4160
Management: Move SL to breakeven at +1R; partial close at 4080/4110.
Deep Liquidity Buy (cautious volume)
Entry: 3998–4000
SL: 3992
TP: 4020 → 4045 → 4080 → 4110
Note: Enter only with clear rejection candle (long lower wick, M1–M15 reversal) or after FVG fill and rebound.
Scalp Sell at Psychological Resistance (counter-trend)
Entry: 4110–4112
SL: 4118
TP: 4100 → 4080 → 4065
Note: Abandon trade if H1 closes strongly above 4112 or if the uptrend is too strong (breakout with volume).
Invalidation & Notes
Short-term bullish bias invalidated if H1 closes below 4048 → may test deeper at 4025–4038 or 3998–4000.
Avoid entering trades close to news hours about the US government reopening process.
Risk per trade: 0.5–1%, adhere to discipline of moving SL at +1R.
If you find this useful, comment on the price levels you're watching and hit Follow on LiamTrading to receive daily updates.

LiamTrading – XAUUSD D1 | Scenario for Week 2 of NovemberLiamTrading – XAUUSD D1 | Scenario for Week 2 of November
Accumulation range 4047–3928, prioritise buying on breakout – watch for short at 4200 (FVG + Fib 0.382)
Overview: After the correction from the historical peak, gold is forming a bottom – accumulating in the price box 4047–3928. The D1 structure still leans towards a medium-term uptrend if the price holds above 3928; the ~4200 area coincides with a broad FVG + Fib 0.382, a “liquidity pool” prone to strong reactions.
Macro Summary
Hedging flows against public debt/deficit risks and net buying demand from some central banks/Asian bloc support the long-term trend.
Expectations of a cooling interest rate path in 2026 help ease pressure on gold, but pullbacks may still occur before major technical milestones.
Technical Analysis (D1 Frame – Trendline | S/R | Volume zone | Fibonacci)
Accumulation Range: 4047 (top of the box) ↔️ 3928 (bottom of the box). D1 closing above 4047 confirms an upper range expansion; breaking 3928 triggers a deeper decline to lower Fib levels.
Fibonacci of the most recent up wave:
The price is oscillating around 0.618 → tendency to form a base.
Deeper area if the base breaks: 0.5 ~ 3850 and 0.382 ~ 3710.
Key resistance: 4090–4120 (mid-box area), ~4200 (FVG + Fib 0.382) – expected large liquidity/short-term reversal zone.
Important support: 3990–4010 (psychological/trading cushion), 3928 (lower range – breakout mark).
Trendline: The medium-term uptrend line remains intact if corrections do not close below 3928.
Trading Scenario for the New Week
Scenario 1 – Buy with the trend on upper range breakout
Condition: D1 closes above 4047, retest holds firm at 4038–4047.
Entry: 4048–4055
SL: 4018
TP: 4090 → 4120 → 4185–4205 (FVG + Fib 0.382)
Management: Take partial profit at 4090/4120, move SL to breakeven at +1R.
Scenario 1b – Buy at the box bottom (fade range)
Entry: 3935–3945 (when there is a rejection candle/clear buying tail at 3928–3945)
SL: 3895
TP: 3995–4010 → 4040–4047
Note: If D1 closes below 3928, cancel the plan and switch bias to a bearish scenario.
Scenario 2 – Short reaction at the 4200 liquidity zone
Entry: 4185–4205 (FVG + Fib 0.382) when clear rejection appears on D1/H4
SL: 4225
TP: 4120 → 4047 → 4010 (extended target: 3850 if there is a breakdown signal)
Note: Counter-trend order; reduce volume, exit quickly if D1 closes above 4205.
Risk & Invalidation
The medium-term bullish bias remains valid as long as D1 does not close below 3928.
D1 closing below 3928 opens the path to 3850 (Fib 0.5), even 3710 (Fib 0.382).
Strong news (CPI, employment, central bank speeches) can disrupt signals; wait for candle closure according to the chosen frame.
Summary
Gold is “spring-loaded” within 4047–3928. Priority plan: Buy on breakout–hold 4047 to aim for 4090–4120 and test ~4200; simultaneously watch for short reaction at 4200. If 3928 breaks, switch scenario to decline towards 3850 → 3710.

XAUUSD – H4 PERSPECTIVE: WAIT FOR LIQUIDITY TEST BEFORE DEEP...💛 XAUUSD – H4 PERSPECTIVE: WAIT FOR LIQUIDITY TEST BEFORE DEEP DECLINE 🎯
🌤 1. Overview
Hello everyone 💬
Gold just ended the week with a candle closing at the 4001 region, after a slight rise and then holding steady in the upward channel on the H4 frame.
The current sideways movement is making it difficult for many traders to find short-term entry points.
However, the 4090 area still has an unfilled liquidity gap (FVG), which coincides with the upper edge of the price channel. This could be the next short-term destination before the market adjusts for a deeper decline.
From my perspective, gold might rise another leg to sweep the liquidity in the upper region, then adjust back to the 3785 area – an important Fibonacci Retracement zone, where a strong reaction from buyers is highly likely.
💹 2. Technical Analysis
📈 The price structure is still maintaining an upward trend within the H4 price channel, with each subsequent low being higher than the previous one.
🟣 The 4090–4102 area is a liquidity region yet to be swept, located at the channel's peak – a high probability of a downward reaction.
🔹 The potential Buy zone around 3785–3789 coincides with Fibonacci 0.618 and a strong historical support area.
💫 Main scenario: Price might test the upper liquidity region, then adjust down to the Buy Zone before forming a larger upward momentum.
🎯 3. Reference Trading Plan
💢 SELL scenario (short-term)
Entry: 4098–4102 | SL: 4112
TP: 4078 – 4025 – 3998 – 3920 – 3875 – 3785
💖 BUY scenario (long-term strategy)
Entry: 3785–3789 | SL: 3777
TP: 3810 – 3865 – 3925 – 3988
⚠️ 4. Important Notes
Prioritize short-term Sell if there is a strong reaction at the 4090–4100 region.
Long-term Buy only if the price adjusts deeply to the 3785–3790 region.
Limit emotional trading – this is a liquidity accumulation phase before major volatility.
🌷 5. Conclusion & Interaction with LanaM2
Gold is following the accumulation path before forming a major wave 💛
Be patient and observe reactions at the two critical regions 4090 and 3785, as these could be the pivot points for the coming week.

The Psychology Behind Winning TradesThe Psychology Behind Winning Trades 🧠💹✨
Introduction – Hook:
📊 “Why do some traders consistently win 💰 while others struggle 💔?”
It’s rarely the strategy—it’s the mindset behind the trade! 🧠🌟
Your emotions, thoughts, and biases control your decisions, even with perfect technical skills. 🎯
1️⃣ What is Trading Psychology?
Trading psychology is the study of how emotions and mental habits affect trading decisions. 🌈🧘♂️
It’s about understanding:
How fear 😨, greed 😍, or impatience ⏳ impacts your trades
Why you sometimes ignore your rules 📝
How discipline 💪 can make the difference between profit 🏆 and loss 💸
💡 Tip: Even the best strategies fail if your mind isn’t in control. 🧠✨
2️⃣ Common Psychological Traps & How They Appear in Trades
Trap Emoji Effect Example in Trading
Fear 😨 Exiting too early Closing a winning trade because you’re scared of losing profits 💔
Greed 😍 Holding losing trades Waiting for a loss to “come back” and losing more money 💸
FOMO 🏃♂️💨 Jumping impulsively Entering trades last minute because everyone else is trading 🚀
Revenge Trading 😤🔥 Emotional loss-chasing Trying to recover losses by taking bigger, risky trades 💣
💡 Insight: Recognizing these emotions is the first step to controlling them. 🌟
3️⃣ How to Master Your Trading Mind
1️⃣ Pre-Trade Preparation 🧘♀️✅
Check your emotional state before trading 🕊️
Confirm your trade plan is clear 📋✨
2️⃣ During the Trade ✋🎯
Stick to your rules, don’t let emotions take over 💪🔥
Avoid impulsive exits or entries ⏱️❌
3️⃣ Post-Trade Reflection 📖🖊️
Keep a Trading Journal: note emotions, mistakes & wins ✨📓
Review trades to improve your mindset over time 📈🌟
4️⃣ Pro Tips for Winning Psychology
🔥 Mindset Checklist:
Am I trading calmly? 😌💭
Am I following my plan? 📋✅
Am I chasing losses or profits emotionally? ⚖️💡
💡 Daily Mindset Practice: Meditation 🧘♂️, journaling ✍️, or reviewing trades 📊 can help you stay disciplined under pressure 💎🌟
5️⃣ Why It Matters
Trading without psychology = strategy leaks money 💸💨
Emotional control = consistency, higher win rates, confidence 🏆💪
Professionals don’t just trade charts—they trade themselves 🧠✨
6️⃣ Engagement Section
👇 Question for your audience:
“What’s the biggest psychological trap YOU’ve faced in trading? Share your story below! 💬💭💖”

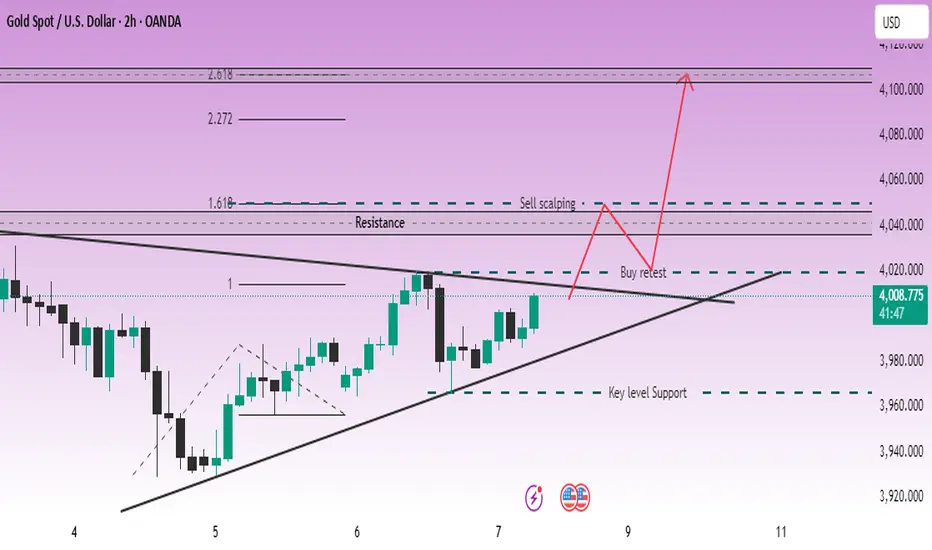
LiamTrading – Gold compressed at the triangle peak; watch for...LiamTrading – Gold compressed at the triangle peak; watch for a break at 4020 (H2)
After a week of accumulation, the price is pressing against the triangle peak between the descending trendline (from late October) and the ascending trendline (from 5/11). The advantage will clearly lean towards an increase if 4020 is broken and held.
Technical Analysis (prioritise H2, Volume Profile – Trendline – S/R – Fibonacci)
Trendline & Structure
The descending trendline is blocking recovery waves; the ascending trendline supports adjustment waves.
Closing the H2 candle above the confluence area ~4020 will confirm a clear upward movement.
Support / Resistance (S/R)
Main support: 3970–3972 (swing low & “Key level Support”).
Decision zone: 4014–4020 (break–retest zone).
Resistance: 4045 (medium-term), 4050 (supply for scalp orders), upper band 4105–4110.
Volume Profile (recent session / composite)
POC magnet: 4015–4017 → likely profit-taking/fluctuations; staying above POC turns this area into a launchpad.
LVN: around 4020 → beautiful break-and-go; failing to hold often pulls back to 4015/4010.
Fibonacci Extension (H2 swing)
1.618 coincides with 4045–4050 → first upward target.
2.272/2.618 creates a liquidity zone 4095–4110 → area may weaken/strong profit-taking.
Today's Trading Scenarios
Scenario 1 – Buy on breakout direction
Entry: 4020–4022 after closing above trendline + retest holding 4018–4020
SL: 4014
TP: 4045 → 4070 → 4100–4110
Management: Partially close at 4045; move SL to breakeven when reaching +1R. Staying above 4020 means POC 4015–4017 should switch roles to support.
Scenario 1b – Buy on adjustment wave (before breakout, cautious volume)
Entry: 3998–4002 (“400x”) when there is an upward reaction at the ascending trendline
SL: 3988
TP: 4017 → 4045
Note: H2 closes below 3988 → cancel the order.
Scenario 2 – Sell scalp at resistance
Entry: 4048–4052 (confluence Fibo 1.618 + supply zone)
SL: 4056
TP: 4040 → 4030 → 4020
Note: This is counter-trend. Ignore if H2 closes strongly above 4052.
Summary
The upward bias is confirmed when breaking–holding 4020, opening targets 4045 → 4070 → 4100+. Before that signal, trade within the range respecting POC 4015–4017 and ceiling 4045/4050. Risk per order 0.5–1%, move SL to BE when reaching +1R.
XAUUSD – AWAITING CONFIRMATION OF UPTREND – TARGET 4050💛 XAUUSD – AWAITING CONFIRMATION OF UPTREND – TARGET 4050 🎯
🌤 1. Overview
Hello everyone 💬
Gold today remains in a phase of indecision – waiting for signals to confirm a new trend.
On the H2 chart, the price has broken the downtrend line and is retesting this line. The structure of “higher lows” indicates that buying pressure is gradually gaining dominance.
The previous peak around 4018 is currently the decisive point for the trend – if the price confirms a breakout above, the upward momentum may extend towards the 4050 area.
Currently, the market is fluctuating within the range of 3964 – 4018, and needs to break out of this zone to determine a clearer direction.
💹 2. ICT Perspective
📈 The price has broken the downtrend line and retested the structure on the H2 chart – an early signal for the potential formation of an uptrend.
🟣 The area 3964–4018 is a short-term liquidity accumulation zone before the price expands.
🔹 OB 4040–4042 coincides with significant resistance, suitable for short sell orders (scalp) if there is a strong reaction.
💫 When the price surpasses 4018, the upward structure will be confirmed and the expansion target may aim towards 4050 – 4077.
🎯 3. Reference Trading Plan
💖 BUY scenario (priority when confirmed)
Entry: above 4018 | SL: 4011
TP: 4025 – 4033 – 4050 – 4077
💢 Short SELL scenario (scalping)
Entry: 4040–4042 | SL: 4046
TP: 4022 – 4015 – 3998
⚠️ 4. Important Notes
Clear confirmation is needed when breaking the 4018 zone before entering a buy order.
If the price continues to fluctuate within the 3964–4018 range, trading should be limited.
Today is Friday, manage risk more tightly, prioritise accuracy in each order.
🌷 5. Conclusion & Interaction with LanaM2
Gold is showing positive signals 💛
Be patient and wait for reactions around the 4018 zone – this could be the start of a new uptrend if clearly confirmed.

LiamTrading – Gold confirms medium-term uptrendLiamTrading – Gold confirms medium-term uptrend
Gold has officially broken the downward trendline, confirming the transition phase to a medium-term uptrend. After a prolonged accumulation phase, the market is beginning to show clear buying power, and the potential for an extended rally is gradually forming.
Macro – Fundamental Analysis
The latest report from the World Gold Council (WGC) shows that central banks continued to increase gold purchases significantly in September, totalling 39 tonnes, the highest level since the beginning of the year.
Most notably, the Central Bank of Brazil – for the first time this year – added 15 tonnes of gold to its national reserves.
Since the beginning of the year, the net purchases by central banks have reached 200 tonnes, clearly reflecting the trend of moving away from the USD amidst global economic and geopolitical instability. This capital flow provides a solid foundation for the medium and long-term uptrend of gold.
Technical Analysis
On the H2 chart, gold prices have broken the downward trendline, signaling a reversal and establishing a new upward structure.
The 3985–3988 zone is acting as dynamic support, potentially serving as a retest point before prices continue to rise.
The POC of the Volume Profile at the 4015–4017 zone is a short-term resistance, where the market may see profit-taking reactions before breaking higher.
The 4046 mark is considered a decisive zone; if surpassed and held, the medium-term uptrend will be strongly reinforced.
Today's Trading Scenarios
Scenario 1 – Buy in line with the uptrend:
Entry: 3986–3988 (may wait for retest confirmation)
SL: 3980
TP: 4020 – 4045 – 4090
Scenario 2 – Short sell at resistance:
Entry: 4015–4017
SL: 4023
TP: 4002 – 3986
Summary
Gold is giving clear signals of establishing a medium-term uptrend, supported by buying flows from central banks. Traders should prioritise buying positions at strategic support zones and observe price reactions around the POC to confirm the next direction.

XAUUSD – INTRADAY BULLISH SCENARIO – TARGET 4050💛 XAUUSD – INTRADAY BULLISH SCENARIO – TARGET 4050 🎯
🌤 1. Overview
Hello everyone 💬
Although the larger timeframe for gold still leans towards a bearish trend, today in the short term, I prioritise a bullish scenario.
On the M30 timeframe, the price structure is gradually increasing, indicating that short-term capital is shifting to the buying side.
Zone 3990 is a very important area – where a Break of Structure (BOS) has just appeared and is also a strong resistance that has reacted multiple times before.
Price needs to confirm breaking this zone to continue expanding the bullish trend.
💹 2. Technical Analysis (ICT Perspective)
📈 An ascending structure (BOS) has formed on M30.
🟣 Buy Zone 3977–3979 coincides with the support trendline – a beautiful confluence point for buyers.
🔹 Resistance zone 3990–4000 is the area to confirm the main direction.
💫 Higher target: Fibonacci Extension 1.618 around 4049–4050, coinciding with the psychological resistance 4050.
🎯 3. Trading Plan Reference
💖 MAIN BUY (priority)
Entry: 3977–3979 | SL: 3970
TP: 3988 – 4000 – 4022 – 4040 – 4050
💢 SHORT SELL (when price reacts strongly at resistance)
Entry: 4012–4014 | SL: 4020
TP: 4002 – 3988 – 3965
⚠️ 4. Important Notes
Price needs to confirm through zone 3990 to reinforce the bullish trend.
If it breaks below 3970, the ascending structure is temporarily invalidated.
Today, prioritise buying according to the capital flow, sell only when there is a clear signal at the resistance zone.
🌷 5. Conclusion & Interaction with LanaM2
Gold is showing positive signals 💛
Patiently wait for reactions at the Buy Zone 3977–3979, this could be the starting point for a new upward move towards 4050.
This is not investment advice, just a personal perspective according to the ICT method.
If you find it useful, please 💛 like – 💬 comment – 🔔 follow LanaM2 to update gold analysis with me every day ✨

AUD/NZD Nearing Peak: Expect Controlled PullbackAUD/NZD has completed a clean 5-wave impulsive move to the upside, finishing Wave (1)/(A) near the recent peak. From here, the price looks ready to start a deeper correction in the form of Wave (2)/(B), which may pull back toward the lower support zone inside the rising channel. This corrective move could unfold in multiple legs before turning bullish again. Once Wave (2)/(B) completes, the chart expects a strong rally into Wave (3)/(C), aiming for new highs. In simple terms: a healthy pullback first, then a powerful upside continuation.
Stay tuned!
@Money_Dictators
Thank you :)

EUR/USD Outlook: Buyers Regain ControlThe EUR/USD market is beginning to show early signs of recovery momentum as sentiment gradually turns constructive. After an extended period of controlled weakness, the pair is attracting renewed interest from institutional participants positioning for a potential upward rotation in the coming sessions.
Market tone has shifted from defensive to cautiously optimistic. Liquidity distribution across recent sessions indicates accumulation behavior at lower price zones, often a precursor to a bullish transition. Traders appear to be building exposure in anticipation of improved Euro-area sentiment and potential easing of dollar strength, both of which may provide the foundation for a broader corrective advance.
Price action suggests that selling pressure is losing effectiveness as downside extensions are quickly absorbed. The slowdown in bearish momentum combined with increased buying participation signals a developing phase of re-accumulation, where stronger hands begin to dominate short-term flows.
Confidence is gradually improving, supported by expectations that market equilibrium is tilting back toward Euro favor. While volatility remains moderate, structural patterns imply that the market may be preparing for a sentiment-driven expansion to the upside. The tone of order flow has shifted toward buy-side liquidity, pointing to a constructive environment for continuation of the upward phase once momentum fully confirms.
In summary, EUR/USD appears to be entering the early stage of a bullish rotation characterized by accumulation, strengthening sentiment, and declining downside conviction. The pair is poised for potential medium-term appreciation as market positioning aligns with renewed optimism toward the Euro’s relative outlook.

LiamTrading - $XAUUSD$: Second Scenario – BUY UP Priority ...LiamTrading - OANDA:XAUUSD $: Second Scenario – BUY UP Priority After BREAKING RESISTANCE $4002$
With the Support of the US Treasury Secretary
Hello traders community, LiamTrading is back with detailed OANDA:XAUUSD $ analysis for the start of the week!
The Gold market is receiving strong support from policy: US Treasury Secretary Scott Bessent calls on the Fed to continue cutting interest rates as the PCE inflation is currently at $2.7\%$.
This call, aimed at reducing mortgage rates and supporting the housing market, strengthens the long-term outlook for Gold.
Technical Analysis: We prioritize continuing to buy up following the main trend. The best strategy is to enter orders at strong resistance/support zones to ensure the lowest risk.
📰 MACRO FUNDAMENTALS: CALL FOR RATE CUT
Impact: The Treasury Secretary's statement on cutting interest rates to support the "transitioning" economy increases expectations of policy easing, which is a strong support factor for Gold (although not yet an official decision).
Suitable Strategy: Market sentiment is being driven by expectations of easing policy, reinforcing the priority for a BUY (Long) position.
📊 TECHNICAL ANALYSIS: IMPORTANT PIVOT POINT
Resistance Zone $4002$: This area acts as an important pivot point.
Buy Entry will be triggered after the price breaks resistance $4002$ and retests.
Sell Entry: Look for short-term scalping at the resistance zone $4030$ to secure profits. Highlighted Zone: Prioritize entering orders at confirmed Trendline zones.
🎯 DETAILED TRADING PLAN (ACTION PLAN)
We will wait for Gold to break structure and create a BUY setup.
🟢 Main BUY Scenario (BUY Break & Retest)
Logic: Buy at $4002$ after breaking resistance and retesting, leveraging new upward momentum.
Entry (BUY): $4002$
SL: $3995$ (tight SL)
TP1/TP2: $4020$ | $4035$
TP3: $4070$
🔴 SELL Scalping Scenario
Logic: Short-term scalping at the strong resistance zone $4030$ (near Sell Liquidity zone).
Entry (SELL): $4030$
SL: $4038$
TP1/TP2: $4015$ | $4004$
TP3: $3990$
📌 SUMMARY & DISCIPLINE (Liam's Note)
Our BUY strategy is reinforced by policy outlook and technical break at $4002$. Strictly adhere to SL $3995$ to manage risk before the upward structure is confirmed.
Are you ready for Gold's movement at $4002$? Please LIKE and COMMENT!

LiamTrading - $XAUUSD$: NEW WEEK TRADING SCENARIO...LiamTrading - OANDA:XAUUSD $: NEW WEEK TRADING SCENARIO – PRIORITISE SELLING After BREAKING THE TRENDLINE
Hello traders community,
The new week opens with a clear strategy: Prioritise SELLING after Gold has broken the previous upward trendline.
Although fundamental economic news (like interest rate policies and politics) supports Gold potentially reaching the $5,000$ USD mark, we must trade according to the current Price Action. The technical selling pressure is strong. We will SELL at key resistance zones and continue SELLING as the price breaks the downward structure.
📰 FUNDAMENTALS & LONG-TERM OUTLOOK
$5,000$ Prospect: Fundamental and political factors continue to support the scenario of Gold reaching $5,000$ USD in the long term (due to geopolitical risks and potential loss of Fed independence).
Short Term 🔴: Gold is under technical selling pressure after breaking through the $4,000$ USD mark.
📊 TECHNICAL ANALYSIS: TRENDLINE BREAK
Structure: Gold has exited the upward price channel and is retesting the broken trendline.
Priority: SELL at the retest resistance zone $4024$.
🎯 DETAILED TRADING PLAN (ACTION PLAN)
🔴 SELL Scenario (SELL Primary) - Preemptive Resistance
Entry 1: $4024$ (Sell retest trendline zone)
SL: $4032$
TP1/TP2: $4012$ | $4000$
TP3: $3989$
Entry 2 (Continuation SELL): When price breaks the next trendline at $3992$
SL: $4000$
TP: $3940$
🟢 BUY Scenario (BUY Reversal) - Buy at Strong Support
Logic: Only buy when price hits strong liquidity support, potential for a short-term rebound.
Entry (BUY): Around $3960$ (Buy Scalping Zone)
SL: $3954$
TP1/TP2: $3972$ | $3988 FWB:TP3 : $4000$
📌 SUMMARY & DISCIPLINE (Liam's Note) Don't let the $5,000$ USD prospect affect short-term risk management. Trade according to Price Action. Adhere to SL and prioritise SELL positions at resistance zones.
Are you ready for the SELL strategy at the start of this week?

LiamTrading - XAUUSD: Outlook $5,000 USD and Priority BUY... LiamTrading - XAUUSD: Outlook $5,000 USD and Priority BUY Strategy at POC $3973
Hello traders community,
Gold is positioned between an extremely optimistic long-term outlook (forecast $5,000 USD in the next 12-18 months by Bank of America) and short-term technical adjustments.
Although Gold has broken the upward trendline, a sustainable downward trend has not been confirmed.
BUY positions are still prioritised!
🔥 LONG-TERM CONTEXT & INFLATION
Long-Term Push: Gold prices adjusted for inflation have DOUBLED in the past 4 years.
Highlight: Gold reinforces its role as an anti-inflation asset as real prices soar to all-time highs.
📊 DETAILED TRADING PLAN (ACTION PLAN)
Strategy: Buy at POC Zone to leverage liquidity advantage.
🟢 BUY Scenario (BUY Primary) - Buy at High Value Zone
Logic: The $3973 - 3975$ zone is right above the Buy POC (highest value zone).
Entry (BUY): $3973 - 3975$
SL: $3968$
TP1: $3988$ | TP2: $4000
Buy Up Target 2: Buy when price retests the trendline around $4002$.
🔴 SELL Scenario (SELL Scalping) - Preemptive strike at resistance zone
Entry (SELL): $4032 - 4034$
SL: $4040$
TP1: $4022$ | TP2: $4015
📌 SUMMARY & DISCIPLINE (Liam's Note)With the $5,000 USD forecast and inflation factors, the risk of SELL is increasing.
Focus on BUY at POC $3973$ and absolute SL.
Trade responsibly and with discipline!

GOLD DIVE—Sniping the $405x Dip Before FOMC!Welcome Traders! Gold (XAU/USD) is correcting sharply, dropping 1.10% towards $4,065. This weakness is driven by trade optimism, but the underlying Fed rate cut expectation keeps our BUY ON DIPS strategy highly profitable!
🧠 MARKET PSYCHOLOGY (MIND)
Bears' Power: Trade optimism is pushing safe-haven assets down. Sellers are targeting the recent uptrend structure.
Bulls' Anchor: Weak US inflation data means a Fed rate cut is almost certain (25 bps expected). This long-term USD weakness acts as a floor for Gold.
Action Bias: BUY THE DIP at critical Fibo supports, anticipating the Fed decision to fuel the next rally.
📊 KEY LEVELS & ACTION ZONES (H1)
We are using the Fibo retracement from the recent high to define our optimal entry points.
🎯 SELL TARGET / CEILING: $4,164.938 (Zone 416x). This is the immediate resistance and the ultimate target for the Long trade.
🔥 HIGH-CONVICTION BUY ZONE: $4,048.493 (Fibo 0.5 Zone 405x). The optimal entry to maximize risk/reward.
Strategy: Wait for a clean tag and H1/M30 reversal signal here.
⚡️ SCALP BUY REACT ZONE: $4,077.605 (Zone 407x). A quick bounce area for aggressive buyers.
❌ INVALIDATION: SL must be placed safely below the 0.618 Fibo level of the 405x zone.
📈 TRADING PLAN SUMMARY (DIP BUY)
Entry Focus: Prioritize the $4,048.493 (405x) Fibo Zone for a high-quality Long entry.
SL Placement: Strict SL below the 0.618 Fibo of the 405x zone.
TP Target: Aim for the recent high at $4,164.938 (416x).
💬 TRADER'S QUESTION
The drop is here! Are you buying the aggressive 407x level or patiently waiting for the optimal 405x Fibo zone before the expected Fed cut rally?

Gold Awaits FOMC Breakout While Holding Key Liquidity BaseMarket Overview:
Gold remains trapped in a tight range as traders weigh optimism from US–China trade progress against cautious expectations for the upcoming FOMC meeting.
The macro picture feels balanced: risk sentiment improves, yet the weaker USD and lingering Fed cut expectations quietly support the metal.
In essence, gold isn’t trending — it’s coiling.
Liquidity is being built, not lost.
Every test of 4,050–4,060 shows strong absorption, while short-term sellers are still defending the 4,186–4,260 region.
The market is waiting for a trigger,
and the FOMC might be the one that decides which side breaks first.
Technical Structure (H1)
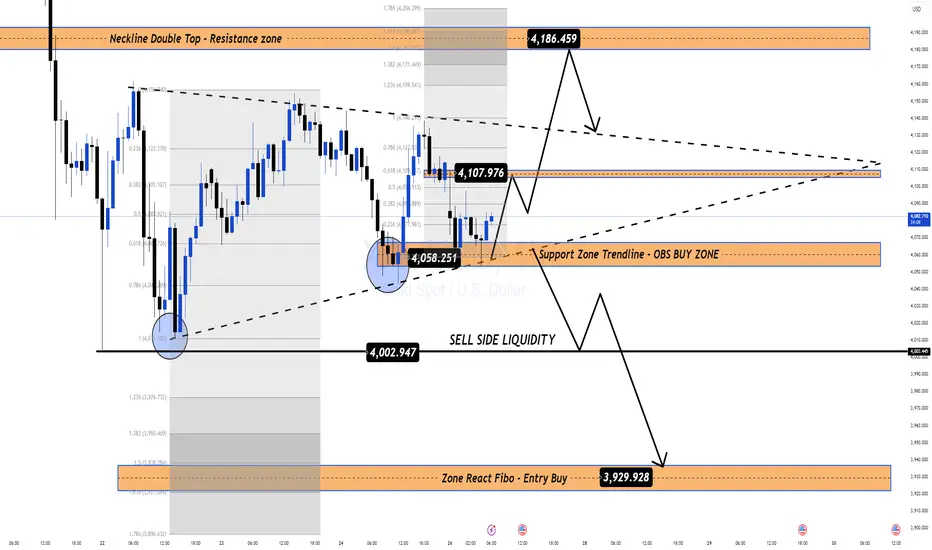
Price continues to respect the ascending support trendline from 4,003 and the neckline resistance near 4,107.
This structure has the DNA of a compression model — narrowing volatility, thinning liquidity, preparing for expansion.
If the support at 4,050 holds, a retest of 4,107 → 4,186 remains likely before the next decision point.
Conversely, a liquidity sweep under 4,002 could form the last dip before a bigger rally unfolds.
Key Structural Levels:
Support / Accumulation Zone: 4,058 – 4,050
Mid-Level Pivot / Neckline: 4,107
Upper Supply Zone: 4,186 – 4,260
Deep Liquidity Pool: 4,002 – 3,930
MMFLOW Perspective:
For now, gold is accumulating energy — this is not a breakout market, it’s a build-up market.
Price action above 4,050 still favours the bulls, but conviction will only return once we see a clean break beyond 4,186.
Ahead of FOMC, patience is strategy.
The next wave won’t come from guessing policy —
it’ll come from reading the flow once volatility hits.
Summary:
Gold’s structure remains stable — liquidity is concentrated below 4,050, and compression continues within the 4,060–4,186 band.
Bias stays neutral-to-bullish as long as the liquidity base holds.
📊 What’s your take?
Will the FOMC spark the breakout, or is gold just reloading for the next wave?
👉 Follow MMFLOW TRADING for institutional flow analysis and smart money structure updates.