USD/JPY Bullish Reversal Setup – Long Entry at 141.964 Targeting ahemdsaeed25: USD/JPY Long Setup – Eyeing 150.537 Target"
"Potential Bullish Reversal on USD/JPY"
"Swing Trade Alert: USD/JPY Long from 141.964"
"USD/JPY Breakout Play – Buy Zone Identified"
Let me know your tone preference (technical, casual, professional, etc.) and I can tailor the title further.
ahemdsaeed25: This chart is for the USD/JPY (U.S. Dollar / Japanese Yen) pair on the 1-hour timeframe, and it's displaying a bullish setup with a clear trade idea. Here's a breakdown of the analysis:
Key Components:
Current Price: Around 142.574.
Entry Point: 141.964
Stop Loss: 140.547
Take Profit / Target Point: 150.537
Reward-to-Risk Ratio: Favorable (approximately 5.94% upside, large potential move).
Indicators:
EMA 50 (Red Line): 142.798 — acting as near-term dynamic resistance.
EMA 200 (Blue Line): 144.699 — major resistance and a trend filter (downward trend visible).
Zone Analysis:
Support Zone (Purple Box near 141.964 - 140.547): This is the accumulation/buy zone.
Foryourpage

Gold (XAUUSD) Trade Setup: Bullish Breakout Toward $3,637 TargeCurrent Price: $3,309.18
EMA 30 (Red Line): $3,265.00
EMA 200 (Blue Line): $3,163.35
Trend Direction: Strong uptrend (price above both EMAs)
Timeframe: 1-hour (short-term analysis)
📍 Key Levels
Entry Point: Around $3,266.63 (just above EMA 30)
Stop Loss: Around $3,265.00
Target (EA Target Point): $3,637.23
Potential Profit: +$365.01 or +11.16%
🔍 Technical Patterns & Zones
Rising Channel: Price is moving within a rising wedge or channel, indicating bullish momentum but with narrowing range — a potential reversal signal if broken.
Support Zone: Highlighted purple box around the entry point; likely a demand zone.
Resistance Zone: $3,637.23 area marked as the EA Target Point — previous resistance or Fibonacci extension level.
✅ Bullish Signals
Price is consistently making higher highs and higher lows.
EMAs are aligned in a bullish formation (short EMA above long EMA).
Clear breakout above consolidation range recently.
Trade setup shows favorable risk-to-reward ratio.
⚠️ Risks / Caution
Rising wedge can sometimes break down — watch for volume drop or divergence.
Potential pullback to the entry zone is expected (indicated by the arrow).
News Events: Symbols below the chart indicate upcoming USD economic data, which could bring volatility.
📈 Strategy Summary
Buy on pullback to $3,266.63 with tight stop at $3,265.00.
Target: $3,637.23 — potential 11% gain.
Risk: Minimal if stop is respected, tight stop-loss.

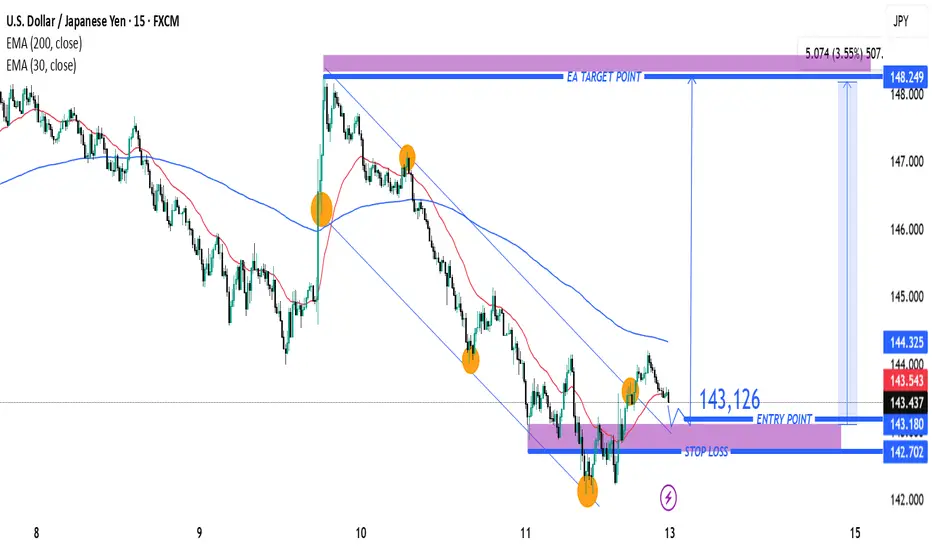
USD/JPY Bullish Breakout Setup – Entry, Stop Loss & Target AnalyPair: USD/JPY
Timeframe: 15 minutes
Indicators Used:
EMA (30-period) – Red line
EMA (200-period) – Blue line
Chart Features:
Downward channel (declining trendline)
Identified entry point, stop loss, and target
Key support/resistance zones shaded in purple
🟢 Trade Idea Summary:
🔹Entry Point: 143.126
🔹Stop Loss: 142.702
🔹Target (Take Profit): 148.249
🔹Risk/Reward Ratio: ~1:5 (Excellent R/R)
🔍 Technical Analysis:
✅ Bullish Breakout Signal
Price has broken above the descending channel and has retested the breakout area (highlighted purple zone) – a classic bullish breakout structure.
The breakout retest near 143.126 is acting as support, with potential to launch a new bullish move.
📈 Moving Average Analysis
EMA 30 is starting to flatten and curve up – indicating potential shift in momentum.
EMA 200 is still above price, but a breakout above it could strengthen the bullish case.
🔁 Support and Resistance
Strong support zone around 143.000 – 143.200 area (highlighted zone).
Major resistance and target zone is between 148.000 – 148.250.
🔔 Trade Plan Suggestion:
Go Long at or near 143.126
Place Stop Loss below support at 142.702
Target 148.249 for profit
Reasoning:
This setup offers a trend reversal potential from a downtrend to uptrend, with a clean breakout-retest-confirmation pattern. The wide take profit range gives room for extended upside as momentum builds.
⚠️ Watch For:
Reaction to the 144.325 (EMA 200) level
Increased buying volume to confirm breakout
Any re-entry into the channel (would invalidate setup)
BTC/USD Short Setup – Triple Top Reversal with EMA Confirmation Entry Point (Sell): Around $85,699.52
Stop Loss: $86,741.44 (above resistance zone)
Target (Take Profit): $82,982.09
This provides a Risk-Reward Ratio of approximately 1:2, a commonly acceptable ratio in trading.
📈 Indicators:
EMA 30 (Red) is currently above the EMA 200 (Blue), indicating bullish momentum—but this setup anticipates a trend reversal.
If price breaks below the EMAs, that would confirm bearish strength.
🧠 Conclusion:
This setup is based on:
A strong resistance zone,
Bearish reversal pattern (triple top),
Risk management via stop loss and take profit levels.
If you're trading this:
Wait for confirmation with a bearish candlestick below the EMAs or a break of recent support.
Manage position size based on stop distance and your account risk tolerance.

Silver (XAG/USD) Bullish Trade Setup: Entry, Target & Stop-Loss Entry Point: ~32.35619
Take Profit (Target Point): 33.31252
Stop Loss: 31.87803
EMA 200 (Blue): 31.65932 – indicating long-term trend support.
EMA 30 (Red): 32.28304 – indicating short-term trend.
Current Price: 32.38220
The price is above both EMAs, which is typically bullish.
---
Analysis
1. Bullish Bias:
Price has broken and is holding above the entry zone.
Both EMAs are aligned in a bullish configuration (short-term EMA above long-term EMA).
The market structure shows higher lows and sideways consolidation, suggesting potential for a breakout.
2. Risk-Reward Ratio:
Risk (Entry to Stop Loss)

EUR/JPY Short Setup – Bearish Reversal Targeting 161.134 with TiEMA 30 (red): Currently at 162.470
EMA 200 (blue): Currently at 162.071
Trade Setup:
Entry Point: Around 162.978
Stop Loss: Slightly above 163.016 (highlighted in purple zone)
Target (Take Profit): 161.134 (labeled as “EA TARGET POINT”)
Analysis:
Trend: The pair has been trending upwards recently, as shown by the price staying above the 200 EMA.
Current Price: 162.604, just below the proposed entry.
Risk/Reward:
Risk: ~3.8 pips (entry to stop loss)
Reward: ~184.4 pips (entry to target)
This implies a favora

ETH/USD Bearish Reversal Setup – Targeting $1,470 After ResistanPair: Ethereum / U.S. Dollar (ETH/USD)
Exchange: Coinbase
Timeframe: 15 minutes
Indicators:
EMA 30 (red line): ~1635.82
EMA 200 (blue line): ~1585.79
🟣 Key Levels & Zones
Resistance Zone (Purple Rectangle Top): Around $1,647 – previously tested and rejected.
Support Zone (Purple Rectangle Bottom): Around $1,470 – marked as the "EATARGET POINT".
Current Price: ~$1,645
📉 Bearish Breakdown Setup
Chart Pattern: There’s a potential double top or distribution zone forming near the resistance.
Projection: The price is expected to break below the smaller support zone and drop to the target zone around $1,470.67, representing an 11.13% drop.
Measured Move Tool: Indicates a bearish price target if the price breaks down from the current consolidation.
✅ Confluence
Price is currently hovering under resistance.
EMAs show short-term bullish momentum but could flatten if breakdown confirms.
Support near $1,635 is being tested – a break below could trigger the expected drop.
⚠️ Trading Implications
Short Setup: A trader might look to enter short around $1,647 if breakdown confirmation occurs.
Stop Loss: Just above the resistance zone (~$1,650+).
Take Profit: Near $1,470 zone.

GOLD (XAUUSD) 15-Min Chart – Bearish Reversal Setup with Key EntPrice: $3,232.02 (at time of chart)
Trend: Price is consolidating near a resistance area after an upward move, with potential for a reversal.
🔍 Key Technical Levels
📈 Entry Point: $3,241.88
(Marked for a potential short entry)
🔻 EA Target Point (Take Profit): $3,187.70
This is the target for the short position; aligns with a strong previous demand zone and near the 200 EMA.
⛔ Stop Loss Zone: Above $3,243.48
Purple zone indicates the invalidation area for the short trade.
📉 Resistance Point: $3,229.87
(Red line, also the 30 EMA) – Important level where price is currently hovering.
🔵 Confirm Target Points: $3,223.04 & $3,218.25
Zones to watch for confirmation of downward momentum.
📘 EMA (30): $3,229.87
Acts as short-term dynamic resistance.
📘 EMA (200): $3,182.40
Acts as major support and long-term trend indicator. Also very close to the target area.
💡 Trade Idea Summary
Strategy: Short (Sell) from the resistance/entry point around $3,241.88.
Target: $3,187.70
Stop Loss: Above $3,243.48
Risk-Reward Ratio: Solid (approx. 1:2+ based on visual range)
🔎 Additional Notes
Price is testing resistance after forming a potential double top or lower high.
A breakdown below $3,223 could confirm bearish continuation.
Watch for confirmation candles on 15m or 1h before entering

GBP/USD Short Setup – Rejection from Resistance Zone with High REMA 30 (red line)
EMA 200 (blue line)
---
Key Levels:
Entry Point: 1.31324
Stop Loss: 1.32303
Target (TP): 1.28102
---
Analysis:
1. Trend Context:
The market shows a recent bullish move approaching a key resistance zone (highlighted in purple).
The price is now reacting to that resistance zone and potentially forming a reversal.
2. EMA Insight:
Price is currently trading slightly above the EMA 200 and EMA 30, indicating short-term bullish momentum.
However, the suggested trade setup appears to be short (sell), anticipating a reversal from

BTC/USD) breakout up trand analysis Read The ChaptianMr SMC Trading point update
bullish analysis of Bitcoin (BTC/USD) on the 4-hour timeframe, showing a potential breakout and rally scenario. breakdown:
---
1. Market Structure:
Downtrend Channel: Price has been moving within a falling channel.
Double Bottom Pattern: Marked by two green arrows — a bullish reversal signal.
Breakout Attempt: Price is testing the upper trendline and 200 EMA (~$83,952), suggesting possible breakout.
---
2. Key Zones:
FVG (Fair Value Gap): Around $78,678 — a demand zone where price could retest before moving higher.
Breakout Confirmation Zone: ~$85,130 — breaking above this with volume signals strength.
Target Point: $95,206 — an upside target projecting ~31.77% gain from the breakout.
---
3. Indicators:
200 EMA: Currently acting as resistance. Break above it confirms bullish momentum.
RSI: Around 60 — pointing upward with bullish divergence from recent lows, showing increasing buying pressure.
---
4. Scenarios:
Scenario 1 (Bullish Continuation):
Breaks above trendline and 200 EMA.
Retest (optional) and then heads toward $95,206 target.
Scenario 2 (Retest First):
Price dips into the FVG/demand zone.
Finds support and launches upwards, confirming a strong base.
Mr SMC Trading point
---
Summary of the Idea:
This is a buy setup on breakout or on pullback:
Aggressive Entry: Break and close above $85,130.
Safe Entry: Pullback into $78,678 area (FVG).
Target: $95,206
Risk Zone: Below $78,000 (invalidates bullish structure).
Pales support boost 🚀 analysis follow)

EUR /USD) resistance level rejected support level Read The ChaptSMC Trading point update
analysis of the EUR/USD currency pair on a 1-hour timeframe, and it presents a potential bearish setup. Here's a breakdown of the idea:
Key Elements:
Resistance Zone (around 1.14182):
The price is currently approaching a marked resistance area. The analysis suggests this could be a turning point where price may reverse.
Projected Movement (Black Arrows):
The chart predicts a double top formation or a rejection from the resistance level, followed by a strong move downward.
Target Point:
The drop is expected to reach the key support zone around 1.10942, aligning with a previous structure and a potential liquidity zone.
EMA 200 (around 1.10389):
Price remains well above the 200 EMA, suggesting the trend is still bullish overall, but the setup targets a potential correction or short-term reversal.
RSI Indicator (~60):
RSI is above 60 but not overbought yet. This supports the idea that there's room for one more push up into resistance before a drop.
Mr SMC Trading point
Summary of the Idea:
1. Watch for price reaction around 1.14182.
2. If there's a clear rejection or double top, a short position may be considered.
3. Target area is around 1.10942.
4. The setup assumes a corrective move in a broader bullish trend.
plase support boost 🚀 analysis follow)

GBP/JPY) Bearish analysis Read The ChaptianSMC Trading point update
GBP/JPY 2-hour chart outlines a clear bearish setup within a well-defined downtrend. Here's a breakdown of the trading idea:
---
Technical Overview:
Downtrend Channel:
The pair is respecting a downward-sloping channel, with repeated rejections at the upper boundary, confirming bearish control.
Resistance Zone (~187.8 - 188.5):
Price has reached a highlighted resistance area that aligns with previous swing highs and trendline resistance — marked with red arrows for prior rejections.
Bearish Projection:
The analysis anticipates a rejection from this resistance zone followed by a downward impulse move. A pullback is expected, but continuation toward the target support zone around 179.150 is likely.
Target Zone (~179.150):
This level lines up with previous price action and matches the measured move (blue vertical box), adding confluence.
EMA 200 (around 190.36):
Price is well below the 200 EMA, reinforcing the bearish structure and trend bias.
RSI Indicator (~52):
RSI is slightly above 50 but not bullish — this neutral reading suggests the pair has room to drop if resistance holds.
Mr SMC Trading point
---
Trading Idea Summary:
Bias: Bearish
Entry Zone: 187.8 – 188.5 (resistance)
Confirmation: Bearish candlestick pattern or rejection signal
Target: 179.150
Invalidation: Break and close above 190.365 (above EMA 200 and prior highs)
---
plase support boost 🚀 analysis follow)

GBP/USD Bearish Reversal Setup – Targeting 1.27451 (April 2025)"GBP/USD Sell Setup – Bearish Reversal Opportunity
⚙️ Trade Setup Summary
Entry Point (Sell Zone): Around 1.31668
Stop Loss: 1.32638
Take Profit (EA Target Point): 1.27451
Risk-Reward Ratio (R:R):
Risk: 1.32638 – 1.31668 = ~97 pips
Reward: 1.31668 – 1.27451 = ~422 pips
R:R ≈ 1:4.35 – very favorable
📊 Technical Analysis
Supply Zone (Resistance):
The purple zone near 1.31668–1.32638 is likely a key supply area where price previously reversed.
A small rejection wick is already forming near the entry, suggesting potential exhaustion.
Bearish Setup Expectation:
Anticipated reversal at resistance.
The plan likely involves waiting for a bearish confirmation (e.g., pin bar, engulfing candle) in the zone before shorting.
Moving Averages:
Price is above both the red (short-term) and blue (longer-term) moving averages, indicating current bullish momentum.
However, the trade anticipates a trend reversal or deeper retracement.
Target Zone:
The EA Target Point at 1.27451 is positioned at a prior demand/support zone — a logical level for take-profit.
🧠 Trade Thesis
This is a counter-trend trade aiming to catch a reversal from a resistance zone.
Strong confluence from price action and resistance makes this setup compelling, if proper confirmation appears.
⚠️ Risk Considerations
Bullish momentum is still strong, so aggressive entry without confirmation can be risky.
Monitor closely for rejection signs or bearish divergence before entry.
SL above 1.32638 provides safety buffer against stop hunts or spikes.
✅ Potential Title Suggestions
"GBP/USD Bearish Setup – Reversal from Resistance Targeting 1.2745"
"GBP/USD Short Trade Plan – Sell at 1.31668, Target 1.27451"
"GBP/USD Sell Opportunity – High R:R Bearish Setup

EUR/USD Long Opportunity – Entry at Support ZoneEntry Zone (Buy Area): Between 1.12729 and 1.13101
Stop Loss: 1.12100
Target (TP1): 1.16950
Risk-Reward Ratio (R:R):
Risk: 1.13101 - 1.12100 = 101 pips
Reward: 1.16950 - 1.13101 = ~385 pips
R:R ≈ 1:3.8 — excellent risk-to-reward
📈 Technical Observations
Bullish Momentum: Strong bullish candles leading into the setup suggest buyers are currently in control.
Support Zone (Entry Area):
The purple zone has acted as a previous resistance, now turned support.
Price may retest this zone before moving higher (as indicated by the blue path on the chart).
Moving Averages:
Red (likely 50 EMA) and blue (possibly 200 EMA) are showing a bullish crossover.
Price is above both MAs, reinforcing a bullish trend.
Projected Move:
The setup anticipates a pullback before a continuation to the upside toward 1.16950.
🧠 Trade Idea Summary
This is a buy-the-dip strategy within a bullish trend.
Entering on the pullback allows for:
Tighter stop loss
Better entry price
Higher R:R ratio
⚠️ Risk Considerations
A break below 1.12100 would invalidate the setup.
Monitor for bearish reversal patterns or news around the EUR/USD that might shift sentiment.

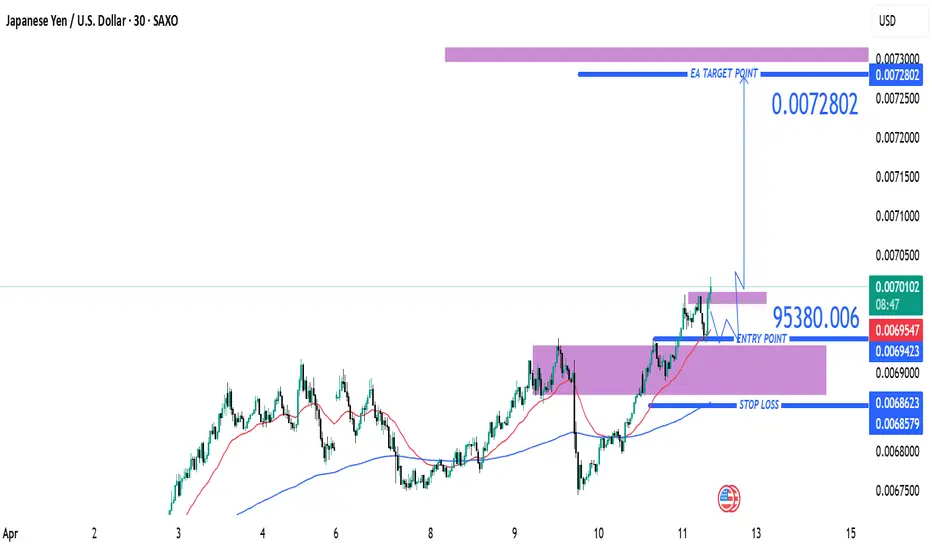
JPY/USD Bullish Breakout – Targeting 0.0072802 After Retest (AprEntry Point: ~0.0069539
Take Profit (TP): 0.0072802
Stop Loss (SL): 0.0068579
Risk/Reward Ratio:
Risk: ~0.000096
Reward: ~0.000326
Approx. R/R = 1:3.4 → Excellent reward-to-risk
🧠 Strategy Insight
Trade Type: Long (Buy)
This is a bullish continuation setup aiming for higher highs after a breakout from a consolidation range.
Price Action:
Strong bullish trend visible since early April.
Price consolidated in a purple zone (likely a demand/support zone), then broke out and is now retesting that zone — classic breakout and retest pattern.
Indicators:
Two moving averages (likely 50 EMA in red and 200 EMA in blue) are in bullish alignment:
Price is above both EMAs.
50 EMA is above the 200 EMA, confirming bullish momentum.
Support & Resistance Zones:
Entry near previous resistance turned support — solid structure for long positioning.
TP zone near prior highs, possibly based on historical resistance (purple shaded zone above).
SL placed below the most recent demand zone and 200 EMA — a conservative and safe stop.
🔁 Trade Scenarios
✅ Bullish Outcome (Preferred):
Price respects the retest zone and pushes toward 0.0072802.
Strong momentum or fundamental catalysts could support the breakout continuation.
❌ Bearish Risk:
Price dips below the entry and breaks the demand zone and EMAs.
SL at ~0.0068579 helps manage this risk effectively.
🧩 Summary
This is a well-structured trend continuation long setup with textbook breakout-retest logic. The high R/R makes it an attractive opportunity assuming bullish conditions persist.
📌 Suggested Title
"JPY/USD Long Trade Setup – Breakout Retest Toward 0.0072802 (April 11, 2025)"
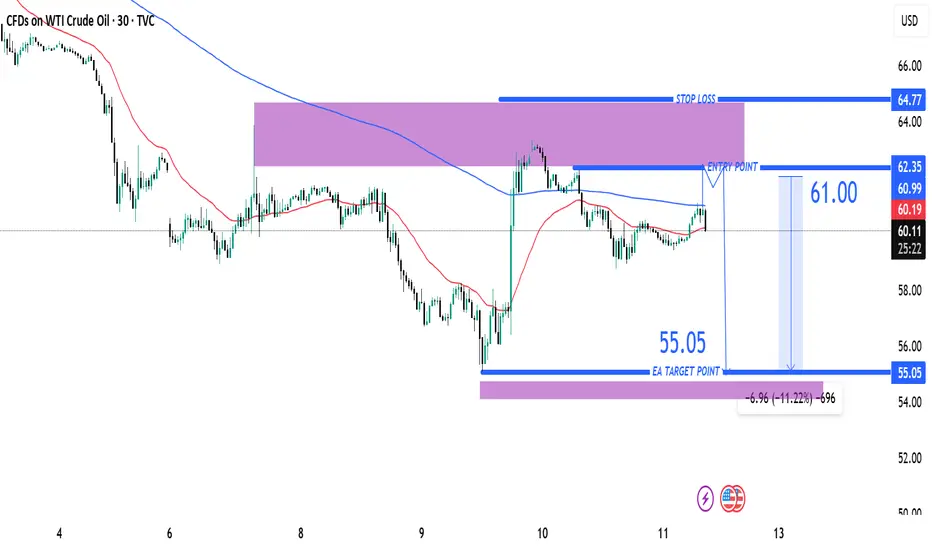
USOIL Short Trade Idea – Targeting $55.05 from $61.00Entry Point: ~61.00 USD
Stop Loss (SL): 64.77 USD
Target (TP): 55.05 USD
Risk/Reward Ratio: Favorable
Risk: ~3.77 USD
Reward: ~5.95 USD
Approximate R/R ratio: 1:1.58
🧠 Strategy Insight
Trend Context:
Prior to the entry zone, price shows a strong downtrend.
The price retraced upward into a resistance zone (highlighted in purple).
The setup suggests a short position anticipating rejection from this zone.
Indicators:
Moving Averages (red & blue):
Likely 50 EMA and 200 EMA showing bearish alignment (price mostly under both).
Resistance Zone:
The purple shaded region represents a supply zone, where price previously reversed.
Entry Zone Analysis:
Entry just below a recent rejection candle.
It's a conservative spot to catch a move back in the direction of the dominant trend.
Target Zone (55.05):
Likely based on a recent support level or demand zone from earlier price action.
Matches previous lows.
🔁 Possible Scenarios
✅ Bearish Scenario (Ideal Outcome):
Price gets rejected from the resistance zone and continues the downtrend toward the target at 55.05.
❌ Bullish Scenario (Risk):
Price breaks above 61.00 and continues toward 64.77, invalidating the short setup.
Bitcoin (BTC/USD) Long Trade Setup –with Target 88,573,60Current Price: $80,724.28
Entry Point: $80,671.23 (just above current price)
Stop Loss: $78,052.44
Target Point: $88,573.60
Resistance Point: $82,260.90
📈 Trend & Moving Averages
EMA 30 (red): $80,220.87 — Short-term trend.
EMA 200 (blue): $80,788.61 — Long-term trend.
The price is currently between the EMAs, indicating potential indecision or a shift in trend. A break above both EMAs with momentum would confirm bullish strength.
🔑 Trade Setup Summary
Element Level
Entry 80,671.23
Stop Loss 78,052.44
Target (TP) 88,573.60
Resistance 82,260.90
Risk-Reward ~1:2.7 (approx)
📊 Analysis & Expectations
Bullish Bias: The chart suggests a long trade with a breakout strategy.
Volume and momentum confirmation will be key above resistance.
Resistance at 82,260.90 may cause a brief pullback before continuation to the target.
The stop loss is well-placed below a support zone and the most recent swing low.
✅ What to Watch For
Break and close above EMA 200 and resistance at 82.2K.
Bullish volume increase on breakout.
Price action around the entry zone (wait for confirmation candle if unsure).

"EUR/USD Bullish Breakout & Retest Setup – Targeting 1.10955Instrument: EUR/USD
Timeframe: 30-Minute
Indicators Used:
EMA 30 (Red): 1.09821
EMA 200 (Blue): 1.09698
Key Levels Identified:
Entry Point: 1.09695
Stop Loss: Around 1.09067
Resistance Zone: ~1.09911
Target Zone: ~1.10918 to 1.10955
Projected Gain: ~147.3 pips (1.35%)
Price Action Analysis:
Bullish Breakout:
The price broke out from a consolidation zone (marked in purple).
A bullish trend is forming as price moves above the 200 EMA.
EMAs Alignment:
The 30 EMA is currently above the 200 EMA, indicating a potential bullish trend continuation.
However, price is slightly below the 30 EMA now, suggesting some short-term pullback or resistance.
Retest at Entry Zone:
Price retested the entry zone at 1.09695 after the breakout and is now hovering near it.
This retest is healthy for confirming support before another move up.
Trade Setup Insight:
Entry Strategy: A long (buy) entry at or around 1.09695.
Stop Loss Placement: Below the previous support zone near 1.09067 to manage risk.
Target Strategy: Aiming for the resistance zone around 1.10918–1.10955 for profit booking.
Conclusion:
This looks like a bullish continuation setup with a favorable risk-reward ratio. The confluence of:
EMA support,
Price structure (breakout & retest),
and defined resistance/target zone

EUR/JPY Bullish Reversal Setup – Entry, Stop Loss & Target StratEMA (30) - Red Line (160.596): Short-term trend.
EMA (200) - Blue Line (161.267): Long-term trend, currently above the 30 EMA indicating a bearish macro trend.
2. Entry Zone:
Marked in purple between 159.751 and 160.161, suggesting a buy (long) opportunity if price retests this demand/support zone.
3. Stop Loss:
Set just below the entry zone at 158.907, protecting against deeper bearish momentum.
4. Target Zone:
163.025 is the profit target, with a purple rectangle showing a resistance/supply zone around that level.
5. Price Action:
The price is currently consolidating near the ent

BTC/USD Bullish Breakout Setup – Targeting $85,477 with 5.62% UpThe price has recently surged above both the 30 EMA (red) and 200 EMA (blue), signaling a strong bullish move.
The EMAs are beginning to turn upward, particularly the 30 EMA, suggesting short-term bullish momentum.
Key Levels Identified
Entry Zone (Purple Support Zone):
Around $80,105 – a potential buy zone after a pullback.
Labeled with STOP LOSS, indicating the invalidation level if price drops below this zone.
Target Zone (Purple Resistance Zone):
Around $85,477 – this is the target level, marked as “EA TARGET POINT”.
Offers a potential move of +5.62% or 4,551.83 points.
Price Action
Price broke above a previous resistance (now support) and has pulled back slightly.
The projected move suggests a bullish continuation after a minor pullback and consolidation.
Risk-Reward
Good risk-reward ratio implied with the large gap between the stop loss and target.
Stop loss is tight, just below the purple support zone (~$80,105).
Projection
The blue lines and annotations suggest a bullish play, with an expected upward movement after retesting the support.
✅ Possible Trade Idea
Buy Zone: ~$80,105 (on a confirmed retest)
Stop Loss: Slightly below $80,105
Target: ~$85,477
Expected Move: +5.62%
🔍 Additional Notes
Keep an eye on price behavior around the support zone—confirmation (e.g., bullish candle pattern or rejection wick) strengthens the entry.
The strong move leading to the breakout suggests high momentum, which could mean limited pullback.
News or macro developments could invalidate technicals—be aware of external factors.

EUR/USD Short Setup – Entry at Resistance, Targeting 1.08942"Entry Point: ~1.10456
Resistance Point: ~1.10151
Stop Loss: ~1.10833
Target Point: ~1.08942
Risk/Reward:
Risk: ~37.7 pips
Reward: ~111.4 pips
Approx. R:R = 1:3
Indicators Used:
EMA 30 (red): ~1.09966
EMA 200 (blue): ~1.09607
Price is currently above both EMAs → Generally bullish in the short term, but you seem to be anticipating a reversal from resistance.
Setup Type:
This appears to be a sell setup based on price reaching a key resistance area with rejection signs, possibly a fake-out above resistance before a move down to the target.
⚠️ What to Watch For:
Confirmation Candle: If you're not in the trade yet, look for strong bearish confirmation below resistance to validate the short.
Stop-Loss Placement: It’s placed above the last high in the purple zone – a good defensive move.
EMA Alignment: Since price is above both EMAs, you’re trading against the trend – more aggressive, so extra confirmation is crucial.

EUR/CHF Bullish Reversal Setup – Support Zone Entry with 1:4 RisThe EMA 200 (blue) and EMA 30 (red) are displayed.
Price is below both EMAs, indicating a bearish trend overall.
However, there's a potential reversal or retracement trade being considered.
2. Trade Setup (Long Position):
Entry Point: 0.92750
Stop Loss: 0.92526 (about 22.4 pips below entry)
Target (Take Profit): 0.93643 (about 89.3 pips above entry)
Risk-Reward Ratio (RRR): Approx. 1:4, which is favorable
3. Support & Resistance:
The entry zone is based on a demand/support area where price previously bounced.
The target

Gold (XAUUSD) Reversal Setup: Buy Opportunity from Demand Zone t GOLD (XAUUSD)
Timeframe: 30-minute
Indicators:
EMA 30 (Red): 3,000.22
EMA 200 (Blue): 3,042.92
🔍 Price Action & Zones
Current Price: 2,982.27
Support Zone (Demand Zone): ~2,940.27 (highlighted in purple, labeled as STOP LOSS)
Resistance Zone (Supply Zone): ~3,040.17–3,042.92 (labeled as EA TARGET POINT)
📈 Trade Idea (Based on Drawing)
Strategy: Buy from demand zone, targeting supply zone
Entry: Near 2,940.27
Stop Loss: Slightly below 2,940.27
Target: ~3,040.17
Risk to Reward: ~1:2.6 (visually)
📊 EMA Dynamics
Bearish Bias in the Medium Term: Price is trading below the 200 EMA, indicating an overall bearish trend.
Short-Term Weakness: The price has also dropped below the 30 EMA, confirming bearish momentum in the short run.
🔄 Possible Scenario
Price is currently heading back down toward the demand zone, where a bounce is anticipated.
If it respects that zone, we may see a reversal toward the target zone at ~3,040.
If it breaks below 2,940, the setup would be invalidated (stop loss hit).
⚠️ Things to Watch
Rejection or support confirmation at 2,940 zone is key before entry.
Be cautious of continued bearish momentum if economic news or global risk sentiment shifts.
Look for bullish reversal patterns (e.g. hammer, bullish engulfing) at the demand zone for confirmation.
