USD/JPY) bullish trend analysis Read The ChaptianSMC Trading point update
This chart is an analysis of the USD/JPY currency pair on a 2-hour timeframe, and it presents a possible bullish scenario. Here’s a breakdown of the idea:
---
Key Points of the Analysis:
1. Support Level & Change of Character (ChoCH):
Price found strong support around 144.556.
A ChoCH (Change of Character) is noted, indicating a potential shift from a bearish to a bullish trend.
2. Bullish Reversal Setup:
The price is forming higher lows, suggesting the start of a "New Up Trend".
There's a clear zig-zag bullish projection, suggesting potential long opportunities.
3. Target Zones:
The first target point is in the range of 149.692 – 150.493.
This area is also marked with a resistance zone, making it a logical TP (Take Profit) level.
4. Risk/Reward Ratio:
The risk is around -3.75% (-564.8 pips), and the reward is around +3.94% (+569.2 pips), suggesting a 1:1.05 R/R ratio.
5. RSI Indicator (Below):
RSI is showing a bullish divergence (price made lower lows while RSI made higher lows).
This divergence supports the idea of a possible bullish reversal.
6. 200 EMA:
The 200 EMA is at 148.767, acting as a dynamic resistance. Price may react around that level before hitting the final target zone.
Mr SMC Trading point
---
Conclusion:
This analysis suggests a potential long trade setup on USD/JPY based on:
A support zone,
Bullish RSI divergence,
Market structure shift (ChoCH),
And projected movement toward 149.692–150.493.
Idea: Buy near the support zone (~144.556) and target the resistance zone (~150.493) while managing risk carefully.
---
Pales support boost 🚀 analysis follow)
Foryourpage

USD/JPY) Bullish reversal analysis Read The ChaptianSMC Trading point update
This chart is for USD/JPY on the 1-hour timeframe, and it presents a bullish trade setup. Let’s break down the idea
---
Key Observations:
1. Current Price:
USD/JPY is trading around 146.281.
2. Overall Bias:
Bullish setup expecting a bounce from demand into a higher target zone.
3. EMA 200:
Price is currently below the 200 EMA (147.942), which usually suggests a bearish trend — but this setup is aiming for a short-term bullish retracement.
4. Demand Zone (Buy Area):
Marked in yellow between 145.822 and slightly above.
Labeled as "FVG orders" (Fair Value Gap), suggesting institutional interest or imbalance fill.
5. Trendline Support:
The price is approaching a rising trendline, adding confluence for a potential bounce.
6. Expected Move:
Price is expected to bounce from the demand zone, form a higher low, and then move up toward the target zone at 148.221.
Two upside targets are drawn:
First Move: ~1.12% (30.6 pips)
Full Target: ~1.76% (256.1 pips)
Mr SMC Trading point
7. RSI (Relative Strength Index):
RSI is around 37.66, nearing oversold territory, supporting a bullish reversal idea.
---
Trade Idea Summary:
Bias: Bullish
Entry Zone: Around 145.822 (fair value gap & trendline support)
Target Zone: 148.221
Stop Loss: Likely just below the demand zone or trendline
Confluence Factors:
Trendline support
RSI nearing oversold
Fair value gap zone
EMA 200 overhead (target acts as resistance)
---
Pelas support boost 🚀 analysis follow

XAU/USD) Bearish trand analysis Read The ChaptianSMC Trading point update
This chart analysis is for Gold Spot (XAU/USD) on the 1-hour timeframe. Here’s a breakdown of the idea shown:
---
Key Points in the Analysis:
1. Current Price:
XAU/USD is around $2,982.92 at the time of the chart.
2. Trend:
The chart suggests a bearish outlook.
Price has been consistently rejected from the yellow supply zone (around 3,020–3,033).
EMA 200 (blue line) is above the current price, confirming downward momentum.
3. Rejection Zone:
Marked in yellow between 3,020 and 3,033. Labeled as “Reject points”.
Price failed to break above this zone multiple times.
4. Breakout Pattern:
Two descending rectangles highlight bearish continuation patterns.
A bearish flag or wedge is visible, followed by a breakout downward.
5. Target Zone:
Highlighted in yellow between 2,900 and 2,921, with target point at 2,920.615.
Price is expected to move down to this level.
6. RSI (Relative Strength Index):
RSI is declining and shows bearish divergence, supporting downside move.
Currently around 39.19, which is closer to oversold territory but still has room to drop.
Mr SMC Trading point
---
Trade Idea Summary:
Bias: Bearish
Entry Area: Rejection near 3,020–3,033 zone
Target: 2,920.615 (highlighted support zone)
Stop Loss: Could be placed above 3,033 (supply zone or EMA 200)
Confluence Factors:
EMA 200 rejection
Bearish RSI divergence
Repeated supply rejection
Breakout from bear flag structures
Pales support boost 🚀 analysis follow)

EUR /USD) bullish flag Analysis Read The ChaptianSMC Trading point update
This is a bullish technical analysis on the EUR/USD pair (2-hour chart), projecting a long opportunity based on price action and market structure.
---
Key Elements of the Chart:
1. Strong Key Support Zone:
Marked around 1.09273, acting as a critical base.
Price previously reacted strongly from this level, confirming it as a high-probability support area.
2. Bullish Channel:
The pair is moving within an ascending parallel channel.
Price is currently rebounding off the lower channel trendline, suggesting upward continuation.
3. Breakout & Retest Pattern:
A small flag/pennant correction is shown after a strong bullish impulse.
Expected breakout from this flag will lead to continuation toward the upper resistance.
4. Target Zone:
1.12977 is marked as the final target point, around 2.55% (281.4 pips) away from the current price.
Previous high structure adds confluence to this target.
5. RSI (14):
RSI is hovering around 50.5, indicating neutral momentum but room for upside.
No clear divergence, but aligned with a possible bullish continuation.
6. 200 EMA (1.08501):
The price is above the 200 EMA, supporting the bullish bias.
Mr SMC Trading point
---
Conclusion/Idea:
This analysis suggests a long setup on EUR/USD, with:
Entry idea near the key support (1.09273),
Bullish flag breakout in progress,
Target near 1.12977,
Risk management advised below support or lower channel.
Bullish Bias: Price structure, EMA support, and trend channel favor a long setup.
---
Pales support boost 🚀 analysis follow)

JPY/USD 30-Min Chart – Bearish Setup from Resistance Zone with 2200 EMA (blue): 0.0067930
30 EMA (red): 0.0068478
Current Price: 0.0068313
Price Position: Currently between the EMAs, showing consolidation and potential indecision.
🟪 Key Zones Identified
Entry Zone (Sell Area): Around 0.0068740
Stop Loss Zone: Above the resistance area at 0.0069118
First Target Zone (EA Resistance Point Target): Around 0.0067636
Final Target Zone (EA Target Point): Around 0.0066745
📉 Short Trade Plan
Entry Point: Price re-tests the resistance zone at 0.0068740
Stop Loss: Above key resistance at 0.0069118
Target 1 (TP1): 0.0067636
Target 2 (TP2): 0.0066745
Risk-to-Reward: Approx. 2.89x, with a -2.89% drop expected from entry to final target.
📊 Price Structure & Trend Insight
The chart shows bearish intent, with repeated rejections from the resistance zone.
A break below the 200 EMA and the support near 0.0067930 would signal stronger downside momentum.
The downward arrow and projection reflect a swing short setup based on market structure and key zones.
✅ Strategy Confirmation
Watch for:
Price rejection from the 0.0068740 level.
Bearish candlestick patterns in that zone (like bearish engulfing or shooting star).
Volume confirmation or momentum slowdown at resistance.

GOLD (XAUUSD) 30-Min Chart Analysis – Key Reversal & Breakout Zo200 EMA (blue): 3085.72 (bearish as price is below it)
30 EMA (red): 3033.52
Current Price: 3034.10
🟪 Key Zones (Highlighted in Purple)
Resistance Zone: Around 3045.54–3065.70
Support Zone: Around 2968.27
Previous High Zone / Target Area: 3158.42
📉 Short Trade Setup (Blue Arrow Going Down)
Entry Area: If price rejects the resistance zone around 3045–3065
Stop Loss: Above the zone, around 3065.70
Take Profit: At the support zone, 2968.27
Risk-to-Reward: Approx. 2.4x (shown as -2.43%)
📈 Long Trade Setup (Blue Arrow Going Up)
Entry Area: If price breaks and holds above the 3065.70 zone
Stop Loss: Below 3045.54 zone
Take Profit: 3158.42 (previous resistance)
Risk-to-Reward: Approx. 3.0x (shown as 3.00%)
💡 Analysis Summary
Price is currently ranging just below the resistance zone.
Two possible scenarios:
Rejection from the zone → short entry.
Breakout above zone → long opportunity.
Use EMA alignment for confirmation:
Bearish if price stays below both EMAs.
Bullish if price breaks above 200 EMA (3085.72).

GBP/JPY Technical Analysis: Bearish Rejection at Key Resistance?This chart represents a GBP/JPY (British Pound / Japanese Yen) 30-minute timeframe analysis. Here are the key takeaways:
Technical Indicators & Levels
Exponential Moving Averages (EMAs)
200 EMA (Blue Line): 193.586 – A long-term trend indicator.
30 EMA (Red Line): 193.182 – A short-term trend indicator.
Key Levels
Resistance Zone (Stop Loss Level): 193.968
Support/Target Zone: 191.628
Current Price: 193.255 (as per the last recorded candle)
Trade Setup & Market Structure
Bearish Outlook (Sell Scenario)
The price is approaching a strong resistance zone (193.968), which aligns with the 200 EMA.
The price might reject this level and drop toward the target area of 191.628 (approx. 1.00% downside).
The drawn price path suggests a possible retest of resistance before a bearish move.
Bullish Reversal (Invalidation of Bearish Setup)
If the price breaks and holds above 193.968, it could invalidate the bearish setup and push higher.
A sustained move above the 200 EMA may indicate a trend shift to bullish.
Conclusion
Bearish bias as long as the price stays below 193.968.
A possible short trade opportunity if resistance holds, targeting 191.628.
Caution: If price breaks above resistance, it could lead to a bullish breakout

Bullish Reversal Trade Setup for BTC/USD – 4H Chart AnalysisZone: Around 76,094 USD
This zone aligns with a demand/support area, highlighted by the purple rectangle.
Price has sharply dropped into this zone, suggesting a potential reversal or bounce opportunity.
⛔ Stop Loss
Level: Around 73,312 USD
Placed below the support zone to allow some volatility wiggle room.
A break below this could invalidate the bullish setup.
🎯 Target Point (Take Profit)
Level: 87,271 USD
Risk-to-reward ratio is approximately 1:3+, offering solid trade potential.
This level corresponds to a previously established resistance zone or supply area.
📊 Indicators
EMA 50 (red): ~82,106 USD
EMA 200 (blue): ~85,250 USD
Current price is below both EMAs, suggesting short-term bearish momentum, but this setup banks on a mean reversion or swing back up.
📈 Trade Idea Summary
Parameter Value
Entry 76,094 USD
Stop Loss 73,312 USD
Take Profit 87,271 USD
Risk/Reward ~1:3
Setup Type Bullish Reversal
🧠 Extra Notes
Wait for confirmation (candle reversal pattern) in the demand zone before entering.
Be cautious of fake-outs or breakdowns below support, especially with broader market weakness.

This chart shows a potential bullish setup for Gold (XAUUSD) on This chart shows a potential bullish setup for Gold (XAUUSD) on the 15-minute timeframe, with some key technical elements and a projected trade idea. Here's a breakdown of the analysis:
1. Current Market Overview
Price: Trading around $3,038.51.
Trend: Recent downtrend followed by a minor recovery.
Indicators:
EMA 200 (Blue): Currently at $3,090.41, acting as a dynamic resistance.
EMA 30 (Red): Positioned below the EMA 200, indicating a still bearish trend but with potential for a pullback.
2. Key Zones & Labels
Limit Entry Zone: Highlighted around $3,025.72 (bottom purple zone)
Labeled as “LIMIT ENTRY”, indicating a potential buy entry.
This area corresponds with a fair value gap (fvg) — often used in smart money concepts as a sign of institutional interest.
Target Zone: Around $3,082.22 (top purple zone)
Labeled as “target point EA”.
Lies just below the EMA 200 resistance level, which is a likely take-profit area for a bullish move.
3. Projected Price Action
A possible bullish retracement is anticipated:
Dip into the limit entry/fvg zone at ~$3,025.
Then, a rally targeting the $3,082 zone, possibly extending toward the EMA 200 at ~$3,090.
4. Trade Setup (Based on the Chart)
Entry: Around $3,025.72 (limit buy)
Target: Between $3,082.22 - $3,090.41
Risk: Likely below the FVG zone (~$3,015–$3,020), depending on risk appetite.

Gold (XAU/USD) Technical Analysis: SMC Trading point update
This chart is a technical analysis of Gold (XAU/USD) on a 4-hour timeframe. Here’s a breakdown
1. Ascending Channel:
The price is moving within an upward channel, showing a bullish trend.
Higher highs and higher lows confirm the uptrend.
2. Support and Resistance Zones:
Yellow Boxes: Key support zones where price previously consolidated before moving higher.
Red Arrows: Marking resistance zones where the price faced rejection.
Green Arrows: Indicating support levels where the price bounced.
3. Current Price Action:
Price recently dropped to a key support zone (around $3,050).
A bullish reaction is expected from this level.
If support holds, the price may continue the uptrend toward the target of $3,186.
4. Projected Move:
The black zigzag line suggests a potential bounce from support.
If the support level holds, price could move back up within the channel.
Mr SMC Trading point
Conclusion:
If price respects the support zone, there could be a good buying opportunity.
A break below the support zone would signal potential bearish movement.
Monitoring price action around the yellow zone is crucial for confirming direction.
Pales support boost 🚀 analysis follow )

USD/JPY Bullish Reversal: Order Block & EMA 200 TargetSMC Trading point update
This chart presents a technical analysis of USD/JPY on the 1-hour timeframe. The key insights from this analysis are:
1. Order Block & Potential Reversal
The price has dropped significantly and reached a highlighted order block zone (a key demand area).
A potential inverse head and shoulders pattern is forming, indicating a possible bullish reversal.
2. Expected Bullish Movement
The price is expected to bounce from the order block, creating a bullish structure.
The projected move suggests a retracement toward a resistance zone, which aligns with previous price action.
Mr SMC Trading point
3. Target Zone & EMA 200
The target zone is around 148.946 - 149.178, aligning with the 200 EMA, a significant resistance level.
4. RSI Indicator
The RSI is currently low (~38.93), indicating potential for a reversal as the market may be oversold.
Conclusion
The chart suggests a bullish retracement after the recent drop, targeting the resistance zone near the 200 EMA. However, confirmation is needed (e.g., bullish price action, volume increase) before taking a trade. Keep an eye on fundamental news that may impact USD/JPY volatility.
Pales support boost 🚀 analysis follow)

EUR/USD Bearish Correction: Resistance Rejection & Support TargeTrading point update
This chart provides a technical analysis of EUR/USD on the 3-hour timeframe with key insights:
Analysis & Expectations
1. Overbought Condition & Rejection
Price reached a strong resistance zone (highlighted in yellow) around 1.11425 - 1.10751, leading to a sharp rejection.
The RSI is in the overbought zone (~68.43) and showing a downward slope, indicating a potential bearish correction.
Mr SMC Trading point
2. Expected Bearish Correction
A potential drop is expected toward the support level around 1.08501 - 1.07925, aligning with past price action.
The 200 EMA (1.07757) also serves as a significant support level, reinforcing a possible retracement.
3. Target Levels
Short-term Bearish Target: 1.08501 (Support level)
Key Support Zone: 1.07925 - 1.07757 (Near 200 EMA)
Conclusion
The analysis suggests a bearish retracement after the strong bullish move. Traders may look for short opportunities targeting the support level and 200 EMA while watching for confirmation signals before entering.
Pales support boost 🚀 analysis follow)

Gold (XAU/USD) Technical Analysis: Key Resistance Test Before BrThis chart represents a Gold (XAU/USD) 30-minute timeframe analysis from TradingView. Here are the key takeaways:
Technical Indicators & Levels
Exponential Moving Averages (EMAs)
200 EMA (Blue Line): 3,110.97 – A long-term trend indicator.
30 EMA (Red Line): 3,134.65 – A short-term trend indicator.
Key Levels
Resistance Point: Around 3,136.56.
Support Zone (Stop Loss Level): 3,103.16.
Target Point: 3,167.44, indicating a potential 1.62% upside.
Potential Trade Setup
Scenario 1 (Bullish Case):
If price breaks above resistance (3,136.56) and holds, the next target is 3,167.44.
A bullish breakout could indicate further momentum.
Scenario 2 (Bearish Case):
If price fails to break resistance and drops, it could test the support zone around 3,103.16.
A break below this level might lead to further downside.
Pattern Analysis:
The chart suggests a potential retest of resistance before a breakout.
A possible accumulation phase before a strong move.
Conclusion
Bullish above 3,136.56, targeting 3,167.44.
Bearish below 3,103.16, watching for downside risk.
The 200 EMA (3,110.97) could act as dynamic support.

Bitcoin (BTC/USD) Technical Analysis: Breakout or Rejection at K200 EMA (Blue Line): 84,124 – This is a long-term trend indicator.
30 EMA (Red Line): 83,925 – A short-term trend indicator.
Key Levels
Resistance Point: Around 83,925 (marked in blue).
Support Zone: Around 82,184 (Stop Loss zone).
Target Point: 88,197, indicating a potential 6.34% upside.
Potential Trade Setup
Scenario 1 (Bullish Case):
If price breaks above resistance (83,925) and EMA 200, then a move towards 88,197 is expected.
A breakout confirmation might lead to an uptrend continuation.
Scenario 2 (Bearish Case):
If price rejects at resistance (83,925) and falls back below the support zone (82,184), a downward move could happen.
Pattern Analysis:
The chart suggests a potential accumulation phase before a breakout.
Possible retest of resistance before a rally.
Conclusion
Bullish above 83,925, targeting 88,197.
Bearish below 82,184, with potential downside.
Price action near the 200 EMA is crucial for the next move.

Gold (XAUUSD) 30-Minute Trade Setup: Bullish Reversal from SuppoThis chart represents a trading analysis for Gold (XAUUSD) on a 30-minute timeframe. Here are the key points from the chart:
Technical Indicators:
EMA (30, close) - Red Line: 3,124.52 (shorter-term trend)
EMA (200, close) - Blue Line: 3,090.41 (longer-term trend)
Trade Setup:
Entry Point: 3,108.21
Stop Loss: 3,098.52 (just below the support zone)
Target Point: 3,149.04 (potential profit level)
Analysis:
The price is currently bouncing from a purple support zone, which aligns with a short-term retracement.
The 30 EMA (red) is currently above the price, indicating short-term resistance.
The 200 EMA (blue) is significantly lower, showing that the overall trend is still bullish.
A potential long (buy) trade is suggested, as price is expected to reverse from the support level towards the target point of 3,149.04.
Risk-to-Reward Ratio:
The stop loss is set below the key support level to minimize risk.
The target price provides a significant profit potential.
Conclusion:
If price holds above 3,108.21, there is a strong bullish case.
If price breaks below 3,098.52, the bullish setup may become invalid.
Monitoring the 30 EMA resistance will be crucial for confirmation.

Bitcoin (BTC/USD) Short Trade Setup: Resistance Rejection & TargThis chart is a Bitcoin (BTC/USD) 15-minute price chart from TradingView, showing a potential short trade setup based on technical analysis. Here’s a breakdown of the key elements:
1. Resistance Zone & Short Setup
The purple highlighted area represents a resistance level around $85,358.
Price is consolidating within this resistance zone, suggesting a potential reversal.
The expected scenario involves a price rejection from this resistance, leading to a downward move.
2. Moving Averages
EMA (200, blue line) at $83,433: A long-term trend indicator suggesting a strong support zone.
EMA (30, red line) at $84,657: A short-term trend indicator, currently above the price, indicating a potential bearish setup if the price moves below it.
3. Target & Stop-Loss Le

Gold (XAUUSD) Bullish Trade Setup: Demand Zone Entry & Target PrThis is a gold (XAUUSD) trading chart from TradingView, showing a technical analysis setup on the 1-hour timeframe.
Key Observations:
Uptrend: The chart shows a strong bullish trend, with price making higher highs and higher lows.
Demand Zone (Entry Point):
A highlighted yellow zone around $3,121.38 indicates a demand area where price is expected to bounce.
This could be a support level or a key order block.
Stop Loss: Placed at $3,112.40, below the demand zone, to minimize risk in case the trade fails.
Target Point:
Set at $3,177.94, which is 1.69% above the entry point.
The expected reward is 52.77 points.
Risk-Reward Ratio: This setup follows a risk-reward strategy, aiming for a potential gain significantly higher than the risk taken.
Trading Strategy:
If the price retraces into the demand zone, a long position (buy) is expected.
A bounce from this zone could lead to a price surge towards the target.
If price falls below the stop-loss level, the trade is invalidated.
Conclusion:
This is a bullish setup relying on a pullback to a key support zone before continuation. Traders may monitor price action in the yellow zone for confirmation before entering a trade

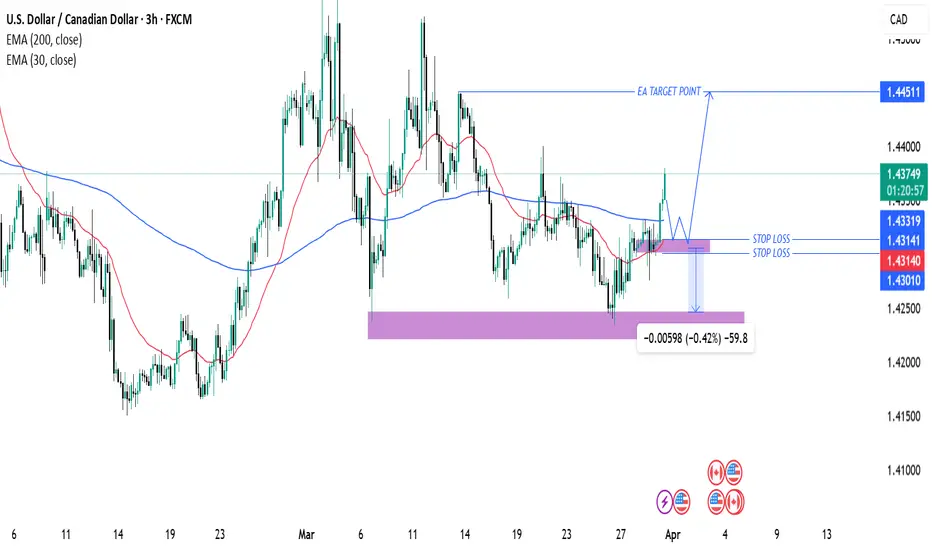
USD/CAD Bullish Trade Setup: Key Support, Entry, and Target AnalThis chart is a technical analysis of the USD/CAD currency pair on a 3-hour timeframe. Here’s a breakdown of the key elements:
Key Observations:
1. Exponential Moving Averages (EMAs):
200 EMA (Blue Line) at 1.43318 – A long-term trend indicator.
30 EMA (Red Line) at 1.43135 – A short-term trend indicator.
The price is currently trading above both EMAs, suggesting a bullish bias.
2. Support and Resistance Levels:
A support zone (purple box) around 1.43010 to 1.43141 has been identified, which the price is expected to respect.
The target level (EA TARGET POINT) is set at 1.44511, indicating a bullish price movement expectation.
3. Entry, Stop Loss & Take Profit:
Entry Point: Near the 1.43318 level (current price area).
Stop Loss: Placed below the supp
AUD/PLN Technical Analysis – Reversal Opportunity AUD/PLN Chart Analysis (1H) on TradingView 📊 🔴 Overall Trend: ➡️ The price is following a bearish trend 📉, trading below the 200 EMA (🔵 2.45308) and the 30 EMA (🔴 2.43309). ➡️ The market is showing selling pressure, but the price has reached a key support zone 🟣. 🟣 Support Zone (Possible Reversal) 🔵 Potential Entry: 📍 2.41633 (inside the support zone) 🔵 Stop Loss: ❌ 2.40157 (below support) 🔵 Take Profit: ✅ 2.46072 (near resistance and the 200 EMA) 📈 Movement Projection: 🔹 An upward movement of 1.82% 🚀 (0.04389 points) is expected. 🔹 To confirm the uptrend, the price must break above the 30 EMA 🔴 and the 200 EMA 🔵. 💡 Conclusion: 🔸 The chart suggests a buy strategy in the support zone with a target at the resistance. 🔸 If the price breaks the support, it could continue its decline 🚨.

GBP/USD 1-Hour Chart Analysis: Bearish Setup with Key ResistanceGBP/USD 1-Hour Chart Analysis: Bearish Setup with Key Levels
Key Technical Indicators:
Current Price: $1.29427
30 EMA (Red Line): $1.29453 (Short-term trend)
200 EMA (Blue Line): $1.29351 (Long-term trend)
Key Resistance Zone: $1.29663 - $1.29851 (shaded purple)
Support & Target Levels:
TP 1: $1.29358
TP 2: $1.29153
TP 3: $1.28895
Final Target: $1.28662
Analysis:
Trend:
The price is struggling around the 30 EMA and 200 EMA, showing indecision.
The shaded resistance zone ($1.29663 - $1.29851) is a key area where sellers may take control.
Trade Setup:
Entry: Expected near $1.29663 (potential rejection from resistance).
Stop Loss: Above $1.29851 (to minimize risk if price breaks higher).
Take Profit Targets: Multiple levels, with the final target at $1.28662.
Bearish Confirmation:
If price gets rejected at resistance, a downside move toward support levels is likely.
A break below 1.29358 could accelerate selling pressure.
Conclusion:
The chart suggests a potential bearish trade setup, with resistance acting as a key rejection point.
Watch for confirmation signals at the resistance zone before entering a short trade.
A break above $1.29851 would invalidate the bearish outlook.

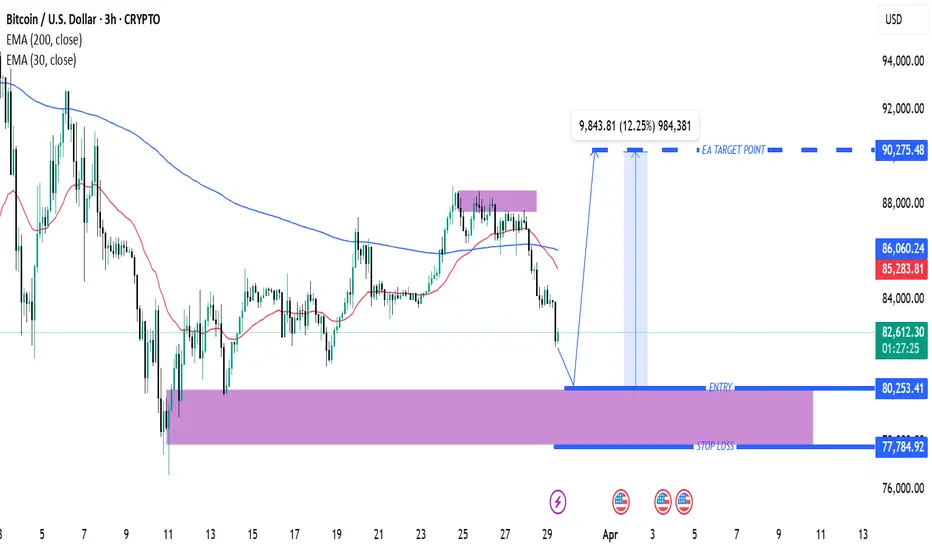
Bitcoin (BTC/USD) 3H Analysis: Key Support & Potential 12% UpsidSupport and Entry Zone (Purple Area at ~$80,253.41)
A significant support zone is marked in purple, indicating a potential area for entry.
This is an area where buying interest is expected.
Stop Loss (~$77,784.92)
A stop loss level is defined below the support zone, which is a risk management strategy.
Target Price (~$90,275.48)
The chart suggests a bullish move if the price bounces from the support.
The expected price increase is around 12.25% from the entry level.
Exponential Moving Averages (EMA)
30 EMA (Red Line, $85,290.12): Short-term trend indicator.
200 EMA (Blue Line, $86,061.21): Long-term trend indicator.
The price is currently below both EMAs, suggesting a bearish trend in the short term.
Market Outlook
The price has recently rejected resistance (purple zone above).
If it holds support at ~$80,253.41, a reversal to the upside is expected.
If the support breaks, further downside could follow.
USD/JPY Bullish Trade Setup – Key Support & Target ProjectionThe chart represents a USD/JPY (U.S. Dollar / Japanese Yen) 30-minute timeframe trade setup. Below is the analysis:
Technical Analysis:
Key EMAs:
200 EMA (Blue Line): 150.367 – Serves as dynamic support.
30 EMA (Red Line): 150.753 – Currently acting as resistance.
Support & Resistance Zones:
Entry Zone: 150.356 - 150.367 (Highlighted in purple).
Stop Loss: 150.022 (Below the key support).
Target Point: 151.269 (Near previous highs).
Market Structure & Price Action:
The price is pulling back into the highlighted demand zone.
A possible bullish reaction is expected at this level, leading to an upside push toward 151.269.
If the support holds, the price may bounce and confirm an uptrend continuation.
Trade Plan:
Entry: Around 150.367 after confirmation of price rejection.
Stop Loss: Below 150.022 (to protect against downside risk).
Take Profit: 151.269 (Aligns with previous high and resistance).
Conclusion:
The setup favors a buy trade if price action confirms a bounce from the demand zone.
A break below the stop-loss level may invalidate the setup, signaling a potential bearish continuation.

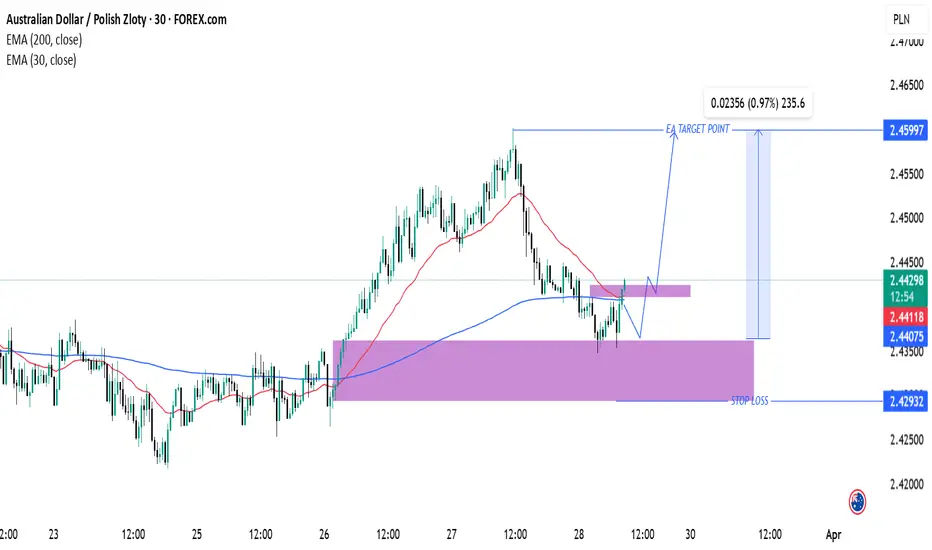
AUD/PLN Trade Setup: Bullish Reversal & Target ProjectionAUD/PLN Technical Analysis & Trade Setup
Chart Overview:
Currency Pair: Australian Dollar (AUD) / Polish Zloty (PLN)
Timeframe: 30-minute chart
Indicators:
200 EMA (Blue): 2.44075
30 EMA (Red): 2.44113
Key Levels & Strategy:
Support & Resistance:
Major Support Zone: Around 2.42932 (Stop Loss Area)
Intermediate Resistance: Near 2.44228
Target Resistance (Take Profit): 2.45997
Trade Projection:
The price recently bounced off the support zone (purple).
A possible retracement and retest of resistance before a strong upward move.
Targeting 0.97% profit potential from 2.44228 to 2.45997.
Entry Strategy:
Confirmation of support hold at 2.44075 - 2.44228.
If price respects this zone, a bullish continuation is expected.
If support fails, price may revisit the stop-loss area (2.42932).
Conclusion:
If price sustains above 2.44113, a bullish move is expected.
Watch for a breakout above resistance for a confirmed long entry.
A drop below 2.42932 would invalidate the setup.