GBP/USD Trade Analysis: Bullish Reversal from Support ZoneExponential Moving Averages (EMAs):
200 EMA (Blue) at 1.29309: Represents the long-term trend.
30 EMA (Red) at 1.29122: Represents the short-term trend.
Price is currently below both EMAs, suggesting a bearish trend.
Support and Resistance Zones:
Resistance Zone (Purple at the top): Price previously reacted strongly at this level.
Support Zone (Purple at the bottom): A potential demand area where price is currently bouncing.
Trade Setup:
Entry Point: Near 1.28875 (highlighted on the chart).
Stop Loss: Set around 1.28714-1.28856, below the support zone.
Target Point: 1.29730, above the resistance and near the 200 EMA.
Risk-to-Reward Ratio: The setup aims for a higher reward than risk.
Trade Idea:
Bullish Reversal Trade: The price is reacting at a support zone, and the target aligns with a previous resistance level.
A confirmation (strong bullish candle or break of 30 EMA) could indicate a move toward 1.29730.
EMA Crossover Watch: If the 30 EMA crosses above the 200 EMA, it may confirm a stronger uptrend.
Potential Risks:
If price breaks below 1.28714, the bullish idea is invalid.
Resistance at 1.29309 (200 EMA) could slow the move upward.
Foryourpage

USD/CAD Bullish Breakout: Trade Hits Target Successfully200 EMA (Blue) at 1.43070: Represents long-term trend resistance.
30 EMA (Red) at 1.42660: Represents short-term trend direction.
Price has strongly surged above the 30 EMA, indicating bullish momentum.
Support and Resistance Levels:
Support Zone (Red area at the bottom): Marked near 1.42150, where the price reversed.
Target Resistance (Blue at the top) at 1.43672: Marking the expected profit zone.
Trade Setup:
Entry Point: Near the support zone at 1.42451-1.42660.
Stop Loss: Placed below 1.42150, to minimize risk.
Target Point: 1.43672, aligning with a previous resistance level.
Price Movement: A strong bullish breakout occurred, moving rapidly toward the target.
Trade Analysis:
✅ Successful Long Trade: Price moved sharply upward after consolidating at support.
📈 Momentum Confirmation: The strong bullish candles indicate aggressive buying.
🎯 Target Achieved: The trade reached the projected 1.43672 level, generating a solid risk-to-reward outcome.
Potential Future Outlook:
If the price sustains above 1.43672, further upside could be seen toward 1.44000.
If it faces resistance, a pullback toward 1.43070 (200 EMA) may occur before another move.

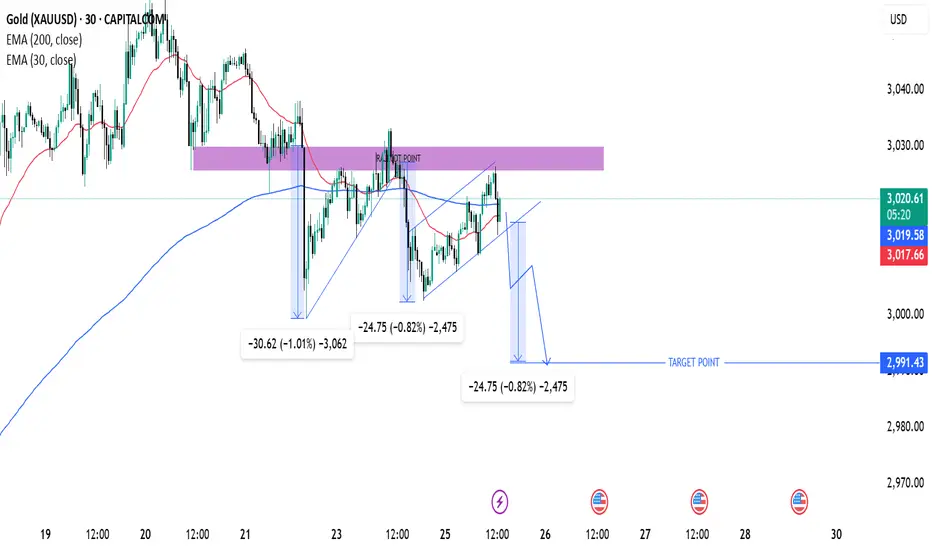
Gold (XAU/USD) Bearish Setup – Potential Drop to $2,991This is a trading setup for Gold (XAU/USD) on the 30-minute timeframe, showing a potential bearish move.
Analysis:
Key Indicators:
200 EMA (blue line) at 3,019.55: Acting as a resistance level.
30 EMA (red line) at 3,017.45: Providing short-term trend guidance.
Price Action & Structure:
The price previously rejected from a resistance zone (purple area) and started forming lower highs.
Repeated bearish patterns suggest another potential drop.
The chart highlights measured moves of previous declines (-30.62, -24.75), indicating a possible repeat of the pattern.
Trade Setup:
Bearish Outlook: Price is expected to drop towards the target point at 2,991.43.
Entry: Near the break of the lower trendline in the ascending wedge.
Target: 2,991.43 (marked as "TARGET POINT").
Risk Management: Ensure proper stop-loss placement above recent highs.
Conclusion:
If price respects the pattern, a downward move is likely.
A confirmed break below support could accelerate the drop.
Bitcoin (BTC/USD) 2H Analysis: Potential Bullish Continuation or30 EMA (Red, 86,440): Indicates short-term momentum.
200 EMA (Blue, 85,153): Represents long-term trend support.
Support and Resistance Zones
Support Zone (Purple Box - ~86,271 to 85,153): Price is likely to bounce from here.
Resistance Zone (~87,149 and above): Breakout above this could push price higher.
Trade Setup
Entry Consideration: The price is currently testing a demand zone (purple) after a pullback.
Target (Take Profit - 90,118): Expecting a bullish move.
Stop Loss (~86,658 or lower): To manage risk.
Potential Price Action
If Bitcoin holds above the purple demand zone and 30 EMA, it could rally to 90,118.
A breakdown below 86,271 could push it toward 84,366 or lower.
Conclusion
Bullish Bias: If price holds above the support level.
Bearish Risk: If it breaks below the purple zone.
Recommendation: Monitor support at 86,271 and 85,153, as a bounce from these areas could confirm an uptrend.

USD/JPY Bullish Outlook – Targeting Key Resistance at 150.155USD/JPY Technical Analysis – Bullish Outlook Toward Resistance
Chart Insights:
The price is currently in a recovery phase after a significant drop.
A Fair Value Gap (FVG) zone has been identified, suggesting a potential pullback before further movement.
The target point aligns with the resistance level around 150.155, which acts as a key supply zone.
Potential Scenario:
Price may retrace into the FVG zone around 148.704 – 148.956.
A bullish rebound from this level could drive price toward the resistance at 150.155.
If price reaches the resistance level, further rejection or continuation will depend on market conditions.
Key Levels:
Support Zone: 148.167 – 148.315
FVG Area: 148.704 – 148.956
Resistance Zone: 150.007 – 150.155 (Target area)
Conclusion:
The current structure suggests a bullish bias if price respects the FVG zone for a push higher. However, a break below the FVG could signal further downside movement

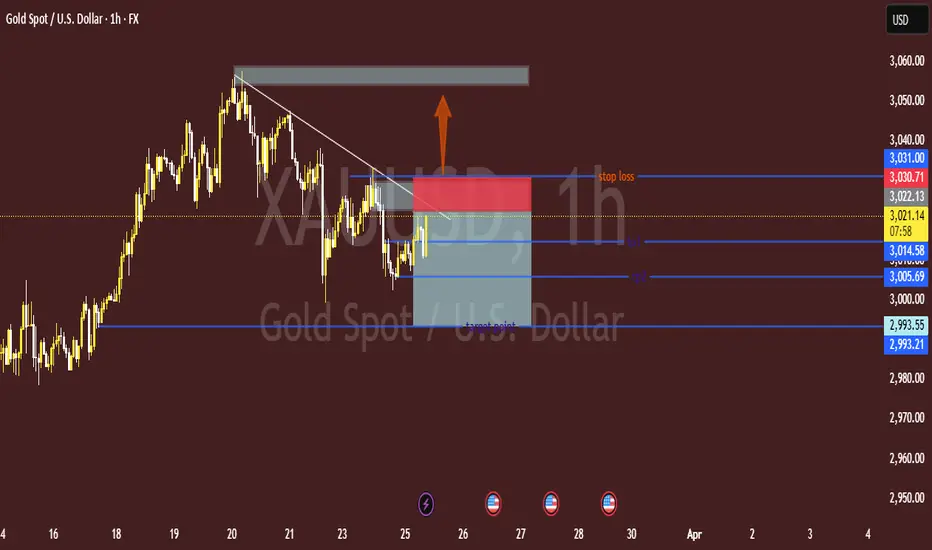
"XAU/USD (Gold) Potential Reversal Setup — Bullish Recovery or FAlright! Let's break down the chart analysis for XAU/USD (Gold vs. USD) 📊💛:
Structure & Trend:
The market is in a corrective phase after a clear downtrend. The trendline break shows potential bullish momentum.
Zone Analysis:
The gray box represents a supply zone (strong resistance). Price may struggle to break above this area.
The target points (TP1 and TP2) are likely support levels where price might react if it drops.
Trade Setup:
The blue box indicates the potential buy zone with a stop loss slightly below it.
The stop loss is set around 3,030.71 - 3,031.00, aiming to minimize risk.
TP1: 3,014.58 — Short-term target.
TP2: 3,005.69 — A more conservative, safer target.
Bias:
The bullish arrow suggests a possible move upward if the price can maintain above the current support.
📌 Conclusion:
If you plan to buy, wait for a strong bullish confirmation (like a bullish engulfing candle) before entering.
If price breaks the stop loss level, a deeper drop may occur toward 2,993.55 - 2,993.21.
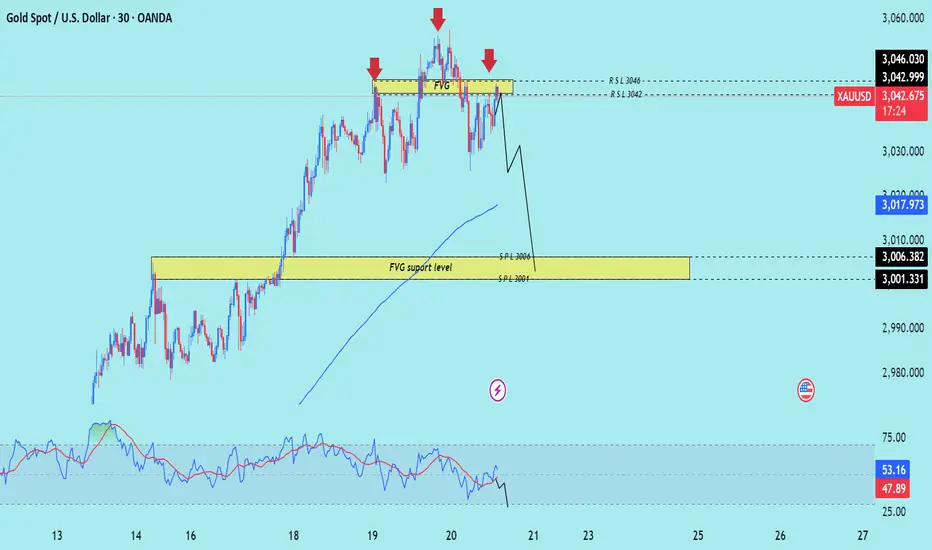
Gold (XAU/USD) Bearish Outlook: Key Levels to WatchBuddy'S dear friend SMC Trading Signals Update 🗾 🗺️
This chart represents the price action of Gold (XAU/USD) on a 1-hour timeframe, showing potential areas of resistance, support, and liquidity zones. Here’s a breakdown of the analysis:
Analysis of the Chart:
1. Resistance Level (3,023-3,030 zone)
The price has reacted multiple times (red arrows), indicating strong selling pressure.
A fair value gap (FVG) is present, suggesting potential mitigation before further movement.
2. Current Price (3,011.76)
The price is trending downward after rejecting the resistance level.
It is approaching the diamond zone, a potential short-term support before continuation.
3. Key Support Levels:
Diamond Zone (~3,000 region)
Could cause a temporary bounce before further decline.
Order Block (~2,952-2,938 zone)
This is a strong demand zone and a potential target area for price action.
4. Target Levels:
The analyst expects a downward move toward 2,952, aligning with a liquidity grab scenario.
5. RSI Indicator:
RSI is at 44.27, suggesting bearish momentum, with the possibility of further downside.
A break below 40 RSI may confirm more selling pressure.
Mr SMC Trading point
Risk Management Considerations:
Entry: A possible short entry could be around the FVG level (~3,020-3,030) if price retraces.
Stop Loss: Above 3,035 to avoid being trapped in a fake breakout.
Take Profit: Around 2,952-2,938 as per the target point.
USD Update & Impact on Gold:
If USD strengthens, gold may drop further due to their inverse correlation.
Key upcoming economic data (interest rate decisions, inflation reports) could increase volatility.
Pales support boost 🚀 analysis follow)

EUROUSDT TRADING POINT UPDATE >READ THE CHAPTIAN Buddy'S dear friend
SMC Trading Signals Update 🗾🗺️ Euro USD Traders SMC-Trading Point update you on New technical analysis setup for Euro USD ) Euro USD Technical patterns support level pullback up trend 📈🚀 1.08254 strong 🪨 support level target 🎯 point Resistance level 1.09580 good luck 💯💯
Key Resistance level 1.09580
Key Support 1.08254
Mr SMC Trading point
Palee support boost 🚀 analysis follow)

Bitcoin (BTC/USD) Supply & Demand Zone Analysis – Potential BearThis chart represents a Bitcoin (BTC/USD) price analysis on a 30-minute timeframe. Here’s a breakdown of the key elements:
Supply Zone (Resistance) at ~$85,599
The price has approached this supply zone, which could act as a resistance level.
The expectation is that the price may struggle to break above this level and could reverse downward.
Demand Zone (Support) at ~$81,500 - $81,755
This is labeled as the "diamond zone," which could act as a strong support area where buying interest may emerge.
The price is anticipated to decline towards this level.
Projected Price Movement
The blue arrows suggest a bearish scenario.
The price might initially react to the supply zone, then break below the trendline, confirming a downtrend.
The target for this downward move is the demand zone around $81,500.
Trendline Break
A rising trendline is drawn, which currently acts as support.
If the price breaks below it, it would confirm a bearish momentum shift.
Conclusion
This chart suggests a short-selling opportunity near the supply zone, targeting the demand zone. However, traders should watch for confirmations such as a rejection from resistance and a break below the trendline before entering a trade.

GOLD TRDAING POINT UPDTAE > READ THE CHAPTIAN Buddy'S dear friend
SMC Trading Signals Update 🗾🗺️ Gold Traders SMC-Trading Point update you on New technical analysis setup for Gold 🪙 list time post signals 💯 reached target point 3059. ). Analysis update on gold. Gold look 👀 patterns chart 📉 sellers recover and strong 💪. 30M time frame 🖼️ looking short trend 📉 target 🎯 point 3001 that entry buying said good luck 💯
Key Resistance level 3042 + 3046
Key Support level 3006 - 3001
Mr SMC Trading point
Palee support boost 🚀 analysis follow)
USDCAD EA MAN UPDATE >READ THE CHAPTIANKey Observations:
Support Zone & Trendline: The price is currently pulling back to a support zone, aligning with the ascending trendline, which may provide a bullish reaction.
EMA Confluence: The price is positioned above the 30 EMA (1.43193, red) and approaching the 200 EMA (1.43167, blue), indicating strengthening bullish momentum.
Target Point: If the price holds at the support and resumes its uptrend, the next target is around 1.43803 - 1.43689.
A break and close above the recent high could confirm further bullish movement towards the target zone. However, if the support fails, a deeper retracement may occu

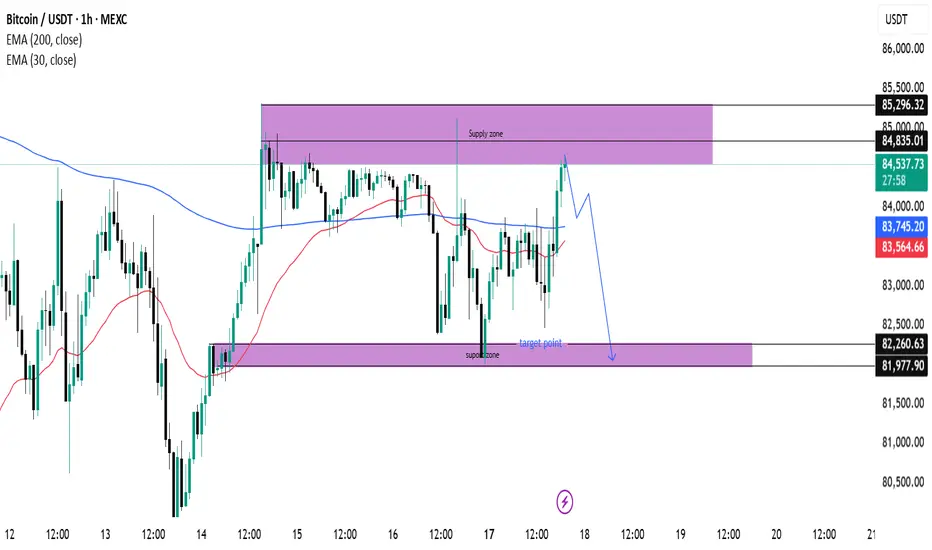
(BTC/USDT) Analysis: Supply Zone Rejection & Potential Drop Key Technical Levels:
Supply Zone (~85,296 - 84,835):
The price has reached a supply zone, which is acting as resistance. A rejection from this area could push BTC down.
Support Zone (~82,260 - 81,977):
This is a demand area where buyers might step in if the price declines.
Indicators:
EMA 30 (Red Line - 83,553.82): Short-term trend indicator.
EMA 200 (Blue Line - 83,743.52): Long-term trend indicator, currently above the price, indicating potential resistance.
Price Action & Prediction:
The price has touched the supply zone and is showing signs of rejection.
The blue projected path suggests a potential pullback followed by a drop toward the support zone (~82,260).
If price breaks below the support zone, further downside could be expected.
Potential Trade Idea:
Short Setup: If rejection at the supply zone continues, a short position could target the 82,260 support zone.
Long Setup: If price reaches the support zone and shows bullish reactions, a long position could aim for a rebound toward resistance.
GOLD TRADING POINT UPDATE >READ THE CHPTAIAN Buddy'S dear friend 👋.
SMC Trading Signals Update 🗾🗺️ Euro USD Traders SMC-Trading Point update you on New technical analysis setup for Euro USD) Euro USD still going to bullish trend 🚀 analysis update 1.09483 rejected point below 👇 trend following support level again back up trand 1.09129 - 1.08959 support level buying zone ☺️ 🥂
Target 🎯 point 1.09865 good luck 💯💯🤞
Key Resistance level 1.09476 + 1.09865
Key Support level 1.09129 - 1.08959
Mr SMC Trading point
Pales support boost analysis follow)

Gold (XAU/USD) 15-Minute Analysis – Bearish Reversal from ResistThis chart is a 15-minute timeframe analysis of Gold (XAU/USD) using TradingView. Here's the breakdown of the analysis:
Key Levels & Setup:
Entry Zone (ENTRE): Around 3,004.172 - 3,003.999
Stop Loss (SL): 3,010.919 - 3,010.746 (Above the resistance zone)
Take Profit Targets:
TP1: 2,995.869
TP2: 2,987.219
TP3: 2,980.646
Technical Indicators:
Exponential Moving Averages (EMAs):
EMA 30 (Red Line): 2,992.313 (Short-term trend)
EMA 200 (Blue Line): 2,978.242 (Long-term trend)
Market Structure & Trade Idea:
The price is near a resistance zone (purple area), indicating a potential short-selling opportunity.
If the price fails to break above the resistance and reverses, it could drop toward the take profit levels.
The risk-to-reward ratio looks favorable, with the stop loss set just above resistance.
A break below the 30 EMA could further confirm bearish momentum toward 200 EMA.
Trade Execution Plan:
Short Entry: If the price respects the resistance area and starts to reject downward.
Stop Loss: Above the resistance at 3,010.919.
Take Profits: TP1, TP2, and TP3 as per the marked levels.
Conclusion:
Bearish Setup: If price rejects resistance.
Bullish Risk: If price breaks above resistance and holds, the trade setup is invalid.

EUR/USD Analysis: Bullish Breakout Towards 1.09524EUR/USD 30-Minute Analysis – Potential Bullish Breakout Towards 1.09524 📈
Key Observations:
Support Level: Around 1.08700, acting as a critical area for price action.
Resistance Zones: A key resistance area is visible around 1.09000 before reaching the target of 1.09524.
Moving Averages:
The 30 EMA (red) at 1.08747 is currently near price action, indicating short-term dynamic support.
The 200 EMA (blue) at 1.08601 suggests a broader trend still in transition.
Trendlines & Structure:
A downward trendline has been broken, and price is now retesting previous resistance-turned-support.
The expectation is a bounce from the support area leading to a potential bullish move.
Potential Trade Setup:
Bullish Scenario: If price holds above the 1.08700 support, a push toward 1.09524 could be expected.
Bearish Scenario: A failure to hold the support may indicate a return to the 1.08600 region.

Bitcoin (BTC/USD) 30-Min Analysis: Bullish Breakout Towards $87This chart represents a 30-minute timeframe of Bitcoin (BTC/USD) on the BITSTAMP exchange. Here's a breakdown of the analysis:
Key Observations:
Support and Resistance Zones:
A Fair Value Gap (FVG) support zone is marked in purple around 82,343 - 83,498, indicating potential demand.
Another resistance zone is identified near 85,000, where price might react before moving further.
The final target point is near 87,947, suggesting a potential breakout.
Exponential Moving Averages (EMAs):
The 200 EMA (blue, 83,498) is acting as a dynamic support.
The 30 EMA (red, 83,654) is closer to the current price, indicating short-term momentum.
Trend Analysis:
An ascending trendline supports the uptrend.
The price bounced from the FVG support zone and surged, signaling bullish momentum.
Projec ted Move:
The blue arrow suggests an expected bullish breakout after a retest of the resistance zone near 85,000.
A potential 6.76% gain is anticipated, targeting 87,947.
Conclusion:
Bullish Bias: The chart suggests an upward trajectory.
Key Confirmation: A clean break above 85,000 would validate the target.
Potential Risks: A drop below the FVG support may invalidate the bullish setup.

EUROUSD TRADING POINT UPDATE > READ THE CHPTIANBuddy'S dear friend
SMC Trading Signals Update 🗾🗺️ SMC-Trading Point update you on New technical analysis setup for Euro USD) Euro USD) Technical patterns choch looking for Bullish patterns support level 1.0866 Resistance level 1.09361 ) good luck guys 🤝
Key Resistance level 1.09361+ 1.09483
Key Support level 1.08802 - 1.08666
Mr SMC Trading point
Pales support boost 🚀 analysis follow)

BTCUSDT TRADING POINT UPDATE > READ THE CHAPTIANBuddy'S dear friend
SMC Trading Signals Update 🗾🗺️ crypto Traders SMC-Trading Point update you on New technical analysis setup for crypto BTC USDT. ) list time post signals 💯 reached target point ) 👉 New technical analysis setup BTC USDT looking for bullish trend 📈 FVG level support level. 83k 82k support level 87k 88k resistance level ). Guys 🤝 good luck 💯💯
Key Resistance level 87k + 88k
Key Support level 83k - 82kà
Mr SMC Trading point
Pales support boost 🚀 analysis follow)

BTCUSDT TRADING POINT UPDATE >READ THE CHPTAIN SMC Trading Signals Update 🗾🗺️ crypto Traders SMC-Trading Point update you on New technical analysis setup for crypto BTC USDT. ) crypto Traders BTC USD ) list time post signals 🚀 Hit sucksfully My target point ) Now update on New analysis setup. BTC USDT still drop 💧. Trend 📉. Technical patterns FVG) 85k. Back down trand target point 78k.
Key Resistance level 85k
Key Support level 81k- 78k
Mr SMC Trading point
Pales support boost 🚀 analysis follow)

BTCUSDT TRADING POINT UPDATE >READ THE CHAPTIAN Buddy's dear friend 👋
SMC Trading Signals Update 🗾🗺️ crypto Traders SMC-Trading Point update you on New technical analysis setup for crypto BTC USDT BTC still rejected supply zone. Again. Back Short Trade. FVG level) 83k I'm want to Sell now short trend 📈
Key Resistance level 93k + 95k
Key Support level 85k - 83k
Mr SMC Trading point
Pales support boost 🚀 analysis follow)

GOLD TRDAING POINT UPDATE >READ THE CHAPTIAN Buddy'S dear friend 👋
SMC Trading Signals Update 🗾🗺️ Gold Traders SMC-Trading Point update you on New technical analysis setup for Gold 🪙. Gold Traders Gold 🪙) weekly 1D 4H Time Frame Candle) update. Gold Gold weekly basis analysis setup. Close above. ) and close below)
Weekly Time Frame Candle close above 2887) NEXT targets 2956 ) 1D candle close below 👇 ⬇️ 2873 Next target 2788
weekly TFM
4 TFM
Key Resistance level 2888+ 2940 + 2956
Key Support level 2834 - 2788
Mr SMC Trading point
Pales support boost 🚀 analysis follow)

GOLD TRADING POINT UPDATE >READ THE CHAPTIAN Buddy'S dear friend 👋
SMC Trading Signals Update 🗾🗺️ Gold traders SMC trading point update you on New technical analysis update on gold 🪙 Gold still going to bullish trend 📈 Gold Traders Gold Ready for a new ATH 3010$. This weekend. I'm going to bullish trade on Gold. Today 💪 Take a Strong breakout Resistance level 2947 2954 back 🔙 Tast diamond zone support level. 2923 Now Gold. Don't wait more Sell Good luck 🤞🤞
Key Resistance level 2954 + 2961 + 2987 3010
Key Support level 2940 - 2930 - 2924
Mr SMC Trading point
Pales Support boost 🚀 analysis follow)

GOLD TRADING POINT UPDATE >READ THE CHATPIAN Buddy'S dear friend 👋
SMC Trading Signals Update Gold Traders SMC-Trading Point update you on New technical analysis update) Gold still going to buying zone ☺️ 🥂 running BSS AND CHO) patterns Now Gold making a new Bss again back up trand safe buying zone 2759) And Next buying target 🎯 point 2800) fundamental analysis / trump telling more rates cute ) that is expected it more gold)))
Key resistance level 2788 +2797 +2800
Key support level 2764 -2759
Mr SMC Trading point
Support 💫 My hard analysis Setup Lik like and following me 🤝 that star ✨ game 🎮
