BTCUSD Daily – Bearish Breakdown & Sell-the-Retests Setup
Here’s what the chart is saying, clean and to the point:
Market Structure
Clear distribution → breakdown sequence on the daily.
Price topped near the mid-90Ks, rolled over, and lost the 83–84K demand zone (former support marked in blue).
That loss flipped market structure firmly bearish.
Key Levels
Major breakdown level: ~83–84K (prior demand → resistance)
Supply / entry zone: ~72–74K (blue zone labeled “entry”)
Current support: ~67.4K (thin blue line)
Primary target: ~60–62K (grey demand zone)
Price Action Logic
The vertical sell-off into ~67K suggests impulsive bearish strength, not exhaustion.
The projected path shows a dead-cat bounce / consolidation into ~72–74K.
That zone aligns with:
Prior consolidation
Bearish retest logic
Likely supply from trapped longs
Trade Thesis (as illustrated)
Bias: Short
Entry idea: Sell a rejection in the 72–74K zone
Invalidation: Strong daily close back above ~75K
Target: 60–62K demand (first meaningful higher-timeframe support)
Big Picture
Unless BTC reclaims the 80K+ region quickly, this chart favors continuation lower, not a V-shaped recovery. The structure says rallies are for selling, not buying.
Freesignals

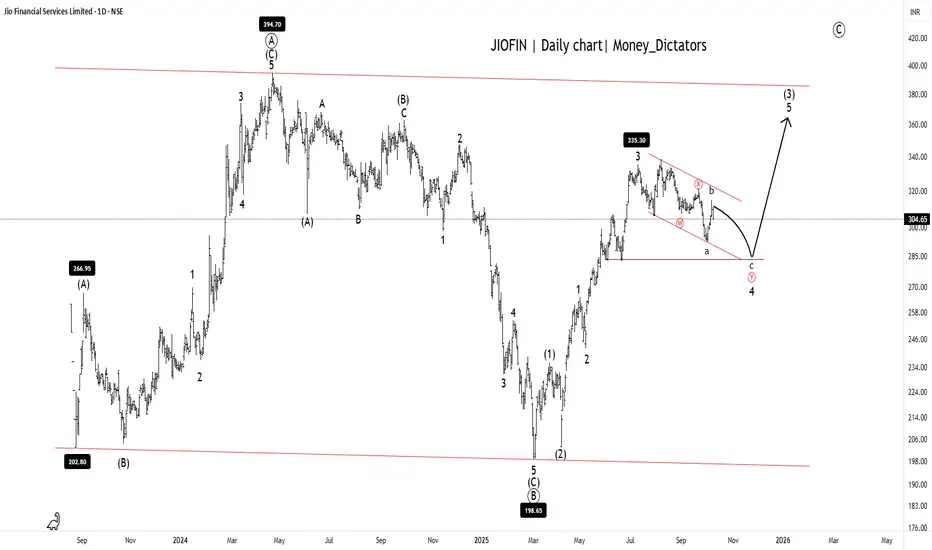
JIOFIN Setting Up for the Next Big Breakout!JIOFIN Daily chart
Possible short-term dip toward 285 - 290.
Long-term Levels: 335, 368, and 342.
Overall Trend: Bullish
Short-term trend: Bearish
JIOFIN is ready for the final upsurge as the correction ends at wave (C). A major A-B-C correction of the primary degree is clearly visible on the daily timeframe chart. Upon closer examination, it appears that the JIOFIN is currently in wave (Y) of wave 4. After completion of the wave 4 structure, stock will set for the wave 4 for the given long-term levels.
Stay tuned!
@Money_Dictators
Thanks :)
XAUUSD Alert| Liquidity Grab or Trend Reversal?”XAUUSD Alert 🚨 | Liquidity Grab or Trend Reversal?”
Gold has recently pushed into the 3525 – 3550 rejection zone, a level that has historically acted as strong supply. After this extended bullish rally, price is now showing early signs of exhaustion. This could be a liquidity grab above resistance before the market corrects lower.
My expectation here is a short-term pullback. The first key area I’ll be watching is around 3450, which lines up with a smaller demand zone and could act as a temporary support. If buyers fail to defend that level, then I expect continuation toward the 3330 – 3320 zone, which is my final target and also a major higher-timeframe support point.
This level is very important because it was previously a strong base for accumulation, and if tested again, it could provide a potential long opportunity. However, if price breaks below 3320 decisively, it would open the door for a much deeper correction.
Overall, my short-term outlook is bearish retracement, but I’ll be closely watching how price reacts once we reach the deeper support levels.

Institution Option Trading Part-1Role of Market Makers & Liquidity Providers
Institutions often rely on market makers for tight bid-ask spreads.
Market makers hedge every trade using delta-neutral strategies.
Their presence helps institutions build or unwind large positions without disrupting prices.
Institutional Examples in Option Trading
Hedge Funds: Use volatility arbitrage, gamma scalping, dispersion trading.
Insurance Firms: Use long-dated puts to hedge annuity products.
Banks: Write structured products with option-like features (e.g., equity-linked notes).
Asset Managers: Use protective puts or collars on core portfolios.

Advance Institutions Option Trading - Lecture 5When it comes to low risk options strategies, selling a call spread and selling a put spread are techniques that traders often utilize. These strategies are characterized by a high probability of profit due to the low probability of loss, and they limit risk in case the trade doesn't go as planned.
While day traders look at minute-to-minute price changes, swing traders look at trends that play out over several days. This is considered one of the most profitable trading types that allows more flexibility, as you don't need to be glued to your computer screen all day.

MACD Trading #Technical AnalysisMACD measures the relationship between two EMAs to indicate momentum and potential trade reversals, while the RSI seeks out overbought and oversold conditions by evaluating recent price action. These indicators are often used together to give analysts a more complete technical picture.
The MACD is a technical indicator designed to help traders and investors identify and time potential buy and sell opportunities. The MACD displays moving averages and a histogram to identify trends and measure their momentum.

Advanced Trading with StepsIf a person trades for excitement or social proofing reasons, rather than in a methodical way, they are likely trading in a gambling style. If a person trades only to win, they are likely gambling. Traders with a "must-win" attitude will often fail to recognize a losing trade and exit their positions.
Swing trading is a popular trading strategy designed to take advantage of price movements or 'swings' in the markets. Swing traders look to buy or sell an asset before its value makes its next substantial move, before closing their position for a profit.

Trading RoadmapOptions are highly sensitive to market volatility. Significant price swings can lead to substantial gains or losses. A trader might buy a put option expecting a stock to drop. If the stock instead surges in price due to unforeseen events, the value of the put option plummets.
Market Volatility: The futures and options markets are known for their high volatility, meaning prices can change rapidly and unpredictably. If you happen to be on the wrong side of one of these price swings, you can lose a tremendous amount of money in a very short amount of time.

Trading With Professional The Put-Call Ratio (PCR) is a popular technical indicator used by investors to assess market sentiment. It is calculated by dividing the volume or open interest of put options by call options over a specific time period. A higher PCR suggests bearish sentiment, while a lower PCR indicates bullish sentiment.
A PCR at one (=1) suggests that investors are purchasing the same amount of put options as call options and signals a neutral trend going forward. No PCR is considered ideal, but a PCR below 0.7 is typically viewed as a strong bullish sentiment while a PCR above 1 is typically viewed as a strong bearish sentiment.

Light crude oil, offering potential +33% return on investmentA triangle pattern formed in Light crude oil Futures. A breakout above this pattern could lead to the market reaching the target of USD 95. Offering a potential +33% return on investment. Best of luck!

DATABASE TRADING WITH OPTION CHAINOption chain data is the complete picture pertaining to option strikes of a particular stock or index in a single frame. In the Option chain frame, the strike price is at the center and all data pertaining to calls and puts on the same strike are presented next to each other.
Traders use an options chain to choose the specific option contracts that best align with their trading strategy. They can select options with the desired strike prices and expiration dates based on their market outlook. Options chains are crucial for assessing and managing risk.

Triangle Pattern Breakout after 25 years, Gain +112% PROFIT A Triangle Pattern has formed in Krung Thai Bank Public, and a Breakout is Expected after 25 years. This suggests a very Bullish Uptrend in the market. Take advantage of this Great Opportunity to Earn a Potential Profit of +112% ROI. As this is a Long-Term Analysis, it's important to follow Trend continuation techniques.

Nifty-50 Levels // 15 Min Support and ResistanceHello Everyone 👋
# On TradingView, the levels for Nifty-50 include:
Classic:
R1 (Resistance 1): 24,863.82
R2 (Resistance 2): 24,904.48
R3 (Resistance 3): 24,950.57
Pivot Point: 24,817.73
S1 (Support 1): 24,777.07
S2 (Support 2): 24,730.98
S3 (Support 3): 24,690.32

Bank-Nifty Levels // 15 Min Support and ResistanceHello Everyone 👋
# On TradingView, the levels for Bank-Nifty include:
Classic:
R1 (Resistance 1): ₹51,081.97
R2 (Resistance 2): ₹51,230.48
R3 (Resistance 3): ₹51,343.12
Pivot Point: ₹50,969.33
S1 (Support 1): ₹50,820.82
S2 (Support 2): ₹50,708.18
S3 (Support 3): ₹50,559.67

AUDCADClean price action and structure. One of my favorite setups for the next week as well. Price formed it's new Independent Trading range, came up to the supply zone 3 times already, made a fake move to the upside, now waiting for 15min flip to the downside for this setup to become valid. Tp first low and MM ( measured move )

XAUUSDAfter the strong drop in the price, Gold came into my interesting buy zone - the grey box and some buyers are stepping in. Now what I would like to see is a retracement all the way back up if possible. To get that I would like to see that structure confirm me that on smaller timeframes - more specifically, I want to see break of 15min bearish structure.

UPDATED THOUGTHS ON VIDEO ANALYSISHello traders, I am here with another video, this time with update from the last video I posted as today is Wednesday already. Currently it seem that some good set ups are developing on: NzdCad, EurJpy, AudNzd, AudChf, NzdUsd, EurUsd. I will be waiting to see what price will show me on this pairs. Thank you for following me, I will update you all with new analysis and thoughts once I see something interesting.

FX VIDEO ANALYSIS ( 22.7 - X )Good evening traders, welcome to another video analysis for quite a few FX pairs. I hope you will enjoy it and if it matches your rules get into some positions and profit from it. I had some technical issues while recording and had to record 3 times so I apologize for any minor mistakes I may have made during the recording. Have a good and profitable week ahead and God bless you!
T

PREVIOUS WEEK FX OVERVIEWHello traders, in this video I went quickly over the previous week market movement on FX pairs. I explained a bit about the structure and as I know long videos can be boring to watch I tried to keep it as short as possible. Thank you for following me.
T

NASDAQ100US100 has shows us a will go down, this may a reversal from HH. we may see more sell offs right after the rectracement, our entries will be snipers entries or nothing, remember we have patience and we are wait for our time to come. All trades must be taken after retracement. Use proper risk management, Lets Download Success .

CADCHF Buy Trade opportunityCADCHF Buy Trade opportunity
Currently, it changed the trend from Beaish to Bulish, and it recently breakout the short-term resistance line its good opportunity to take a buy trade here with the target next resistance area.

Bank Nifty Future Intraday Levels For 17th May 2023Bank Nifty Future Intraday Levels For 17th May 2023
All the levels are clearly mentioned in the chart.
Disclaimer - All The Levels Are Only For Educational Purpose.
Do Your Own Analysis Before Trade.

BANKNIFTY INTRADAY LEVELS FOR TOMORROW 9TH MAY 2023Bank Nifty Future Intraday Levels For 9th May 2023
All the levels are clearly mentioned in the chart.
Disclaimer - All The Levels Are Only For Educational Purpose.
Do Your Own Analysis Before Trade.
