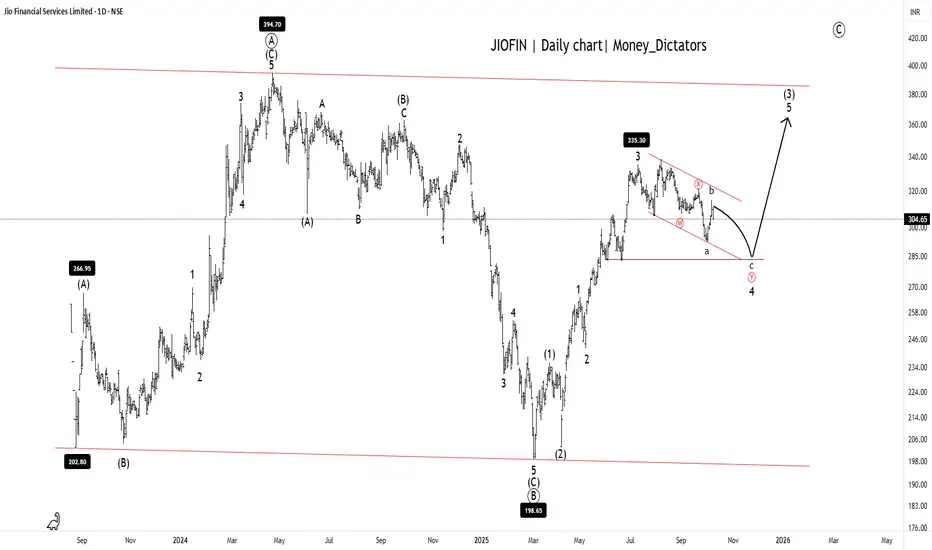
JIOFIN Setting Up for the Next Big Breakout!JIOFIN Daily chart
Possible short-term dip toward 285 - 290.
Long-term Levels: 335, 368, and 342.
Overall Trend: Bullish
Short-term trend: Bearish
JIOFIN is ready for the final upsurge as the correction ends at wave (C). A major A-B-C correction of the primary degree is clearly visible on the daily timeframe chart. Upon closer examination, it appears that the JIOFIN is currently in wave (Y) of wave 4. After completion of the wave 4 structure, stock will set for the wave 4 for the given long-term levels.
Stay tuned!
@Money_Dictators
Thanks :)
Freestocktips
Bearish Setup on NFLX: Correction Wave (C) UnfoldingTF: 4h
NFLX appears bearish at the moment. The corrective structure on the 4-hour timeframe suggests a potential decline. The current formation indicates that wave B likely completed at 998.61, and the stock has now begun its descent into wave (C) of the correction.
The correction may extend to the 100% projection of wave A at 788.67, or potentially deepen to 659.06, aligning with the 1.618 Fibonacci extension of wave A. After the completion of wave (C), traders can buy for the target up to wave B at 998.61.
I will continue to update the situation as it evolves.

NSE GLAND: A Critical Resistance Zone That Could Shift the TrendTimeframe: Daily
In NSE GLAND, the price has respected the channel in three distinct moves, indicating a potential 3-wave correction setup. Currently, it is trading below the 50 and 100 EMA, with ATR at 55.96 and ADX at 42.07 .
After reaching a high of 2220 , the price declined and formed a corrective structure. Wave (A) completed at 1585.7 , followed by wave (B) at 1964 . Presently, wave 4 of wave (C) is in formation. The 1545-1585 zone serves as a strong resistance, where a decisive breakout could shift the trend. However, the price still needs to reach 1328 to complete a 100% extension of wave A, making wave C = wave A at 1328 . A strong throw-under could enhance the probability of revisiting levels near wave (B).
We will update further information soon.

Is Tata Motors Ready for a Bullish Reversal?Timeframe: Daily
Tata Motors (NSE) has been in an expanded flat correction pattern for the past 11 months. In this pattern, the highest high (HH) was 1179, and the lowest low (LL) was 683.2. Currently, the price is trading below the 200, 100, and 50 EMA levels, indicating a bearish trend.
In this expanded flat correction:
Wave (A) completed at 855.4,
Wave (B) peaked at 1179,
Sub-wave 4 of Wave (C) touched 786.65,
Sub-wave 5 is now unfolding.
Once Wave 5 is completed, traders can look for buying opportunities with target levels at 799 – 951 – 1050+. First, it’s crucial to identify the end of Wave (C) to confirm the correction’s completion and a bullish reversal.
Projecting ending point of wave (C):
Wave (C) may end at 2.618% of Wave (A) around 628.7.
Wave 5 has multiple potential targets/support levels:
0.618 extension of Wave 1 at 526,
0.382 extension of Wave 1 at 628,
1.618 reverse Fibonacci of Wave 4 at 657,
2.618 reverse Fibonacci of Wave 4 at 562.
We will update further information soon.

NSE LINDEINDIA – Elliott Wave ProjectionTimeframe: Daily
NSE LINDEINDIA is currently trading below both the 100 and 200 EMAs, indicating a bearish trend. The ATR stands at 232, reflecting low volatility while supporting the ongoing downward movement. The price action has formed a descending channel, with a clear corrective pattern visible within this structure.
The price has completed wave 5 of wave (C) and begun moving upward. A downward value area is visible near the lower band of the descending channel. The price has reached 100% of wave (A), suggesting it has hit the anticipated Fibonacci ratio, indicating a potential correction. To confirm this assumption, the price must break above wave 4 of wave (C) at 6800 . If this breakout occurs, traders can look for the following targets in a long setup: 7500 – 8198 – 8660+.
We will update further information soon.

Part 1 - EUR/USD: Monthly Examination Utilizing Varied Approach
Price action Breakdown Analysis:
It is the EURUSD monthly timeframe, and it shows a downtrend for more than 15 years. The price has settled in a downward value area.
Elements of price action Breakdown:
Excess:
There are nine price excesses, four on the upper band and five on the lower band. It shows that the sellers were too aggressive when the price touched the upper band of the channel in comparison with the lower band at buyers. Buyers/Bulls tries makes the initiative to breakout the structure but end up when another party finds the price convenient for them.
Control line:
The control line represents the gravitational force to the price. The price can’t stay away until it breaks the range. There are twelve touches on the control line, and few are mentioned on the chart.
No Trading Activity Zone:
No trading activity is the zone where one party, either bull or bear, takes control and outnumbers the other. There are a total of 14 no-trading activities zone. Both of the participants have seen each other.
Sub-value area:
A rectangle sub-value area has taken place from March 2015 till now. An excess became a great place to buy the move, yet the upper band of the sub-value area provides strong resistance. The control line of this value area at 1.1480 is sharp enough to act as a pivot level. It could be a resistance to the current price.
Trend Justification:
Justification for the current market trend and the behavior of bulls and bears can be derived from four prominent lines on the chart.
Line 1, the lengthiest on the chart, connects the points from 1.5760 to the latest high at 1.2555. This line also intersects with the second line, indicating that a breakout in one line would likely trigger a simultaneous breakout in both lines.
Line 2 stands out as the most robust resistance line, evidenced by the price experiencing significant declines on more than three occasions upon reaching this line. Therefore, the continuation of the uptrend appears contingent upon a successful breakout above resistance line 2.
lliott Wave Projection:
According to Elliott wave analysis, the price has been undergoing a W-X-Y-X-Z formation, specifically identified as a triple zigzag, over a span of 15 years. The sequence involves the completion of wave (X) and the initiation of a downward impulsive wave denoted as (Z).
The Wave Formation unfolds as follows:
Wave (W): A flat correction pattern characterizes the formation of Wave (W).
Wave (X-1): Wave (X) takes shape in a standard zigzag formation, retracing 78.6% of Wave (W).
Wave (Y): This phase sees the construction of a zigzag pattern within Wave (Y), extended 1.618% of Wave (W)
Wave (X-2): Wave (X) materializes as an expanding triangle, retracing 50% of Wave (Y).
Wave (Z): The ongoing Wave (Z) is currently in progress, appearing to form sub-wave C. Notably, Wave (Z) has extended to 78.6% of Wave (Y).
For Bulls traders, a prudent entry point is identified as the breakout of Wave (X) at the level of 1.2349. No risky trader should initiate Long position until it breaks out Line 1 & Line 2.Wave (Y) = Wave (Z) at 0.8838. So, After the accomplishment of sub-wave B of wave (Z), traders can sell for final wave C of wave (Z).
Line 3, marked at 1.23427, serves as a horizontal resistance line. This line has played a crucial role, offering three supports and encountering two resistances. A substantial upward movement could potentially alter the overall trend post-breakout, given that it represents a lower high in the downward trend.
Line 4 represents a support level in close proximity to the current price, suggesting a potential stabilizing factor for the market at its current position.
Different pattern Formation:
Traders can see the following patterns on the monthly charts:
1. Wamine pattern
2. Contracting Triangle
3. Wave Diagonal
4. Expanding Triangle
5. ABCD Pattern
6. Moolahs pattern
We will Update Further information on weekly & Daily time frame soon.

NSE Dwarikesh Sugar Price Trend AnalysisAccording to EWT:
5th wave has already traveled for more than 2.618% reverse Fibonacci retracement of wave 4. Now, bullish momentum can push it up to 136 at 3.618% .

Bajaj Finserv: Short Setup For Intraday TradersAfter making a high of 17480, Bajaj Finserv has started falling.
Today, It has made a low of 14660 .
In 15 min timeframe, we can see a bearish butterfly pattern, which indicates a bearish trading setup for intraday traders.
Bajaj Finserv has completed its D point at 15250 . If the price sustains below 15250 , traders can expect the following targets: 15080 - 14902 - 14751.
Invalidation: Breakout D point
Thank You
Money_Dictators

NSE BankNifty: Technical AnalysisFirst, I recommend reading the previous report of BankNifty.
Link: BANKNIFTY Can't Wait to Fall – Even Without NIFTY's Help
According to technical analysis, Banknifty is trying to collapse. It needs solid support to reenter into the uptrend channel. The strong support is nearby the 34600 level. It will try to retest 35260 - 34880 - 34600 levels this week.
The uptrend will start in below two conditions:
A. If Banknifty remains above the uptrend channel.
B. If Banknifty breakout the parallel channel.
MACD , DMI , MA , and Volume are signaling bears are stepped in.
What will happen if conditions break? Don't miss reading the next report...

BANKNIFTY Can't Wait to Fall – Even Without NIFTY’s Help Key levels: 36496 - 37060
Bank Nifty was following the uptrend channel from Dec 2020, and it had broke on 02 March '22. There's a new parallel channel unfolded.
In the last trading session, Banknifty has created a shooting star pattern. And this pattern is a single line pattern that indicates an end to the uptrend. At the same time, it is close to a parallel channel resistance line. Moreover, advance traders must look at 100 EMA on it. These signs are signaling further decline. And that could be from the parallel channel's resistance line to control price.
An uptrend possibility comes from key levels breakout. So intraday traders can use it as an invalidation level. Moreover, Banknifty prices can hike up to that level this week.
If Banknifty doesn't cross/close above the second level, you should prepare for the following targets: 36000 - 35800 - 35400 below

NSE KoltePatil Stocks Prior Uptrend ResumeNSE KoltePatil stock overwhelmed today, and it hiked +34.10 ( +12.30% ). Technically, the A B C correction of the Elliott Wave is over. We can expect impulsive moves ahead. Today's volume spike and breakout of EMA 100 indicate bulls are stepping in. The uptrend can extend up to 322 - 340 - 350+ target price for intraday traders.
Further information I will update soon.

NSE DrReddys Fut Could Crash MoreDr. Reddys Labs Fut closed at a crucial level. It has to take a U-Turn from the current closing price. Otherwise, speculators will keep selling. And according to TA, we will see the target of 3780 - 3720 levels soon.

NSE AEGISCHEM More Selling BeginsAegis Logistics is seemed bearish more. It's the top loser stock of last Friday's market session. I have drawn this chart to show a bearish area to short-term investors. Wherein AEGISCHEM can show 150 - 138 - 118 levels into that area.
Intraday traders can sell for targets of 166 - 164 levels. And if it breaks the 164 level, then be ready for a downtrend.

EWT: Bigger Picture analysis of JK Laxmi CementJK Laxmi cement has accomplished impulsive wave ((3)) and has a complex correction of wave ((4)).
After making a high of 816 , the price started forming a corrective channel for wave ((4)).
It has made a low of 529.10 , and we can see a price surge to 630.
However, the price reached the upper band of the channel, but it is facing dynamic resistance of the parallel channel.
If the price does not break the parallel channel, we will consider it a lower high(LH).
Wave (4) retraced 38.2%, which is the common retracement.
Before starting a bull trend, the price will create public participants, which can be possible after a retracement.
Retracement is nothing but a pullback for bull traders.
If the price rejects from the upper band of the channel, it can come down to 61.8- 78.6% .
After the rejection, if the price reverses from the control line trader can initiate a buy position for 580-635-678-700+
Note Safe traders should buy after the clear breakout of the parallel channel. We are not interested in buying before a new lower high, which gives a signal of demand zone.
Breaking down the control line will create a new lower low which can go up to the upper band or 50%- 61.8%.
If you hit like on this idea, you will get all updates about JK Lakshmi cement through tradingview.com from my side.
I will upload an intraday chart soon.

Part VI: Nifty- Today's Price Action Analysis If nifty breaks 2nd target of 18314, we may see a good move above.
It can take a U-turn from 2nd TP to parallel channel C support trendline.

EWT: Will nifty hit 18000 before September end?Extending wave (5) should easily travel above 18000 and is likely to continue toward 18480.
Target 1: 18000
Target 2: 18142
Target 3: 18350
Target 4: 18480
Stay tuned for the next update.
