Advanced Database TradingIn trading, "database" refers to the collection and organization of market data, used for analysis and decision-making. This data, often including real-time quotes, historical prices, and other relevant information, is stored and managed within a database system for efficient retrieval and manipulation.
Fundamental-analysis

Technical TradingTechnical trading is a broader style that is not necessarily limited to trading. Generally, a technician uses historical patterns of trading data to predict what might happen to stocks in the future. This is the same method practiced by economists and meteorologists: looking to the past for insight into the future.

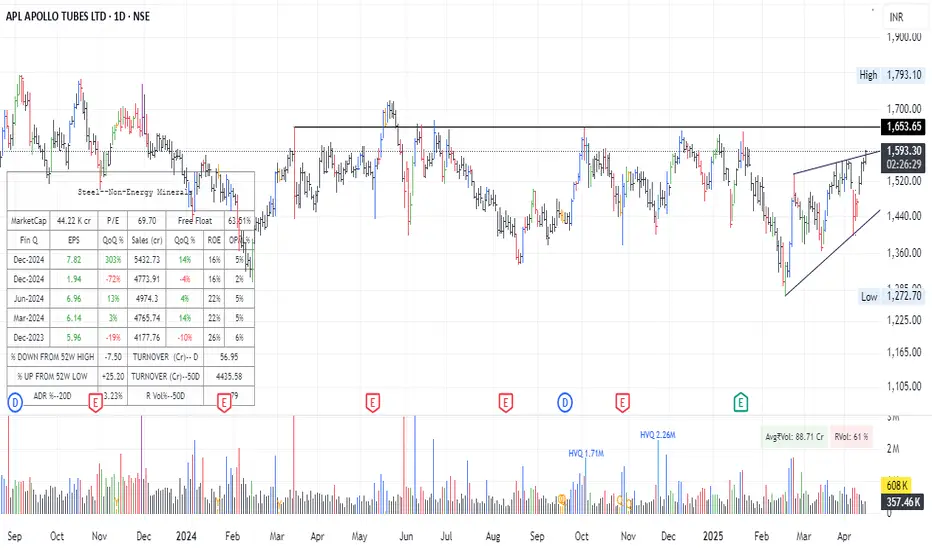
Apl Apollo Tube - ReRating Candidate !!??Stock peaked in Sep 2023.. Has been Range bound since almost 2 yrs now.. Interestingly had the best quarter ever last qtr.. Margins are stable and constant through many months.. If margins expand we are looking at a re-rating candidate.. Over all looking very interesting..
RSI Divergence Part 2RSI divergence happens when the price and the RSI move in opposite directions. This signals that the current trend may be losing momentum and could reverse soon. For example, if the price keeps rising but the RSI starts falling, it could mean the uptrend is weakening.

RSI ( Relative Strength Index)The Relative Strength Index (RSI) is a momentum oscillator used in technical analysis to measure the speed and change of price movements of an asset. It oscillates between 0 and 100 and is often used to identify potential overbought or oversold conditions. An RSI reading above 70 is generally considered overbought, while a reading below 30 suggests oversold conditions

Database Trading Part 3Trading data is a sub-category of financial market data. It provides real-time information about stock and market prices as well as historical trends for assets such as equities, fixed-income products, currencies and derivatives. Trading data also includes information about trades historically and over the course of a trading day, such as the latest bid, asking price and time of the last trade.

Candlesticks PatternCandlestick patterns are visual representations of price movements, used in technical analysis to understand and potentially predict future price trends. They are graphical representations of the opening, high, low, and closing prices of a security, currency, or commodity over a specific period. These patterns can offer insights into market sentiment and potential reversals or continuations of trends.

Swing Trading AnalysisSwing trading is a strategy that involves capitalising on the short-term price movements of stocks or other securities, focusing particularly on those with high activity and significant price fluctuations. This approach can be broken down into a few key steps: Selecting a Suitable Stock.

Option Chain AnalysisTo study an option chain, focus on the current market price, displayed in the centre. Analyse the built-up data to understand market direction based on recent changes in open interest and price. ITM call options are typically highlighted in yellow, making it easier to distinguish them from other options.

Explanation of RSI ( Relative Strength Index)The Relative Strength Index (RSI) is a momentum indicator used in technical analysis to measure the speed and magnitude of price changes, helping identify potential overbought or oversold conditions in a market.

Technical AnalysisTechnical analysis is a means of examining and predicting price movements in the financial markets, by using historical price charts and market statistics. It is based on the idea that if a trader can identify previous market patterns, they can form a fairly accurate prediction of future price trajectories.

Support and Resistance part2Support occurs at the point where a downtrend is expected to pause due to a concentration of demand. Resistance occurs at the point where an uptrend is expected to pause due to a concentration of supply.

Support And ResistanceIn trading, support and resistance refer to specific price levels on a chart where the market's price is expected to find either buying support (support) or selling pressure (resistance). Support is where buyers are expected to be plentiful, potentially preventing the price from declining further, while resistance is where sellers are abundant, potentially stopping the price from rising further.

Divergence Based Trading Divergence is typically used by technical traders when the price is moving in the opposite direction of a technical indicator. Positive divergence signals price could start moving higher soon. It occurs when the price is moving lower but a technical indicator is moving higher or showing bullish signals.

Option Trading An option is a contract that represents the right to buy or sell a financial product at an agreed-upon price for a specific period of time. You can typically buy and sell an options contract at any time before expiration. Options are available on numerous financial products, including equities, indices, and ETFs.

Meaning of Management and PsychologyManagement psychology explores how psychological principles and insights can be applied to understand and improve management practices within organizations. It helps managers understand human behavior, motivation, and decision-making processes, ultimately leading to more effective leadership and a better work environment.

Strong Breakout and Continuation Within Sideways RangeGold Analysis: Strong Breakout and Continuation Within Sideways Range 💰📈
Gold (XAU/USD) made a strong move within its sideways range after breaking down below the 3215 level. At the start of the Asian session, gold bounced back and is now maintaining an upward movement within the range from 3245 to 3215, forming a small upward channel on the M15 timeframe. This is a clear continuation of the bullish trend.
Key Support Levels:
3215, 3204, 3195, 3188, 3178, 3168
Key Resistance Levels:
3235, 3245, 3257, 3272
The buying pressure remains strong, especially at the recent support level of 3196, where we saw a quick response of 30 pips back up. There is still significant buying interest below these levels, just waiting for the right opportunity for another entry.
Today's Strategy:
With no major U.S. news expected today, the price range is likely to be similar to yesterday, with a move of about 30-40 pips. We are waiting for a pullback to buy again, and will avoid sell signals in the current market environment. Even if we anticipate a drop, the focus should be on buying at good support levels rather than selling too early.
Trade Setup:
BUY ZONE: 3196 - 3194
SL: 3190
TP: 3200 - 3204 - 3208 - 3212 - 3216 - 3220 - 3225 - 3230
SELL ZONE: 3244 - 3246
SL: 3250
TP: 3240 - 3236 - 3232 - 3228 - 3224 - 3220
Important Reminder:
If gold fails to break the 3135 level, consider selling back to the 311x zone. If the price reaches 3135 and continues to show strong buying pressure, wait for a potential push towards 3145 and consider selling if the previous resistance holds. Always stick to your TP/SL levels to ensure risk management.
Final Thoughts:
AD expects a pullback or correction during the end of the Asian session or at the beginning of the European session, providing an opportunity to buy at better levels. Avoid buying at uncertain levels and wait for the ideal pullback.
Trade Safely and manage your positions with clear TP/SL targets. Always prioritize risk management to protect your account.

Candlesticks pattern part 2A daily candlestick represents a market's opening, high, low, and closing (OHLC) prices. The rectangular real body, or just body, is colored with a dark color (red or black) for a drop in price and a light color (green or white) for a price increase.

Option Trading AmalysisTop Option Trading Indicators
-Relative Strength Index (RSI) The relative strength index (RSI) is one of the most commonly used indicators. ...
-Bollinger Bands. ...
-Intraday Momentum Index (IMI) ...
-Money Flow Index (MFI) ...
-Put-Call Ratio (PCR) Indicator. ...
-Open Interest (OI)

Candle sticks patternCandlestick patterns are technical trading tools that help traders predict price direction and market sentiment. They are based on past price movements and can help analysts identify shifts in supply and demand, which can aid in predicting trend reversals, continuations, and potential price levels.

Sideways Action Awaiting Liquidity Pullback Before Push to $3300Gold Price Strategy for the Week: Sideways Action Awaiting Liquidity Pullback Before Push to $3300 💰📈
Gold (XAU/USD) is currently moving sideways within a wide range of 30 price levels, from 3246 to 3216, and is showing hesitation at these levels. There is no clear indication yet if gold will continue to rise or if we’ll see a corrective phase to gather liquidity. Currently, indicators are showing that gold is overbought, and a strong pullback to gather liquidity could happen anytime. The buying pressure has decreased compared to last week, and FOMO seems to have faded, so we may watch for an entry point during the European session today. If gold fails to push higher, we could consider a potential sell entry.
Key Resistance: 3246 (ATH), 3255, 3268, 3285, 3302
Key Support: 3216, 3195, 3172, 3152, 3120
Buy Zone 📈: 3172 - 3170, SL: 3166, TP: 3176 - 3180 - 3184 - 3188 - 3192 - 3196 - 3200
Sell Zone 🔽: 3268 - 3270, SL: 3274, TP: 3264 - 3260 - 3256 - 3252 - 3248 - 3244 - 3240
Market Outlook:
This week, there are no major news events to focus on, so the strategy will primarily revolve around observing the market volume for clues on the next move. The key focus will be on the European and U.S. sessions to determine the market direction more clearly. With the current market volatility, it’s essential to stick to your TP/SL levels for risk management and to protect your account.
Important Reminder: Despite the lack of news, the market remains extremely unpredictable, and large price movements are likely. Always adhere to your TP/SL and manage your trades carefully. 🛡

Database Trading Analysis Part 3Advanced database trading analysis combines powerful database technologies with sophisticated data analysis techniques to gain deeper insights into financial markets and improve trading strategies. This involves using techniques like data mining, OLAP, predictive modeling, and machine learning to analyze large datasets and make informed predictions. The goal is to identify patterns, trends, and anomalies that can be used to make profitable trading decisions.

MACD Analysis Part-2Moving average convergence/divergence (MACD) is a technical indicator to help investors identify price trends, measure trend momentum, and identify entry points for buying or selling. Moving average convergence/divergence (MACD) is a trend-following momentum indicator that shows the relationship between two exponential moving averages (EMAs) of a security’s price. MACD was developed in the 1970s by Gerald Appel, and is one of the most popular technical tools, readily available on most trading platforms offered by online stock brokers.
