XAU/USD: Powell vs. The Discount ZoneHello, Traders! Let's dive deep into Gold (XAU/USD). The price is currently caught in a crucial tug-of-war: a hawkish US Federal Reserve (Fed) is strengthening the Dollar, while the political risk of a potential US government shutdown offers strong support to Gold. This is where the opportunity lies!
📰 Key Fundamental Drivers (Watch Closely):
The Fed & Powell's Stance: The likelihood of a US rate cut in December has decreased significantly. This signals a Hawkish view, which generally makes the USD stronger and places DOWNWARD pressure on Gold prices.
US Government Shutdown Risk: Concerns are rising that a prolonged government closure could harm the US economy. This economic uncertainty acts as a strong tailwind for Gold, as it is a premier safe-haven asset.
📉 Technical Analysis (The Chart View):
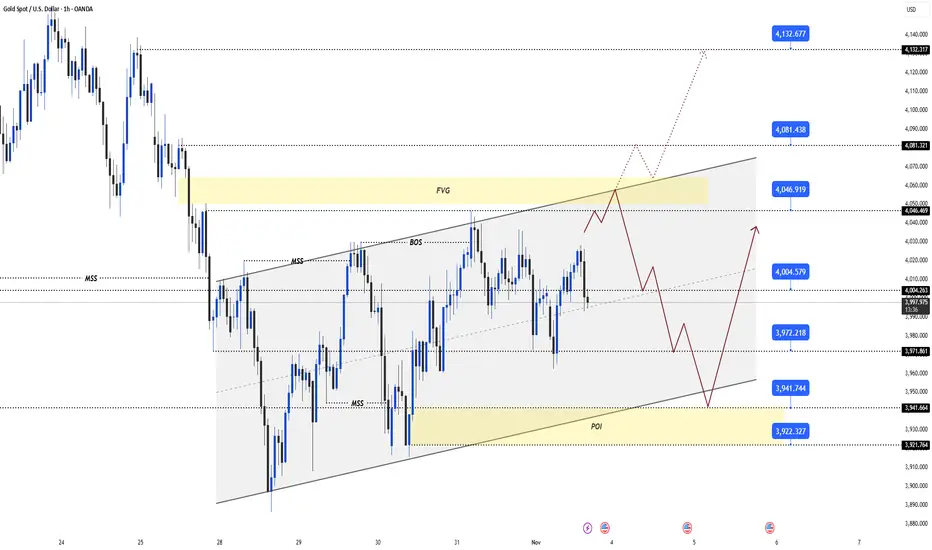
We observe XAU/USD moving within a Rising Wedge pattern (often a signal for a bearish reversal) and is now heading towards a critical price level we call the Strategic Support Zone.
🔥 Strategic Support Zone (The Discount Zone): $3,941 - $3,953. This is the key zone where patient buyers typically look to enter Buy (Long) trades, ensuring a favourable risk/reward profile.
Major Resistance Zone: $4,004 - $4,025.
🎯 Our Two-Sided Trading Strategy:
1. The Bullish Scenario (Long):
Action: Wait for the price to test and show a strong reversal signal (like a rejection candlestick) from the $3,941 - $3,953 support area.
Target: $4,004 - $4,025.
2. The Bearish Scenario (Short):
Action: SELL (SHORT) if the price is strongly rejected at the $4,004 - $4,025 resistance zone, OR if it decisively breaks and closes below $3,941.
Target: Below $3,900.
🚨 Important Note: We must closely monitor any further statements from FOMC members this week. They will dictate the short-term direction. Trade wisely and always use a Stop Loss!
#xauusd #forexindia #powell #fomc #technicalanalysis #gold #usd #indiaforex #tradingview #marketanalysis
Fundamental Analysis

GOLD – TRIANGLE COMPRESSION ON H4 ✨ GOLD – TRIANGLE COMPRESSION ON H4, AWAITING A STRONG BREAKOUT IN WAVE 5 ✨
💬 Gold is accumulating in a compression triangle – when silence lasts too long, the market is about to speak.
Hi everyone 💖, Kristina is back with today's perspective on gold. I hope this analysis will help you – whether you're a new trader or have been trading gold for years – gain a clearer view to prepare for the upcoming breakout.
📉 Technical Analysis:
Currently, gold is moving within a triangle pattern on the H4 frame, indicating that market energy is being compressed. When the price breaks out of this area, the movement range could reach several tens of points.
Important support zone: 3960–3980
Strong resistance zone: 4035–4045
👉 When the price breaks one of these zones, the trend will be clearly confirmed.
According to Elliott Wave, Kristina is observing two scenarios:
1️⃣ Long-term: Wave (5) could be a downward wave, heading towards 3820.
2️⃣ Medium-term: Wave (5) can still rise if the price holds the 4000 zone, targeting around 4110–4130.
💎 Trading zone according to ICT:
Order Block around 4040 is a potential supply zone – a reversal signal is likely to appear.
The area around 4000 is a notable support point – it can create a bounce reaction if the price retests.
🎯 Reference trading scenarios:
Sell around 4040 when there is a reversal signal, SL 10 points, TP 4020–4000.
Buy around 4000 after the price retests the OB, SL 10 points, TP 4110.
If the price breaks 3970, wait to Sell around 3980, SL 10 points, TP 3820.
🕊️ Currently, gold is in a waiting phase – observe, don't rush, to act with the trend when the market "speaks."
🌷 The analysis reflects Kristina's personal perspective, not an investment recommendation.
If you share the same viewpoint or have a different perspective, please leave a comment below 💬💕

Indian Energy ExchangeDate 04.11.2025
IEX
Timeframe : Weekly Chart
Note:
(1) Read the key notes mentioned in the chart
(2) Safe long entry only after breakout of consolidation
NEWS Update :
(1) CO ACHIEVES MONTHLY ELECTRICITY TRADED VOLUME OF 11,233 MU IN OCTOBER’25
AN INCREASE OF 16.5 % YOY
(2) ACHIEVES MONTHLY VOLUME OF 4,583 MU IN RTM, INCREASE OF 46.8% YOY
Caution:
(1) The primary negative news about the Indian Energy Exchange (IEX) in the market is the Central Electricity Regulatory Commission's (CERC) directive to implement "market coupling".
(2) This regulatory change is a significant structural risk for IEX because it threatens to end the company's near-monopoly and remove its primary competitive advantage: the ability to independently discover the most efficient electricity prices due to high liquidity.
Others:
(1) Company has a good return on equity (ROE) track record: 3 Years ROE 39.2%
(2) Stock is trading at 11.0 times its book value
(3) High operating profit margins: 84%
(4) The company is India’s premier electricity exchange with an 85% market share
Revenue Mix:
(1) Transaction Fees: 79%
(2) Admission and Annual Fees: 3%
(3) Other Income: 18%
Regards,
Ankur

DIACABS - Mutliple confirmation set upDiamond Power Infrastructure Limited (DIACABS) is trading near ₹154 in early November 2025. The stock shows mixed signals with a short-term sell signal but a longer-term buy signal, indicating some near-term caution within a general positive trend. Resistance is expected around ₹169.6, and support near ₹127.9. Technical indicators point to bullish momentum as the price is above 25-day and 50-day moving averages, although short-term volatility has caused some pullbacks.
Financially, DIACABS has a market cap of about ₹7,628 crore and recently showed impressive quarterly revenue growth of over 200%, though profit margins remain modest near 5.7%. The debt level is significant (₹2,355 crore) compared to its cash reserves, which raises risk concerns for risk-averse investors. The stock has delivered extraordinary long-term returns (+879% over five years), but recent performance has been volatile with notable quarterly earnings growth fluctuations.
Overall, DIACABS is a high-potential but higher-risk mid-cap stock showing bullish technical signals for short to medium-term trading, with resistance near ₹170 and downside risk if it falls below ₹128.

GOLD TRADING INSIGHTS TODAY WITH LUCYGOLD TRADING INSIGHTS TODAY WITH LUCY 💛
Hello everyone 🌸
The gold market (XAUUSD) today is showing many interesting signals as the price continues to test the crucial trendline area. Traders' sentiment is quite cautious at the moment – both buyers and sellers are “squaring off” around the liquidity balance zone.
🔍 Technical Analysis
On the chart, gold is moving within a narrowing triangle price channel – this indicates momentum is accumulating, and when the price breaks in either direction, the subsequent volatility will be very strong ⚡
Currently, the price is reacting around the main trendline, but there is no clear breakout signal yet.
In my personal view, the probability of a decline remains higher, however, further confirmation is needed before entering a trade.
The important point to note is the support area at 3965, which is the key boundary to confirm a clear downtrend.
If the price breaks through this area, the possibility of extending towards the Fibonacci 2.618 area around 3890 is entirely possible.
⚙️ Price Levels to Watch
Currently, the 3990 – 4012 area is short-term resistance, where sellers may reappear.
Meanwhile, the 3965 – 3945 – 3920 areas are the main supports that need close observation.
If the price continues to hold above 3945, the likelihood of a short-term rebound is quite high.
🎯 Today's Trading Scenario
💼 Buy: 3945
⛔ SL: 3938
🎯 TP: 3958 – 3977 – 3992 – 4012
💼 Sell: When the price clearly breaks below support 3965
⛔ SL: Above the breakout area
🎯 Expected TP: extending towards the Fibonacci 2.618 area around 3890
I still prefer to observe the price reaction at the trendline area, and only act when there is clear confirmation — because in a triangle pattern, the patient one will always be the winner 🌙
⚠️ Note & Conclusion
The above analysis reflects only Lucy's personal perspective, based on Trendline – Fibonacci – ICT factors 📊
This is not investment advice.
Please share your views on gold in the comments section 💬
And don't forget to follow Lucy for daily updates on insightful analyses —
where technical analysis merges with market emotions 💫🌸

USDJPY – Weekly Triangle Near a Big Decision !!The pair has been stuck inside a large weekly triangle formation, compressing price action after years of volatility. These types of structures usually lead to powerful breakouts, and the direction will depend on how the BoJ policy stance and the Fed’s rate cut cycle unfold.
Chart validation:
Price is coiling between lower highs and higher lows the classic look of a triangle consolidation.
Resistance sits around 162, with the upper bound of the triangle capping rallies.
Support near 137–138 has been holding the downside so far.
The breakout path points to two extremes:
Upside projection: A clean break could open a run towards 175–176.
Downside projection: A bearish resolution could drag it back to 127, the lower long-term support.
Key takeaway:
For now, USDJPY is neutral but building energy.
The next decisive move will be sparked by central bank divergence if the Fed cuts faster than the BoJ tightens, the yen could strengthen and break lower; if the BoJ holds back and the Fed stays cautious, the pair could rip higher.
We should wait for confirmation outside this triangle before positioning for the next trend. Trade safe !

Aarnav Fashion is a buy technical breakoutPrice volume suggests big buying in Aarnav with stock more than 10% up
Promotor increased stake in company.
Buy and hold for 30/40% more up move.

AUD/USD Long Setup – Buying the Pullback with Clear RiskPair: AUD/USD
Entry: 0.65335
Stop Loss: 0.65275
Take Profit: 0.65535
Risk–Reward Ratio: ≈ 1:3.3
This isn’t a signal — it’s a guide for structure-based entries with tight risk control.
Always wait for price action confirmation before jumping in 🚀

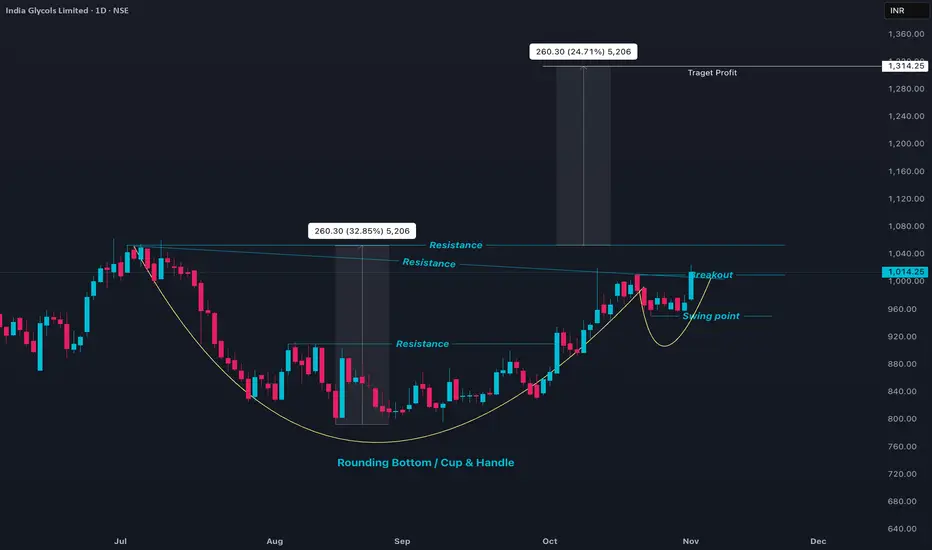
INDIAGLYCO - Cup & Handle PatternIndia Glycols (INDIAGLYCO) is currently trading around ₹1,014, showing significant strength with a recent 4.6% gain in the latest session. The stock has a 52-week high near ₹1,070 and a low near ₹503, indicating it is trading close to its annual high. The market capitalization is around ₹6,277 crore with solid average daily volume (~17,847 shares).
Valuation metrics indicate a P/E ratio of approximately 25.8, supported by strong earnings per share (EPS) of ₹39.35. The stock price is well above its 50-day (₹888) and 200-day (₹796) moving averages, showing strong short and long-term momentum. Volume trends reflect steady buying interest, confirming bullish sentiment.
Fundamentally, India Glycols has demonstrated robust financial performance with growth in revenue and profitability, making the current price attractive for medium to long-term investors. Technical indicators point to a continuation of the uptrend barring any major market corrections, with immediate support near ₹960 and resistance at ₹1,050–₹1,070.
Overall, India Glycols exhibits solid price momentum, healthy fundamentals, and strong trading volume, supporting its position as a structurally sound stock in the chemical and specialty chemicals sector.
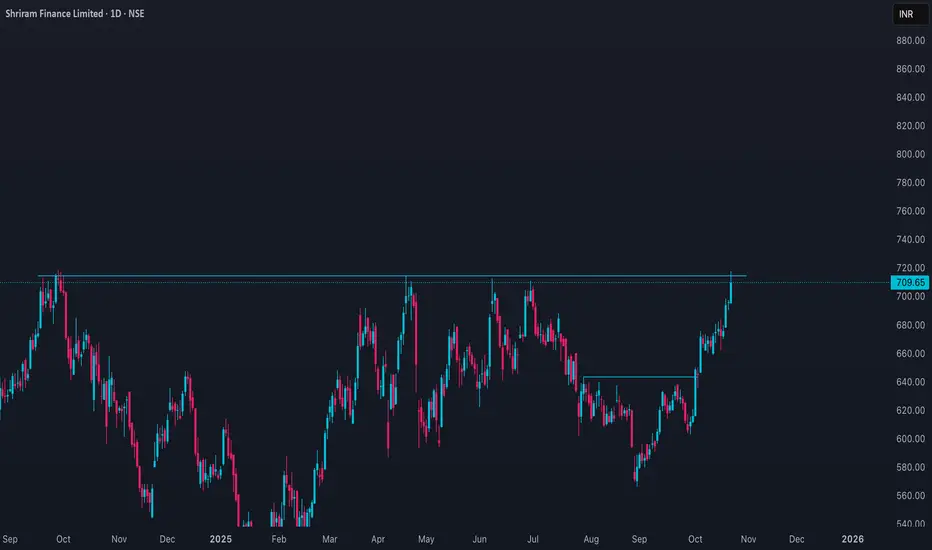
SHRIRAMFIN Price ActionAs of October 23, 2025, **Shriram Finance Ltd (NSE: SHRIRAMFIN)** closed approximately at **₹695.25**, showing sideways price action near its recent high. The stock traded within the range of ₹675 to ₹717.75 during the day, with a market capitalization of about **₹1.33 lakh crore**.
The company demonstrates sturdy financials with a trailing P/E ratio near **13.78**, an EPS of roughly **₹51.51**, and a book value of ₹278.52 per share, reflecting reasonable valuation metrics relative to the NBFC sector. Its dividend yield stands near **1.4%**.
From a technical perspective, Shriram Finance has been consolidating after strong rallies earlier this year. The stock holds key supports around ₹680–₹690 with resistance near ₹710–₹715. The Relative Strength Index (RSI) signals a neutral to mildly bullish momentum around 55–60, suggesting room for further upside while consolidating. A sustained rise above ₹715 could trigger renewed buying interest, targeting levels around ₹740–₹750. Conversely, a drop below ₹680 may signal short-term weakness.
Overall, Shriram Finance’s outlook remains **stable to bullish** supported by robust earnings, consistent operational performance, and attractive valuation compared to peers. Investors are advised to watch for volume confirmation on any breakout above resistance for momentum continuation.
BUY TODAY SELL TOMORROW for 5%DON’T HAVE TIME TO MANAGE YOUR TRADES?
- Take BTST trades at 3:25 pm every day
- Try to exit by taking 4-7% profit of each trade
- SL can also be maintained as closing below the low of the breakout candle
Now, why do I prefer BTST over swing trades? The primary reason is that I have observed that 90% of the stocks give most of the movement in just 1-2 days and the rest of the time they either consolidate or fall
Round Bottom Breakout in HLEGLAS
BUY TODAY SELL TOMORROW for 5%

TFCILTD Price pyramid set upAs of October 23, 2025, **Tourism Finance Corporation of India Ltd (TFCILTD)** closed around **₹71.20**, slipping nearly **3%** for the day after hitting an intraday high of **₹73.60** and a low near **₹69.40**. The stock has shown strong appreciation this year, gaining over **150%** in the past twelve months, but has entered a short-term consolidation phase following its recent high of ₹75.90.
The current **market capitalization** stands near **₹3,400 crore**, placing it in the small-cap segment. Its **P/E ratio** is about **7.5x**, with a **P/B ratio of 0.69**, indicating that the stock remains undervalued relative to its sector peers. Earnings per share (EPS) are approximately ₹9.46, and the **dividend yield** is around **0.8%**.
Technically, the stock is in a corrective phase after a strong rally since June 2025. It is trading around its 20-day moving average, which acts as immediate support near **₹70–₹71**, while resistance lies around **₹74–₹75**. The **RSI** has moderated toward neutral zones, and momentum indicators signal a pause in the uptrend. If the price holds above ₹70, it may consolidate before attempting another breakout; a decline below ₹69 could indicate short-term weakness toward ₹66–₹67.
The medium- to long-term outlook remains constructive given strong profitability, low valuations, and improving financials, though near-term traders may experience volatility as the stock digests recent gains.

Raghav Productivity Enhancers Ltd | Weekly VCP Breakout | Moment🏭 Company Overview
Raghav Productivity Enhancers Ltd (NSE: RPEL) is India’s leading producer of silica ramming mass, a key refractory material used in steel manufacturing furnaces. The company operates modern facilities with global quality standards, catering to both domestic and international steel producers.
Fundamental Keys
Company's market cap ₹35,887 Cr
PE Ratio : High Valuation (78.90)
Price to sales: >15.75
ROE: >30% Excellent
ROA: >26% Good
Net Profit Margin: >19% Good
Operating Margin: >45% Good
EBITDA Margin: >28% Good
Debt-to-Equity: 0.0279 (debt-free profile)
Quick Ratio: 3.67
Cash Ratio: 0 (working capital tightness)
Debt to EBITDA: 0.098 Good
Annual sales have increased for 3 consecutive years.
Quarterly revenue trending upward for 5 years.
Strong balance sheet with growing total assets and minimal debt.
Financially robust with excellent profitability and asset efficiency.
Valuations are stretched, but strong earnings momentum supports short- to medium-term bullish sentiment.
Technical Analysis (Weekly + Daily)
Stock formed a perfect VCP (Volatility Contraction Pattern). A series of tightening swings leading to a breakout with a massive green candle.
Breakout candle closed near high - shows conviction buying.
Volume expansion on breakout confirms institutional participation.
Price now comfortably trades above key resistance zone (~₹740) flipping previous resistance into new support. All moving averages aligned bullishly with expanding volume signaling a high-probability breakout continuation.
Price trades above 9, 20, and 50 EMA - bullish alignment. ADX is showing healthy trend strength. RSI mildly overbought, typical for breakout continuation. MACD confirmed strong bullish crossover. Weekly volume surged to ~995K, 3× above average clear sign of institutional activity. Daily volume >615K confirms multi-timeframe buying interest.
Swing Trade Plan : For 1-3 weeks
Breakout Aggressive Entry: ₹795–805 On (close above breakout high)
Retest Entry: ₹740–760 (On low-volume retest of breakout zone)
Stop-Loss ₹650 Below 50 EMA / prior base
Target 1: ₹850–880 (First resistance zone)
Target 2: ₹950–1,000 )Measured flag projection)
Trailing Strategy:
Move SL to ₹740 after T1 achieved.
Trail below 9 EMA (daily) as price trends higher.
Exit if weekly candle closes below 20 EMA with volume expansion.
⚠️ Disclaimer
This analysis is for educational and research purposes only. It is not financial advice. Always conduct your own due diligence and use proper risk management.

ULTRACEMCO Price ActionUltraTech Cement (ULTRACEMCO) is trading around ₹11,940 to ₹11,950 as of the latest session, after seeing consolidation from its recent all-time high of ₹13,097 set in September 2025. The stock has declined about 1.5% this month and is down around 2.5% over three months, but it remains up by 7–8% over the last year. Price volatility has been low, with average weekly swings of only about 2%—well below sector averages—indicating chart stability for large-cap traders.
The recent quarterly results show revenue of approximately ₹817 billion and a net profit margin close to 9%, but the latest net profit dropped about 44% quarter-on-quarter to ₹12.3 billion, despite revenues still beating estimates. The trailing twelve months (TTM) P/E ratio is about 48, and the book value per share stands at roughly ₹2,400. Delivery volume remains healthy at close to 70%. Promoter holdings are stable at 59.23%. Yield is modest at 0.65%, reflecting the company’s low dividend payout compared to growth retention. Analyst sentiment is mixed to mildly positive, and consensus targets range widely (₹7,600–15,670).
Technically, the stock is currently 8% below its 52-week high. Long-term trend strength remains intact, though further correction is possible if broader sector weakness persists. Price action suggests accumulation near ₹11,900 could see support, while major resistance is up near recent highs.

Websol - Next leg of growthWith the company commercializing its new cell line last month..the future of the company is bright..We still have more demand than supply of cells so atleast for a few quarters the co should do extremely well.
The results this quarter might be muted coz production was stopped for a couple weeks to integrate the new line.
Technically the price is trying to cross back above the 200EMA after a long time. It is also trying to breakout of the downward sloping trendline.
Long as long as it sustains above 200EMA and add more above 1300 if everything mentioned above works out in our favour.
Stoploss below 200EMA for traders and 1175 for investors.

GOLD (XAU/USD): ISM DHAMAKA Awaited! Ready for the Big Move, BosI. MACRO KA SCENE (Current Situation):
Mind you, Gold is in a TIGHT SPOT, caught between two heavy-duty forces:
⬆️ BULL CASE (Buy Power): Safe-Haven demand is on because of US Political TENSION (shutdown issues) and global uncertainty (like that Nvidia chip drama). Good for paisa up.
⬇️ BEAR CASE (Sell Power): USD is showing STRENGTH! Hawkish Fed guys are pushing rate cut hopes away, which is putting pressure on our Gold.
🔥 MAIN GAME-CHANGER: The US ISM Manufacturing PMI tonight. This data is the main trigger for the next BIG move. Wait and watch, folks!
II. APNA TRADING PLAN (Actionable Zones):
We are sticking to two high-probability zones. Remember: Only trade after proper Price Action Confirmation! No JUMPING.
🔴 SELL SCENARIO
SELL ZONE (Supply/FVG): $4,050 - $4,055
Reason: We're hunting a SOLID rejection where the Smart Money (Bade Khiladi) is waiting to sell off.
SL (Stop Loss): $4,065
TP Targets (Book Profit): $4,045 - $4,035 - $4,025 - $4,015
🟢 BUY SCENARIO
BUY ZONE (POI/Demand): $3,952 - $3,948
Reason: Looking for the market to find STRONG support here and give a sharp bounce.
SL (Stop Loss): $3,940
TP Targets (Book Profit): $3,958 - $3,968 - $3,978 - $3,988
🚨 FINAL WORD (Very Important, Yaar!):
Risk Management is the ultimate key. Boss, wait for a CLEAR Price Action Confirmation in these zones. NO gambling on the news release.
#XAUUSD #Gold #ISM #PriceAction #TradingIndia #ForexIndia #IndianTrader #SmartMoneyConcept #USD #SafeHaven #Paisa
Trading Secrets in the Indian Market1. Understanding the Indian Market Dynamics
The first secret to successful trading in India is understanding the unique nature of its markets. The National Stock Exchange (NSE) and the Bombay Stock Exchange (BSE) dominate equity trading, while commodity and currency markets are handled by exchanges like the Multi Commodity Exchange (MCX) and NSE Currency Derivatives.
India’s markets are driven by a mix of domestic and foreign institutional investors (FIIs), retail investors, and algorithmic traders. Each group behaves differently, creating distinct patterns of price movement. For example, FIIs are often influenced by global macroeconomic trends, while retail investors react to domestic news and momentum. Recognizing which group is driving the market at any given moment helps traders align with the prevailing force rather than fight it.
2. Timing is Everything
In Indian trading, timing plays a crucial role. Unlike Western markets, Indian markets operate from 9:15 AM to 3:30 PM, with distinct phases:
Opening volatility (9:15–9:45 AM): News adjustments and overnight developments cause sharp movements.
Mid-session stability (11 AM–2 PM): Institutional participation increases, offering trend clarity.
Closing action (2:45–3:30 PM): Day traders square off positions, and short-term volatility often spikes.
Smart traders avoid jumping in at the opening frenzy unless they’re skilled scalpers. Instead, they wait for confirmation of trends in mid-session before entering trades. Many successful traders also track pre-open market data and FII-DII activity reports to anticipate the day’s direction.
3. The Secret of Volume Analysis
Volume is the footprint of smart money. In India, large institutions often accumulate or distribute shares quietly before big moves. Monitoring unusual volume spikes in less popular stocks can reveal where institutional money is flowing. Tools like the Volume Weighted Average Price (VWAP) and On-Balance Volume (OBV) help traders identify genuine accumulation versus false breakouts.
For example, if a mid-cap stock consistently trades with increasing volume and stable prices, it often signals stealth buying. Conversely, sudden volume surges after a long rally might indicate distribution — a cue for traders to be cautious.
4. News and Event Trading
The Indian market is highly news-sensitive. Announcements such as RBI policy decisions, GDP releases, corporate earnings, or even political events can cause dramatic swings. Experienced traders prepare in advance by maintaining an economic calendar and building strategies around volatility events.
For instance:
Before budget sessions, traders often position themselves in infrastructure and PSU stocks.
Before RBI rate announcements, banking and NBFC stocks are watched closely.
During election periods, volatility surges across indices, creating short-term trading opportunities.
A key secret is not to chase prices after the news breaks but to anticipate how the news will impact sentiment and position early with proper stop-losses.
5. The Role of Technical Analysis
While fundamental analysis explains why a stock should move, technical analysis shows when it will move. In India, many traders rely on technical tools like moving averages, RSI (Relative Strength Index), MACD (Moving Average Convergence Divergence), and Bollinger Bands.
However, the secret lies not in using too many indicators but in mastering a few. Seasoned traders combine price action with volume, trendlines, and support-resistance zones to create high-probability setups. The Indian market often respects round numbers and psychological levels — for example, Nifty 20,000 or Bank Nifty 45,000 — as traders set key positions there.
6. Institutional and FII Tracking
Foreign Institutional Investors (FIIs) play a massive role in market trends. When FIIs buy heavily, the market tends to rally; when they sell, corrections follow. Daily FII-DII data published by the NSE can reveal institutional sentiment.
The secret? Don’t react to one-day flows. Look for multi-day patterns. If FIIs have been net buyers for several sessions, it usually signals a bullish undertone. Retail traders can ride these institutional waves instead of betting against them.
7. Risk Management — The Hidden Power
No trading secret is more powerful than risk control. Even the best analysis fails without discipline. The Indian market, with its high intraday volatility, can wipe out profits quickly if traders neglect stop-losses.
Professional traders follow the 2% rule — never risk more than 2% of total capital on a single trade. They also use trailing stops to lock in profits as the market moves in their favor. Furthermore, diversification across sectors — IT, banking, energy, and FMCG — helps manage risk exposure during sector rotations.
8. Behavioral and Psychological Edge
Trading success in India is as much about psychology as analysis. The market thrives on fear and greed — both of which trap retail traders. The secret is to cultivate emotional discipline:
Don’t chase momentum after large moves.
Don’t panic sell during temporary dips.
Accept losses gracefully and learn from them.
Smart traders treat trading like a business — with records, reviews, and strategy adjustments. Maintaining a trading journal helps identify emotional biases and recurring mistakes.
9. Using Derivatives and Options Smartly
The derivatives segment — especially options trading — has exploded in India. Yet most retail traders lose money because they speculate without understanding volatility and time decay.
The secret is to use derivatives for hedging and strategic advantage. For example:
Buying calls on strong stocks before earnings.
Selling options in range-bound markets to earn premium decay.
Using spreads to limit risk while maintaining directional exposure.
Experienced traders track open interest (OI) data on NSE to gauge market sentiment. Rising OI with price increases signals bullish positions; falling OI indicates unwinding.
10. Learning from Market Leaders and Technology
The final secret is continuous learning and adaptation. India’s trading ecosystem evolves rapidly — with algo trading, smart order routing, and artificial intelligence now influencing prices. Staying updated with market trends, following top investors, and learning from their strategies gives traders a competitive edge.
Platforms like Zerodha Varsity, TradingView, and NSE Smart Trader offer resources to refine trading skills. Moreover, using algorithmic backtesting tools can help validate strategies before risking real capital.
Conclusion: Mastering the Indian Trading Arena
The Indian market offers immense opportunity — from booming IPOs to active derivatives and commodity trading. However, success isn’t about having inside information; it’s about mastering market behavior, timing, discipline, and strategy.
To summarize the secrets:
Study market dynamics and participant behavior.
Perfect your timing based on market phases.
Use volume to detect smart money.
Trade news with preparation, not emotion.
Keep technical analysis simple but effective.
Follow FII-DII data for institutional direction.
Protect your capital through strict risk management.
Develop emotional discipline and patience.
Use derivatives wisely for hedging and leverage.
Keep learning and adapt to technological advances.
Trading in the Indian market isn’t just about buying low and selling high — it’s about understanding why, when, and how prices move. Those who combine knowledge, discipline, and adaptability turn the market’s volatility into opportunity.
In the end, the greatest trading secret is simple: Consistency beats intensity. Small, disciplined wins every day compound into long-term success in India’s dynamic financial markets.

LiamTrading - $XAUUSD$: Second Scenario – BUY UP Priority ...LiamTrading - OANDA:XAUUSD $: Second Scenario – BUY UP Priority After BREAKING RESISTANCE $4002$
With the Support of the US Treasury Secretary
Hello traders community, LiamTrading is back with detailed OANDA:XAUUSD $ analysis for the start of the week!
The Gold market is receiving strong support from policy: US Treasury Secretary Scott Bessent calls on the Fed to continue cutting interest rates as the PCE inflation is currently at $2.7\%$.
This call, aimed at reducing mortgage rates and supporting the housing market, strengthens the long-term outlook for Gold.
Technical Analysis: We prioritize continuing to buy up following the main trend. The best strategy is to enter orders at strong resistance/support zones to ensure the lowest risk.
📰 MACRO FUNDAMENTALS: CALL FOR RATE CUT
Impact: The Treasury Secretary's statement on cutting interest rates to support the "transitioning" economy increases expectations of policy easing, which is a strong support factor for Gold (although not yet an official decision).
Suitable Strategy: Market sentiment is being driven by expectations of easing policy, reinforcing the priority for a BUY (Long) position.
📊 TECHNICAL ANALYSIS: IMPORTANT PIVOT POINT
Resistance Zone $4002$: This area acts as an important pivot point.
Buy Entry will be triggered after the price breaks resistance $4002$ and retests.
Sell Entry: Look for short-term scalping at the resistance zone $4030$ to secure profits. Highlighted Zone: Prioritize entering orders at confirmed Trendline zones.
🎯 DETAILED TRADING PLAN (ACTION PLAN)
We will wait for Gold to break structure and create a BUY setup.
🟢 Main BUY Scenario (BUY Break & Retest)
Logic: Buy at $4002$ after breaking resistance and retesting, leveraging new upward momentum.
Entry (BUY): $4002$
SL: $3995$ (tight SL)
TP1/TP2: $4020$ | $4035$
TP3: $4070$
🔴 SELL Scalping Scenario
Logic: Short-term scalping at the strong resistance zone $4030$ (near Sell Liquidity zone).
Entry (SELL): $4030$
SL: $4038$
TP1/TP2: $4015$ | $4004$
TP3: $3990$
📌 SUMMARY & DISCIPLINE (Liam's Note)
Our BUY strategy is reinforced by policy outlook and technical break at $4002$. Strictly adhere to SL $3995$ to manage risk before the upward structure is confirmed.
Are you ready for Gold's movement at $4002$? Please LIKE and COMMENT!

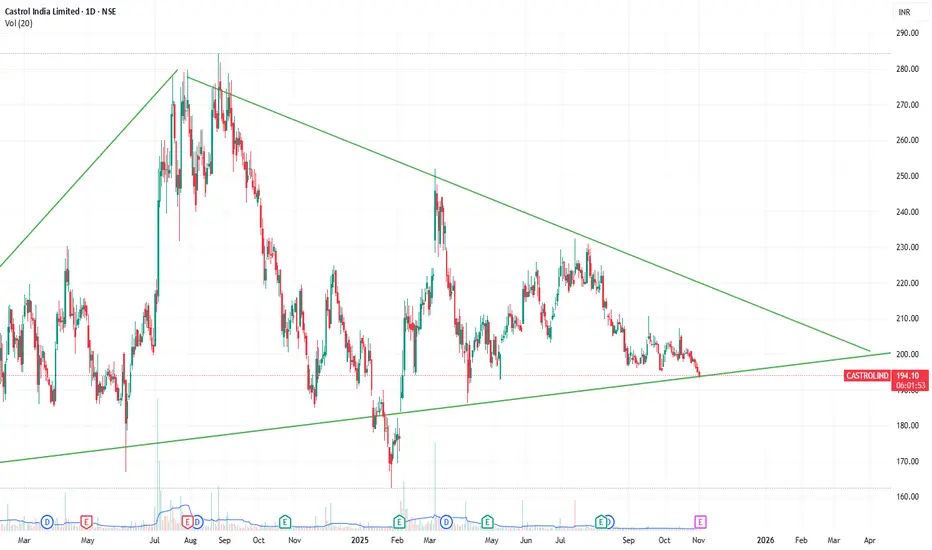
Study and Bullish on Result Tomorrow | Castrol India Ltd Castrol India is showing an interesting setup both fundamentally and technically ahead of its upcoming quarterly results on 4th November 2025.
🔹 Fundamental View:
The company has maintained strong performance over recent quarters —
Net Sales steadily growing from ₹1,293 Cr (Mar 2023) to ₹1,496 Cr (Jun 2025).
EBITDA and PAT margins holding firm around 22–23% and 16%, respectively.
Very low debt levels with negligible interest costs.
Overall, Castrol continues to deliver stable profitability and cash flows, a positive sign for long-term investors.
🔹 Technical View:
The stock is currently trading near a strong trendline support zone around ₹190–195, forming a large symmetrical triangle since early 2024.
Support: ₹190
Resistance: ₹210–225
Pattern: Symmetrical triangle tightening towards breakout zone
RSI near neutral–oversold zone (suggesting possible reversal)
🔹 My View:
The setup looks attractive for a potential bounce or breakout if the results come strong.
If ₹190 holds, we can expect a short-term move towards ₹210–₹230, and possibly ₹250+ on breakout confirmation.
Stop loss: ₹185
Conclusion:
Studying this setup closely — both fundamentals and technicals indicate strength.
I’m bullish on Castrol India for a result-based momentum move.
Let’s watch how the stock reacts post-results.
📝 Note:
This analysis is shared purely for educational and study purposes, not as financial advice.
Always do your own research or consult a qualified advisor before making any investment decisions.
LiamTrading - $XAUUSD$: NEW WEEK TRADING SCENARIO...LiamTrading - OANDA:XAUUSD $: NEW WEEK TRADING SCENARIO – PRIORITISE SELLING After BREAKING THE TRENDLINE
Hello traders community,
The new week opens with a clear strategy: Prioritise SELLING after Gold has broken the previous upward trendline.
Although fundamental economic news (like interest rate policies and politics) supports Gold potentially reaching the $5,000$ USD mark, we must trade according to the current Price Action. The technical selling pressure is strong. We will SELL at key resistance zones and continue SELLING as the price breaks the downward structure.
📰 FUNDAMENTALS & LONG-TERM OUTLOOK
$5,000$ Prospect: Fundamental and political factors continue to support the scenario of Gold reaching $5,000$ USD in the long term (due to geopolitical risks and potential loss of Fed independence).
Short Term 🔴: Gold is under technical selling pressure after breaking through the $4,000$ USD mark.
📊 TECHNICAL ANALYSIS: TRENDLINE BREAK
Structure: Gold has exited the upward price channel and is retesting the broken trendline.
Priority: SELL at the retest resistance zone $4024$.
🎯 DETAILED TRADING PLAN (ACTION PLAN)
🔴 SELL Scenario (SELL Primary) - Preemptive Resistance
Entry 1: $4024$ (Sell retest trendline zone)
SL: $4032$
TP1/TP2: $4012$ | $4000$
TP3: $3989$
Entry 2 (Continuation SELL): When price breaks the next trendline at $3992$
SL: $4000$
TP: $3940$
🟢 BUY Scenario (BUY Reversal) - Buy at Strong Support
Logic: Only buy when price hits strong liquidity support, potential for a short-term rebound.
Entry (BUY): Around $3960$ (Buy Scalping Zone)
SL: $3954$
TP1/TP2: $3972$ | $3988 FWB:TP3 : $4000$
📌 SUMMARY & DISCIPLINE (Liam's Note) Don't let the $5,000$ USD prospect affect short-term risk management. Trade according to Price Action. Adhere to SL and prioritise SELL positions at resistance zones.
Are you ready for the SELL strategy at the start of this week?

Netweb Technologies – Riding India’s AI BoomNetweb Technologies just posted another solid quarter — Q2 FY26 profit rose 19.8% YoY to ₹31.4 crore , and revenue climbed 20.9% to ₹303.7 crore .
The company also announced two large AI-infrastructure orders worth ₹2,184 crore , to be executed by FY27 — projects of national importance aimed at strengthening India’s AI compute backbone.
Founded in 1999, Netweb has evolved into one of India’s top high-end computing OEMs , providing full-stack server, storage, and AI-cloud solutions.
With a market capitalization of around ₹229 billion , a P/E near 179 , and promoters holding 70.75% , it’s clearly positioned as a premium play on India’s emerging tech hardware scene.
Riding the Global AI Wave
As the world races to build computing power for artificial intelligence, Netweb is positioned right where the action is.
Its expertise in AI-focused data centers and HPC systems fits seamlessly into India’s push for a “Sovereign AI” framework.
Those fresh strategic orders aren’t just business wins — they mark India’s deeper entry into the global AI supply chain.
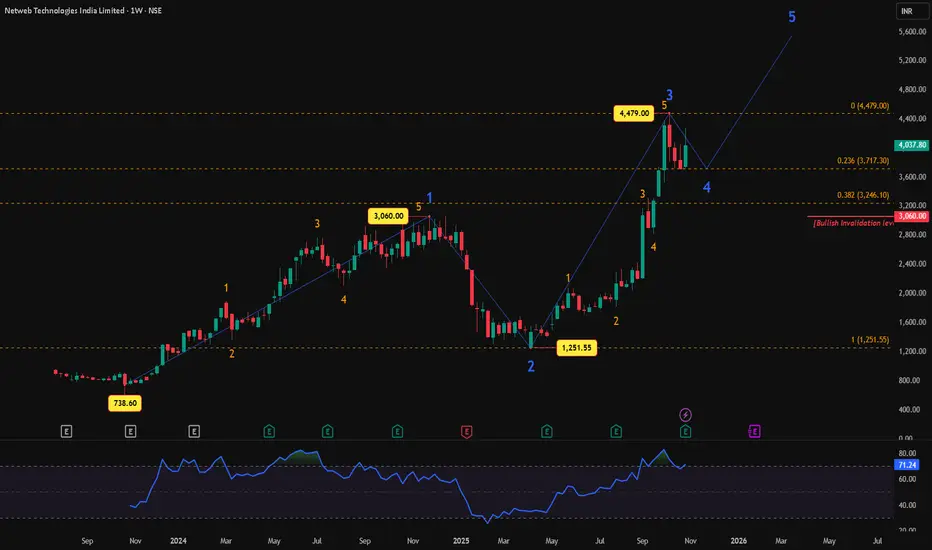
Technical Picture – A Textbook Impulse
The weekly chart unfolds into a clean five-wave impulse in progress — with Waves 1 through 3 already complete, topping near ₹4,479 . The stock now appears to be tracing Wave 4, a corrective phase before the final Wave 5 advance resumes.
The bullish invalidation sits at ₹3,060 — a dip below this level would question the ongoing impulse count.
If the structure holds, Wave 5 could propel prices toward the ₹5,300–₹5,600 zone, extending the uptrend that began in late 2023.
Quick Financial Snapshot
FY25 revenue : ₹11.43B (+58% YoY)
Debt : Only ₹10.25M – practically debt-free
Free cash flow : Negative ₹295M (signs of growth investment)
Strong growth, lean balance sheet, but a bit of cash burn — classic expansion mode behavior.
Final Take
Netweb’s chart and fundamentals tell the same story — a brief pit stop before the next sprint.
While valuations look steep, the structural and thematic tailwinds remain powerful.
Sustain above ₹3,060 , and the bigger Wave 5 rally could well coincide with India’s AI infrastructure boom .
Disclaimer:
This analysis is for educational purposes only and does not constitute investment advice. Please do your own research (DYOR) before making any trading decisions.
psu banks#pnb #indianbank - on W scale. they both are showing signs of bullish trend.
with strong closing and still in the zone, i am expecting more moves to come starting next week.

GOLD: US Fed is Not Giving Up! Big Selling Zone is Activated.Hello, Traders! It's a crucial time, yaar! Gold is at a major crossroads. The pressure from the US Fed is real, and it’s lining up perfectly with our key price levels. Let’s do a quick scan of the market.
I. FUNDAMENTALS: The Big Boss (The Fed) is Hawkish 📰
Main Reason for Bears: The US Fed officials are not interested in rate cuts for now. They are very much "hawkish" due to inflation concerns. This has crushed market optimism.
The Direct Impact: Higher US interest rates mean the Dollar is strong and mighty. For a non-yielding asset like Gold, this is a major negative signal.
Long-Term View (The Hope): Don't lose heart completely! Big institutions still see Gold climbing (like Morgan Stanley projecting $4,300/oz by 2026). So, current dips are good for long-term accumulation.
II. TECHNICAL ANALYSIS: The Supply-Demand Game 🎯
The H4 chart is showing a confirmed DOWNTREND. The recent small rally is just a necessary pullback to test the sellers' power before the next big drop.
1. Primary Strategy: GO SHORT (Following the Main Trend)
The Hot Selling Zone: $4,059 to $4,085. This is our Supply Area where the institutional players are likely waiting. This level is key.
Action Plan: Wait for Gold to enter $4,059 - $4,085. Look for a solid rejection (a strong reversal candle) to confirm your SHORT entry.
Final Target (TP): Our main target is the Strong Demand Zone at $3,939 - $3,952.
2. Counter-Trend Strategy: The Bounce Level
Crucial Buying Zone: $3,939 - $3,952. This is a major support level.
Action Plan: If the price really drops here, you can watch for a quick long entry for a bounce, but maintain tight stop-loss.
🔑 Final Verdict
Best Bet: We must look for a SELL near the $4,059 - $4,085 Supply Zone. Everything is lining up for a continued downside move. Risk management is paramount, okay?
What's your plan for Gold? Will the market respect the $4,085 level? Tell me in the comments! 👇
#XAUUSD #GOLD #FED #TechnicalAnalysis #ForexTrading #SupplyAndDemand #Bearish #TradingStrategy #IndianTrader #MarketAnalysis
