Crompton Greaves Consumer ElectricalsDate 02.10.2025
Crompton Greaves
Timeframe : Weekly Chart
About
(1) One of the leading consumer companies in India with 75+ years old brand legacy
(2) It is an independent company under professional management
(3) And have 2 business segments – Lighting and Electrical Consumer Durables
Revenue Breakup
(1) Electrical Consumer Durables: 76%
(2) Lightning Products: 12%
(3) Butterfly: 12%
Product Portfolio
(1) Fans
(2) Pumps
(3) Appliances
(4) Lighting
Market Share
(1) Fans 26%
(2) Lighting 8%
(3) Residential Pumps 27%
Crompton + Butterfly amalgamation
(1) merged Butterfly Gandhimathi Appliances Limited
(2) Butterfly is a leading brand from South India
(3) Crompton acquired a 55% stake
(4) Butterfly top 3 in core categories of mixers, cookers,
stoves in South India.
Valuations
(1) Market Cap ₹ 18,873 Cr
(2) Stock P/E 35.8
(3) ROCE 19.0 %
(4) ROE 17.4 %
(5) OPM 11%
(7) Profit Growth 11% (TTM)
Regards,
Ankur Singh
Fundamental Analysis

Bonds and Fixed-Income Trading Strategies1. Introduction to Bonds and Fixed Income
1.1 What Are Bonds?
A bond is a debt security, essentially a loan made by an investor to a borrower (typically a government, corporation, or financial institution). The borrower promises to pay periodic interest (coupon payments) and to return the principal (face value) at maturity. Bonds are considered fixed-income securities because they generally provide predictable returns over time.
Key components of a bond:
Face Value (Par Value): Amount repaid at maturity.
Coupon Rate: Annual interest percentage based on face value.
Maturity Date: When the principal is repaid.
Issuer: Entity borrowing the funds.
1.2 Importance of Bonds
Bonds serve several key functions:
Income Generation: Provide stable cash flows through coupons.
Portfolio Diversification: Lower correlation with equities reduces portfolio volatility.
Capital Preservation: Generally lower risk than stocks, especially government bonds.
Market Signaling: Bond yields reflect interest rate expectations and economic conditions.
2. Types of Bonds
Understanding the types of bonds is foundational for trading strategies:
2.1 Government Bonds
Issued by national governments; considered low risk.
Examples: U.S. Treasuries, Indian Government Securities (G-Secs).
Typically used for safe-haven investing.
2.2 Corporate Bonds
Issued by companies to raise capital.
Higher yields than government bonds due to default risk.
Categories:
Investment Grade: Lower default risk, moderate yields.
High Yield (Junk Bonds): Higher default risk, high yields.
2.3 Municipal Bonds
Issued by local governments or municipalities.
Often tax-exempt in certain jurisdictions.
Attractive for investors seeking tax-efficient income.
2.4 Convertible Bonds
Can be converted into equity shares of the issuing company.
Hybrid instrument combining bond-like stability and equity upside.
2.5 Zero-Coupon Bonds
Pay no periodic interest; sold at a discount.
Investor gains from capital appreciation at maturity.
2.6 Inflation-Linked Bonds
Principal and/or interest payments adjust with inflation.
Examples: U.S. TIPS, India’s Inflation Indexed Bonds.
Useful for hedging against inflation risk.
3. Bond Trading Strategies
Trading bonds requires understanding market cycles, interest rate movements, and credit risks. Strategies can be broadly categorized as:
3.1 Buy and Hold Strategy
Objective: Earn coupon income and principal at maturity.
Best For: Conservative investors and retirees.
Pros: Stability, predictable returns.
Cons: Limited capital gains; sensitive to inflation.
3.2 Active Trading Strategies
3.2.1 Interest Rate Anticipation
Goal: Profit from expected changes in interest rates.
Method: Buy long-duration bonds if rates are expected to fall; sell if rates are expected to rise.
Example: U.S. Treasury futures or Indian G-Secs.
3.2.2 Bond Laddering
Goal: Reduce reinvestment risk and smooth cash flows.
Method: Invest in bonds with staggered maturities.
Benefits: Steady income, flexibility to reinvest at different rates.
3.2.3 Barbell Strategy
Goal: Balance risk and return by investing in short- and long-term bonds.
Method: Avoid intermediate-term bonds.
Pros: High liquidity from short-term bonds, high yields from long-term bonds.
Use Case: Uncertain interest rate environment.
3.2.4 Bullet Strategy
Goal: Concentrate maturities around a specific date to fund known obligations.
Method: Buy bonds maturing around the same period.
Best For: Funding a major expense (e.g., pension payouts, debt obligations).
3.2.5 Credit Spread Trading
Goal: Exploit differences in yields between bonds of varying credit quality.
Method: Buy undervalued bonds or short overvalued bonds.
Caution: Requires strong credit analysis skills.
3.2.6 Yield Curve Strategies
Steepener: Buy long-term bonds, sell short-term bonds if yield curve is expected to steepen.
Flattener: Sell long-term bonds, buy short-term bonds if yield curve is expected to flatten.
Objective: Profit from changes in shape of yield curve, not absolute rates.
3.3 Arbitrage Strategies
Convertible Bond Arbitrage: Exploit mispricing between a convertible bond and its underlying equity.
Treasury Arbitrage: Use derivatives or bond futures to profit from small yield differences across maturities or markets.
4. Fixed-Income Derivatives in Bond Trading
Derivatives enhance bond trading flexibility:
4.1 Futures
Standardized contracts to buy/sell bonds at a future date.
Useful for hedging or speculating on interest rates.
4.2 Options
Call Options: Right to buy a bond at a strike price.
Put Options: Right to sell a bond.
Can hedge against price volatility or take directional bets.
4.3 Swaps
Interest Rate Swap: Exchange fixed for floating interest payments.
Credit Default Swap (CDS): Insurance against default risk.
Widely used by institutional traders to manage risk and leverage positions.
5. Risk Management in Fixed-Income Trading
Trading bonds is not risk-free. Key risks include:
5.1 Interest Rate Risk
Bond prices fall when interest rates rise.
Mitigation: Duration management, interest rate derivatives.
5.2 Credit Risk
Risk of issuer default.
Mitigation: Diversification, credit analysis, CDS.
5.3 Reinvestment Risk
Coupons may be reinvested at lower rates.
Mitigation: Laddering strategy.
5.4 Liquidity Risk
Some bonds, especially corporate and municipal, may be illiquid.
Mitigation: Focus on high-volume instruments or use ETFs.
6.5 Inflation Risk
Erodes real returns of fixed-income instruments.
Mitigation: Inflation-linked bonds, shorter maturities.
6. Technical and Fundamental Analysis for Bond Trading
6.1 Fundamental Analysis
Economic indicators: Inflation, GDP growth, employment, central bank policies.
Credit fundamentals: Debt-to-equity ratios, cash flows, corporate earnings.
Central bank actions and fiscal policy directly impact interest rates and yields.
6.2 Technical Analysis
Price patterns, volume trends, and yield charts.
Common tools: Moving averages, trendlines, RSI, support/resistance for bond ETFs and futures.
7. Global and Indian Bond Market Dynamics
7.1 Global Factors
U.S. Treasury yields set benchmark for global rates.
Geopolitical risk, monetary policies, and inflation expectations drive bond flows.
7.2 Indian Bond Market
Key instruments: Government securities (G-Secs), State Development Loans (SDLs), corporate bonds.
RBI’s monetary policy, inflation trends, and credit growth impact yields.
Indian bond market liquidity is improving, but corporate bonds can be thinly traded.
8. Advanced Trading Considerations
8.1 Algorithmic and Quantitative Trading
High-frequency trading in government bonds.
Arbitrage strategies using yield curve mispricings.
8.2 Portfolio Optimization
Combining bonds of different durations and credit qualities.
Risk-adjusted returns measured using metrics like Sharpe ratio.
8.3 Regulatory and Tax Considerations
Compliance with SEBI, RBI, and international regulations.
Tax efficiency plays a role in bond selection (e.g., municipal bonds in the U.S., tax-free bonds in India).
Conclusion
Bond and fixed-income trading requires a balance of knowledge, patience, and strategy. While bonds are traditionally seen as conservative instruments, sophisticated trading strategies—from interest rate anticipation and yield curve trades to credit spread plays—allow traders to capitalize on market inefficiencies. Understanding bond fundamentals, market dynamics, derivatives, and risk management principles is essential to crafting a successful fixed-income portfolio.
Bonds remain an indispensable tool for both income generation and portfolio diversification, bridging the gap between safety and opportunity in the financial markets.
SBIN 1D Time frameCurrent Price (approx): ₹864
52-Week Low: ₹680
52-Week High: ₹880.50
Daily Chart Explanation
On the 1-day timeframe, SBIN is moving near its upper range, close to the recent high. This means the stock is strong but also facing heavy resistance.
Trend: Uptrend overall (higher highs and higher lows).
Momentum: Price is consolidating near resistance, showing hesitation.
Candles: Recent candles show wicks near the top, which means sellers are active near ₹880.

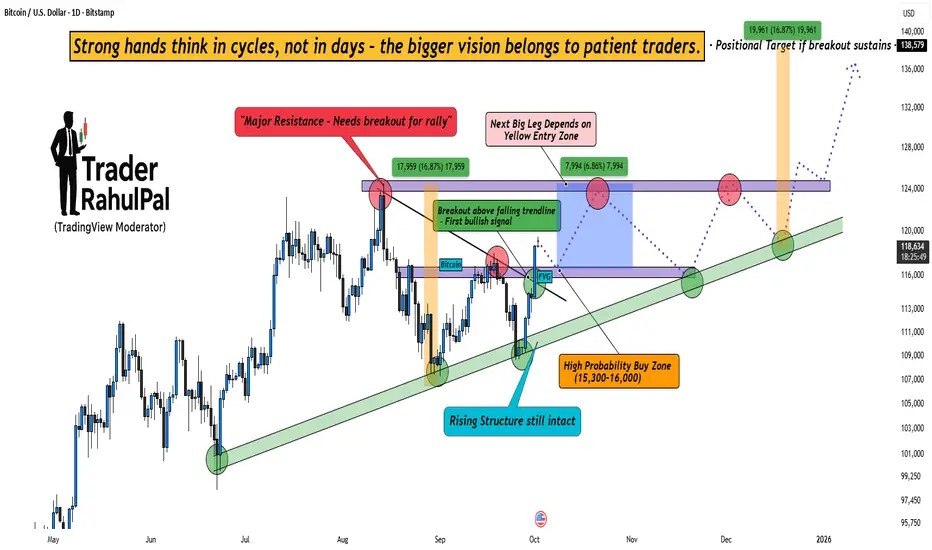
Bitcoin Cycle Play – The Setup That Could Change the Game!Bitcoin is currently showing clear bullish intent , but the real game lies in patience. The chart highlights a decisive breakout above the falling trendline , which is the first bullish signal after weeks of uncertainty.
At the same time, the rising structure is still intact , reminding us that the bigger trend remains strong. Smart money never chases candles – instead, it waits for the high probability zones . In this case, the 15,300–16,000 range could become the golden buying zone for long-term players.
However, one key hurdle remains – the major resistance overhead . Only if Bitcoin breaks and sustains above this zone, the door opens for the positional target near 138,000+ .
The psychology is simple : weak hands focus on short-term noise, but strong hands think in cycles and structures . Every dip tests conviction, but those who hold the bigger vision are the ones who capture the massive moves.
Rahul’s Tip : Don’t rush behind every breakout. Wait for zones where probability aligns with psychology . That’s where the wealth-building trades lie.
Disclaimer: This analysis is for educational purposes only and should not be taken as financial advice. Please do your own research or consult your financial advisor before investing.
Analysis By @TraderRahulPal (TradingView Moderator) | More analysis & educational content on my profile
👉 If you found this helpful, don’t forget to like and follow for regular updates.
XAUUSD – Maintaining the Core Uptrend (BUY Bias)
Hello traders,
On the H4 timeframe, gold continues to show a steady upward trend. After testing the upper trendline, price bounced back and is now consolidating around the 386x region. This suggests the market may be in an accumulation phase, awaiting major news.
Fundamental Context
Tomorrow, the market will look towards the release of the Nonfarm Payrolls (NFP) data, an event that often brings strong volatility to gold prices.
In addition, concerns around the potential US Government shutdown are adding to the macro uncertainty, further supporting gold’s safe-haven appeal.
At present, there is little evidence to suggest gold will decline, particularly when other markets are also breaking higher.
Technical Analysis
Price continues to trade within the ascending channel on H4, with buyers holding the advantage.
MACD remains above the zero line, showing no clear signs of weakness.
Price is likely to consolidate further in the 3860 – 3870 range before a sharp move triggered by news.
Trading Plan
Buy Setup (preferred – trend following)
Entry: 3829 – 3832
SL: 3825
TP: 3845 – 3862 – 3877 – 3890
Sell Scalping (counter-trend, higher risk)
Entry: 3927 – 3930
SL: 3934
TP: 3915 – 3900 – 3882 – 3865
Note: Sell setups should be treated only as short-term scalps, as the primary bias remains on the buy side.
Conclusion
Gold is holding firmly within the uptrend structure, with no significant weakness yet. Given the backdrop of political uncertainty and the upcoming NFP release, the priority remains buying at suitable support zones. Any sell trades should be viewed as quick reactions rather than core positions.
👉 Follow me to get the latest updates as soon as price structure changes.

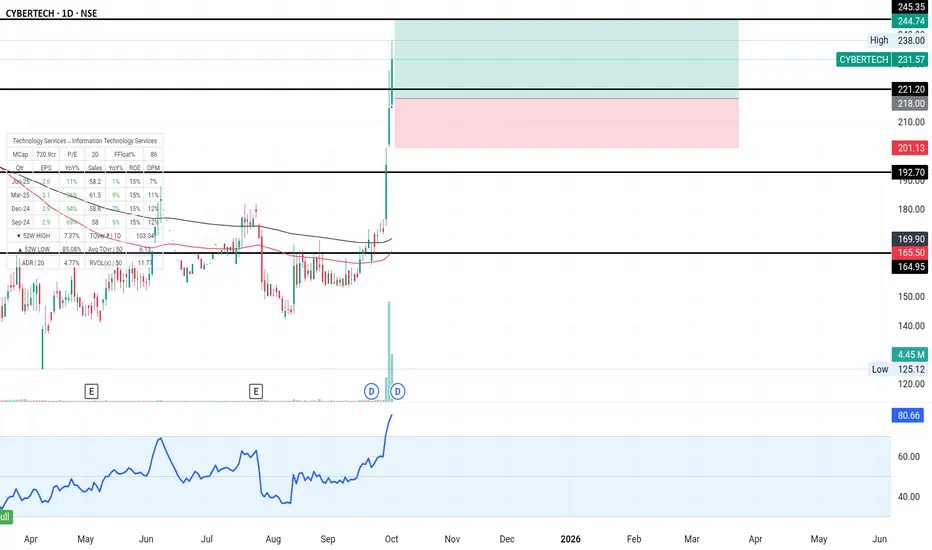
CYBERTECH LONGBuy cybertech at 218 level and hold till 245 level with SL of 201.
Risk reward ratio is 1:1.59 here
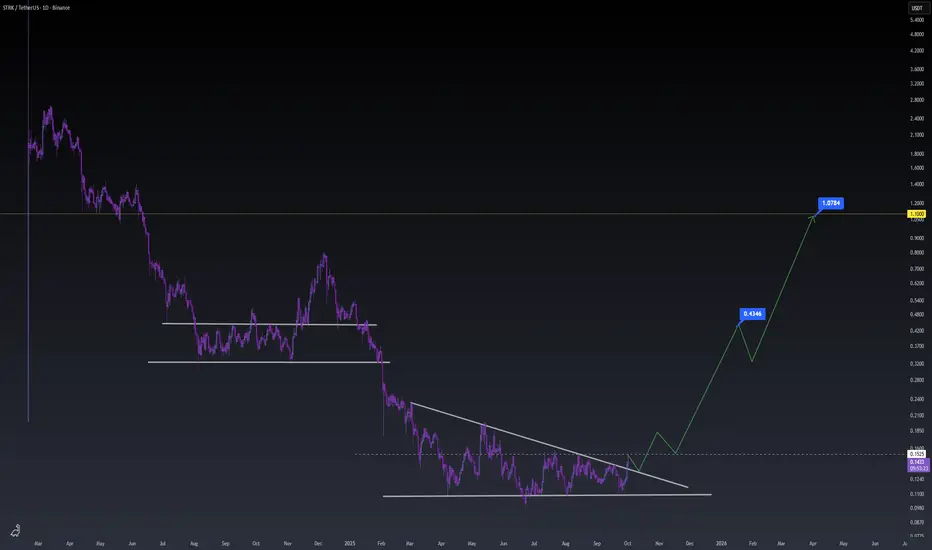
STRK shifting gearsGood to see the STARKNET team finally shifting gears and dropping bullish updates right at the start of Q4. Feels like Jew Mode is on now. Time to moon it.
ATH $3871: Shutdown Fear & 97% Fed Cut Fuel Gold Surge
Hello, investors and traders!
Gold continues to show phenomenal strength, setting a new ATH at $3,871.45/oz (on Sept 30), and closing at $3,843.43/oz. This gain confirms the strongest September since 2011, solidly confirming the explosive growth trend for the yellow metal.
Fundamental Analysis: Politics and the Fed Drive Buying Wave
Two core drivers are pushing gold prices higher, making any attempt to short (call the top) extremely risky:
Political Instability: The risk of a looming US Government shutdown is ratcheting up uncertainty and strongly boosting safe-haven demand.
Low-Rate Expectations: Weakening US jobs data has nearly locked in the probability that the Fed will cut interest rates in October. The market is currently pricing in a 97% chance of a Fed rate cut.
Technical Analysis & Trading Strategy
After a recent shock drop of 70 points, Gold quickly absorbed the selling pressure and created a new ATH, proving that buying pressure is overwhelming. The strong upward bias is undeniable.
Outlook: Continue to Prioritize Buy given the powerful trend and supportive fundamentals. Only attempt Sell strategies near psychological resistance levels with an extremely tight Stop Loss (SL).
Key Resistance: $3894, $3904, $3914, $3924
Key Support: $3869, $3843, $3834
Suggested Trading Strategy (Absolute Risk Management):
BUY SCALP
Zone: $3870 - $3868 / SL: $3864
TP: $3875 - $3885 - $3900
BUY ZONE
Zone: $3834 - $3832 / SL: $3824
TP: $3842 - $3862 - $3892
SELL SCALP (High Risk)
Zone: $3904 - $3906 / SL: $3910
TP: $3901 - $3891 - $3876
SELL ZONE (High Risk)
Zone: $3925 - $3927 / SL: $3935
TP: $3917 - $3907 - $3897 - $3887 - $3877 - $3867
The market is running on fear and rate-cut anticipation. Are you betting on the $3900 mark this week? 👇
#Gold #XAUUSD #ATH #Fed #GovernmentShutdown #TradingView #InterestRates #FinancialMarkets

LTIM 5000 is strong support for LTIM. As per price action we can go with long side position in LTIM. Management in previous quarterly result was optimistic about coming quarters. Good result and Management confidence on coming quarters will be trigger point. Stop loss must be there below 5000

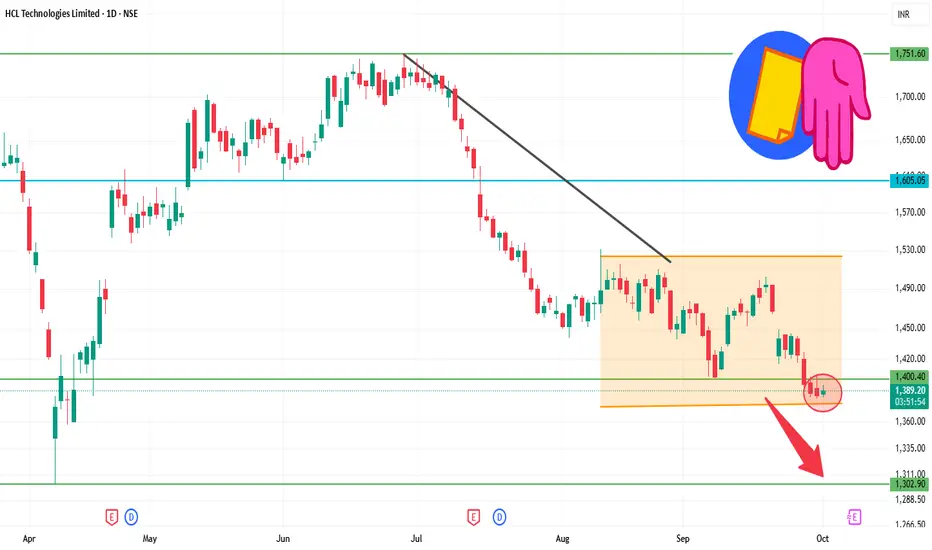
HCLTECH 1D Time frameOpening Price: ₹1,387.40
Closing Price: ₹1,387.40
Day Range: ₹1,383.10 – ₹1,395.00
Previous Close: ₹1,387.40
📉 Trend Analysis
Short-Term Trend: Bearish — The stock is trading below key moving averages, confirming the bearish trend.
Medium-Term Trend: Neutral — The stock is in a consolidation phase, characterized by lower highs and lower lows.
Long-Term Trend: Neutral — No significant trend identified; the stock is trading within a range.
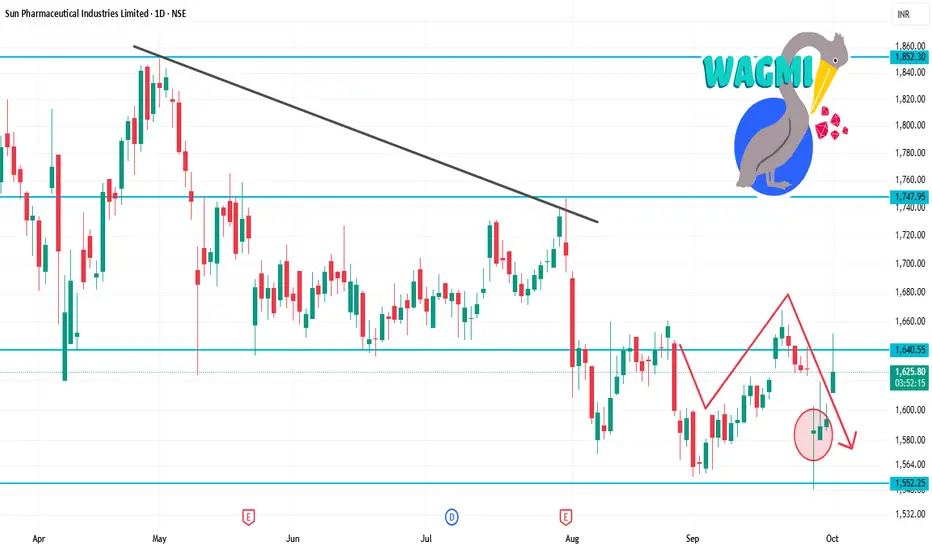
SUNPHARMA 1D Time frameOpening Price: ₹1,611.90
Closing Price: ₹1,628.20
Day Range: ₹1,611.90 – ₹1,651.50
Previous Close: ₹1,594.30
📉 Trend Analysis
Short-Term Trend: Bearish — The stock is trading below key moving averages, confirming the bearish trend.
Medium-Term Trend: Neutral — The stock is in a consolidation phase, characterized by lower highs and lower lows.
Long-Term Trend: Neutral — No significant trend identified; the stock is trading within a range.
GOLD ATH: US Shutdown Drama! Buy The Dip, Yaar? Gold just smashed a new record at $3,833.37/oz (Sept 29) on high safe-haven demand due to the impending US Govt shutdown (Oct 1) and solid FED rate cut hopes. USD pullback (0.2%) also playing its part.
The sudden dip to $3,794 looks like pure end-of-month profit-booking, not a proper reversal. If US tensions worsen, the Buy opportunity is still very much active!
📈 Technical View & Intraday Trade Setup
Gold has done a major flush, stopping out the weak hands. Selling pressure is there, but the drop without big news suggests caution. Look for a technical bounce to fill the FVG before a potential continuation lower.
Key Levels:
Resistance: $3827 / $3846 / $3870
Support: $3787 / $3778 / $3763
Detailed Trading Strategy (US Session):
1. BUY Zone (Aggressive Dip Buy):
Entry: $3784 - $3782
SL: $3774
TP: $3792 / $3812 / $3832
2. SELL Scalp (Quick Short):
Entry: $3827 - $3829
SL: $3833
TP: $3824 / $3814 / $3804
3. SELL Zone (Main Short Entry):
Entry: $3866 - $3868
SL: $3876
TP: $3858 / $3838 / $3818
⚠️ Alert! The US Government Shutdown news is the main event. If budget talks are positive, Gold might see a sharp fall. Manage risk (SL) like a boss!
Kya lagta hai? Will Gold fly to $4K or take support near $378x? 👇
#XAUUSD #Gold #MCX #TradingStrategy #USShutdown #FED #TechnicalAnalysis #Intraday #MarketUpdate #Commodities

XAUUSD – US Government Shutdown Pressure on Gold
Hello Traders,
For the first time since 2018, the US Government is facing the risk of a shutdown. This can only be avoided if Congress passes new funding legislation, but the timing remains uncertain. This political backdrop is exerting strong pressure on the financial markets, and gold – the traditional safe haven asset – has become the focal point for investors.
Technical Outlook
Gold continues to set new ATHs right in the Asian session today, indicating the uptrend remains intact.
The upward price channel on H4 maintains a beautiful structure, with the main trend continuing to favour buying.
Yesterday's dip was merely a "liquidity sweep," after which the price quickly returned to its upward momentum.
Short positions can be considered when the price hits strong resistance, combining Fibonacci + Trendline, to optimise winning probabilities.
Trading Scenario
Sell (short-term at resistance):
Entry: 3884 – 3886
SL: 3890
TP: 3872 – 3860 – 3845 – 3830
Buy (aligning with the main trend):
Entry: 3820 – 3823
SL: 3816
TP: 3835 – 3850 – 3862 – 3880
Conclusion
Gold remains strongly supported by the political instability in the US.
The medium-term strategy continues to prioritise Buying at support zones, while Selling should only be considered when there is a clear reaction at resistance zones.
Traders need to closely monitor political news, as any developments related to the US government could alter the short-term structure of gold.
Follow me for the quickest updates on new scenarios as the price path changes.

Part 11 Trading Master Class With ExpertsI. Option Trading Strategies
Buying Calls and Puts
Buying a Call: Profitable if asset price rises above strike + premium.
Buying a Put: Profitable if asset price falls below strike - premium.
Covered Call Strategy
Involves holding the underlying stock and selling a call option.
Generates premium income but limits upside profit.
Protective Put
Buying a put while holding the underlying asset as insurance against a price drop.
Spreads
Combine buying and selling options to reduce risk and cost:
Bull Call Spread: Buy lower strike call, sell higher strike call.
Bear Put Spread: Buy higher strike put, sell lower strike put
Straddles and Strangles
Straddle: Buy ATM call and put; profitable if price moves significantly either way.
Strangle: Buy OTM call and put; cheaper than straddle, requires larger movement.
Iron Condor
Advanced strategy combining bull and bear spreads.
Generates income with limited risk in low-volatility markets.
Calendar and Diagonal Spreads
Utilize different expiration dates and strikes to profit from time decay and volatility.
II. Risk Management in Options
Leverage and Risk
Options offer high leverage: small price moves in underlying asset can lead to large gains or losses. Proper position sizing is crucial.
Maximum Loss and Gain
Buyer: Max loss = premium paid; Max gain = theoretically unlimited for calls, limited for puts.
Seller: Max gain = premium received; Max loss = potentially unlimited for naked calls.
Diversification Across Strategies
Mixing spreads, covered calls, and protective puts helps reduce single-position risk.
Stop-Loss and Exit Strategies
Plan exit points: cut losses, take partial profits, or roll positions to new strikes or expirations.
III. Market Mechanics and Trading
Exchanges and Option Contracts
Options trade on regulated exchanges (e.g., NSE, BSE, CBOE). Each contract represents a fixed quantity of the underlying (e.g., 100 shares per contract).
Liquidity and Open Interest
Liquidity: Ease of buying/selling options at fair prices.
Open Interest: Number of outstanding contracts; higher OI often means better liquidity.
Implied Volatility and Market Sentiment
IV: Market’s forecast of future volatility.
Rising IV generally increases option premiums, signaling uncertainty.
Hedging vs. Speculation
Options can hedge existing positions or speculate on market movements. Hedging reduces risk, speculation increases risk but offers leverage.

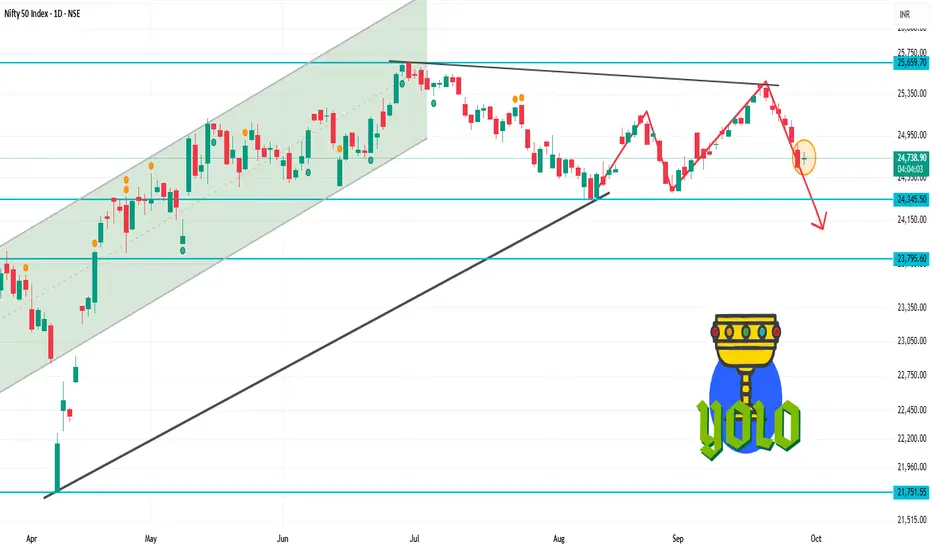
Nifty As per the chart pattern, 24500-24550 is very crucial support zone. Bearish move will persist if Nifty closes below 24500. Next 2-3 days we need to watch carefully. If it reverse from this zone, strong bull case scenario will be there. Trigger point will be RBI policy and earning season

XAUUSD – Will ATH Diminish Gold's Value?Hello Traders,
Gold once accounted for up to 21% of total global assets, but now this figure is only about 5%. Two perspectives are clearly visible:
Gold is gradually losing its relative importance in the financial system.
The total value of global assets has increased significantly (the denominator has expanded), causing gold's proportion to decrease, while the absolute value of gold still plays an important role.
Technical Analysis
In today's Asian session, gold continues to set higher price levels, indicating a very strong upward momentum.
The upward price channel on H1 has touched the upper boundary, showing slight hesitation, but the main trend remains bullish.
The H1 and H4 frames maintain strong buying pressure, with market sentiment heavily leaning towards buyers, ready to push prices to higher levels.
According to Elliott Wave, the price is currently in wave 5 (market sentiment wave). The current task is to observe the reaction when this wave completes, to prepare for the ABC correction cycle.
Regarding Fibonacci, the next important resistance area is at 3880, where a bearish reaction is likely to occur.
Trading Scenario
Sell (at Fibo resistance 3880):
Entry: 3880
SL: 3886
TP: 3866 – 3850 – 3835
Buy (trend-following preferred):
Entry: 3813 – 3816
SL: 3809
TP: 3828 – 3843 – 3860 – 3878
👉 Note: Smaller frames H1 – M15 will provide additional confirmation signals to optimize entry points.
Conclusion
The bullish trend of gold is still prioritized, wave 5 is not yet complete, and the scenario aiming for 4000 – 4050 is entirely feasible.
Short-term selling at strong resistance areas can be considered, but risk management must be tight.
Traders need to closely follow support – resistance areas in smaller frames to maximize profits.
Follow me for the fastest updates when the price structure changes and to discuss more scenarios in the community.

BUY TODAY SELL TOMORROW for 5%DON’T HAVE TIME TO MANAGE YOUR TRADES?
- Take BTST trades at 3:25 pm every day
- Try to exit by taking 4-7% profit of each trade
- SL can also be maintained as closing below the low of the breakout candle
Now, why do I prefer BTST over swing trades? The primary reason is that I have observed that 90% of the stocks give most of the movement in just 1-2 days and the rest of the time they either consolidate or fall
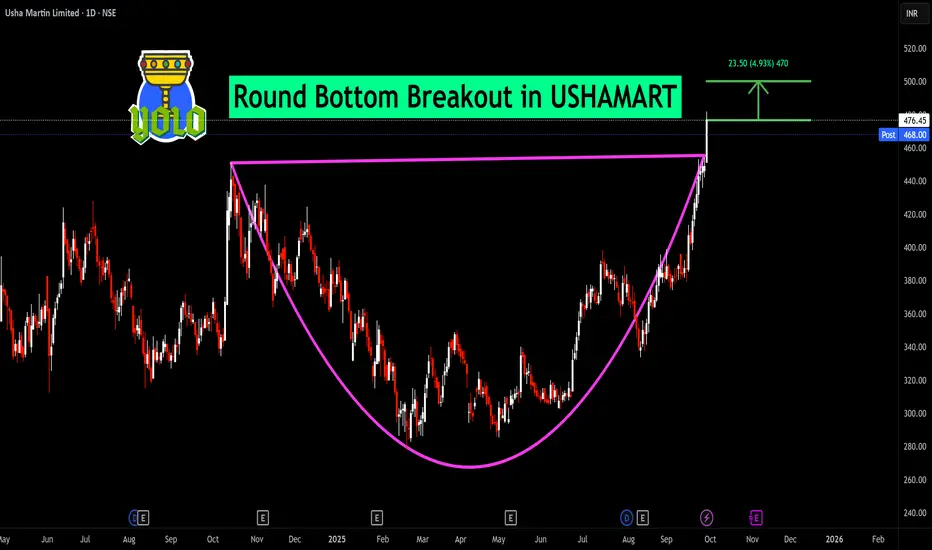
Round Bottom Breakout in USHAMART
BUY TODAY SELL TOMORROW for 5%
ICICI Bank: Resistance Turned Support Powers Next Rally🔍 Technical Analysis
ICICI Bank showcases another remarkable wealth creation story spanning over two decades. The stock has delivered an extraordinary super bullish rally, transforming from ₹40 to the current trading level of ₹1,351 - representing an impressive 33.8x growth over 20+ years.
The ₹1,345-₹1,365 zone has historically acted as a strong resistance, tested multiple times. However, with the confirmation of strong FY25 results, the stock decisively broke out from this resistance zone and created a new all-time high at ₹1,500.
Following the breakout peak, the stock witnessed a sudden fall and is now trading back in the same zone at current market price of ₹1,351. This presents a critical juncture - if the earlier resistance zone transforms into support with bullish candlestick pattern confirmations, it could signal the next leg of the rally.
Entry Strategy: Enter only on confirmation of ₹1,345-₹1,365 zone acting as support with bullish patterns.
🎯 Targets:
Target 1: ₹1,400
Target 2: ₹1,450
Target 3: ₹1,500
🚫 Stop Losses:
Critical Support: ₹1,200 (crucial demand zone)
If ₹1,200 level doesn't sustain, no more expectations on this stock.
💰 FY25 Financial Highlights (vs FY24 & FY23)
Total Income: ₹1,86,331 Cr (↑ +17% YoY from ₹1,59,516 Cr; ↑ +95% from FY23 ₹95,407 Cr)
Total Expenses: ₹1,30,078 Cr (↑ +31% YoY from ₹99,560 Cr; ↑ +48% from FY23 ₹87,864 Cr)
Financing Profit: ₹-32,775 Cr (Improved from ₹-14,152 Cr in FY24)
Profit Before Tax: ₹72,854 Cr (↑ +21% YoY from ₹60,434 Cr; ↑ +58% from FY23 ₹46,256 Cr)
Profit After Tax: ₹54,569 Cr (↑ +18% YoY from ₹46,081 Cr; ↑ +54% from FY23 ₹35,461 Cr)
Diluted EPS: ₹71.65 (↑ +14% YoY from ₹63.02; ↑ +47% from FY23 ₹48.74)
🧠 Fundamental Highlights
ICICI Bank delivered robust FY25 performance with 18% PAT growth to ₹54,569 crore, supported by strong 17% revenue growth. The bank announced Q4 FY25 net profit of ₹12,630 crore, marking 18% increase, and declared ₹11 per share dividend reflecting strong financial health.
Market cap stands at ₹9,71,186 crore (up 4.06% in 1 year) with total revenue reaching ₹1,90,830 crore and profit of ₹56,563 crore. Stock is trading at 3.08 times its book value, indicating reasonable valuation for quality franchise.
Asset quality continues to improve with gross NPA dropping to 1.97% in Q2FY25 from 2.48% in Q2FY24, while net NPA ratio remained healthy at 0.43% in Q1 FY25. This demonstrates effective risk management and strong credit discipline.
The bank shows strength near key support zone of 1370-1390 on daily charts, with technical indicators suggesting potential diamond pattern formation around 1380-1400 range. Analysts expect stable net interest margins and continued momentum.
Strong digital banking initiatives, expanding retail franchise, and consistent delivery of 14-18% profit growth across quarters validates the bank's operational excellence and market leadership position in private banking sector.
✅ Conclusion
ICICI Bank's remarkable 20+ year journey from ₹40 to ₹1,500 all-time high, backed by strong FY25 fundamentals showing 18% PAT growth and ₹11 dividend, validates the sustained growth thesis. The critical ₹1,345-₹1,365 resistance-to-support transformation offers attractive entry opportunity for targeting ₹1,500 retest. Improving asset quality with 1.97% gross NPA, strong ROE profile, and digital transformation drive provide multiple growth catalysts. Key support at ₹1,200 provides risk management framework for this quality banking franchise.

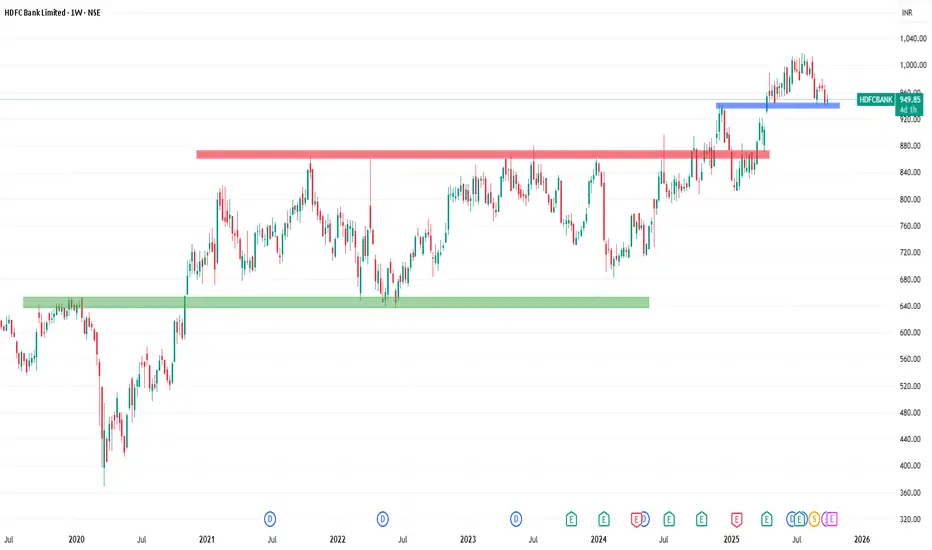
HDFC Bank: Three Decades of Excellence Continues🔍 Technical Analysis
HDFC Bank represents one of the most remarkable wealth creation stories in Indian equity markets. The stock has delivered an extraordinary super bullish rally over three decades, transforming from ₹1 to the current trading level of ₹955 - representing an astounding 955x growth over 30 years.
Currently, the stock is taking strong support in the ₹935-₹945 zone, which has acted as a crucial demand area. This support zone has been tested multiple times and held firm, indicating institutional accumulation at these levels.
If the three-decade bullish rally continues from current support levels, the technical setup favors resumption of the uptrend. The stock is well-positioned for the next leg of growth from the established support zone.
Entry Strategy: Accumulate in the ₹935-₹955 range with strong support confirmation.
🎯 Targets:
Target 1: ₹980
Target 2: ₹1,000
Target 3: ₹1,020
🚫 Stop Losses:
Minor Support: ₹850 (intermediate demand zone)
Major Support: ₹650 (strong long-term support)
If ₹650 level breaks down, no more expectations on this stock.
💰 FY25 Financial Highlights (vs FY24 & FY23)
Total Income: ₹3,36,367 Cr (↑ +19% YoY from ₹2,83,649 Cr; ↑ +97% from FY23 ₹1,70,754 Cr)
Total Expenses: ₹1,86,974 Cr (↑ +7% YoY from ₹1,74,196 Cr; ↑ +197% from FY23 ₹63,042 Cr)
Financing Profit: ₹-34,501 Cr (Improved from ₹-44,685 Cr in FY24)
Profit Before Tax: ₹96,242 Cr (↑ +26% YoY from ₹76,569 Cr; ↑ +57% from FY23 ₹61,498 Cr)
Profit After Tax: ₹73,440 Cr (↑ +12% YoY from ₹65,446 Cr; ↑ +59% from FY23 ₹46,149 Cr)
Diluted EPS: ₹46.26 (↑ +10% YoY from ₹42.16; ↑ +12% from FY23 ₹41.22)
🧠 Fundamental Highlights
HDFC Bank delivered strong FY25 performance with consolidated PAT growing 12% YoY to ₹73,440 crore, supported by robust 19% revenue growth to ₹3,36,367 crore. The bank declared ₹22 dividend reflecting confidence in sustained profitability.
Market cap stands at ₹14,51,630 crore (up 7.84% in 1 year) with stock trading at 2.77 times book value. Total revenue for FY25 reached ₹3,42,193 crore with profit of ₹73,343 crore, demonstrating consistent financial strength.
Q4 FY25 standalone net profit grew 6.7% YoY to ₹17,616 crore, with net interest income (NII) increasing 10.3% YoY to ₹32,070 crore. Net interest margin (NIM) stood at 3.54% on total assets, reflecting stable spreads despite competitive environment.
Asset quality remains robust with gross NPAs at 1.36% and net NPAs at 0.33% of net advances. Average deposits for Q4 FY25 grew 15.8% YoY to ₹25,280 billion, while CASA deposits grew 5.7% YoY to ₹8,289 billion, maintaining stable share in deposit mix.
The bank is strategically managing its credit-deposit (CD) ratio and planning measured loan growth in FY26 to maintain balance sheet quality. Strong subsidiary performance and digital banking initiatives continue to drive franchise value.
✅ Conclusion
HDFC Bank's remarkable 30-year journey from ₹1 to ₹955, backed by strong FY25 fundamentals showing 12% PAT growth and ₹22 dividend declaration, validates the long-term investment thesis. The ₹935-₹945 support zone offers attractive accumulation opportunity for targeting ₹1,020+ levels. Robust asset quality with 1.36% gross NPA, 15.8% deposit growth, and stable 3.54% NIM demonstrate operational excellence. The stock remains a core banking sector holding with multiple support levels providing risk management framework.
XAUUSD – Prioritise waiting to buy after gold hits ATHXAUUSD – Prioritise waiting to buy after gold hits ATH, target 3840
Hello Trader,
Right at the start of the week, gold has set a new ATH, affirming the upward trend remains dominant. The price structure on H1 shows buying pressure remains quite strong, while adjustments are mainly to balance liquidity. In the current context, the preferred trading strategy is still to wait to buy at key support zones, with a target towards 3840.
Basic Context
This week, the usual focus would be on the Nonfarm Payrolls (NFP) data. However, the risk of a US Government shutdown might delay this crucial report.
The US fiscal year runs from 1/10 to 30/9. If Congress does not pass all 12 spending bills, agencies without funding will have to cease operations.
In the absence of important economic information, gold continues to benefit from safe-haven sentiment and fiscal policy uncertainty.
Technical View
The price has broken out and created an ATH, with the 3837 – 3840 zone currently being strong resistance (Fibonacci + market psychology).
The 3770 – 3773 zone is near support, coinciding with the trendline and previous liquidity, suitable for buying.
MACD on H1 shows buying momentum is maintained, but a correction is needed for price balance before breaking higher.
Trading Strategy
Short-term Sell (at resistance):
Entry: 3837 – 3840
SL: 3844
TP: 3830 – 3800 – 3770
Note: This is only a reactive order at resistance, going against the main trend, so manage risk tightly.
Preferred Buy (trend-following):
Entry: 3770 – 3773
SL: 3766
TP: 3784 – 3799 – 3810 – 3838
Conclusion
This week, gold still prioritises the Buy strategy at support zones. The main target is towards 3840, an important resistance zone and a benchmark for trend strength. The Sell order is only short-term at resistance, while the main scenario remains waiting for a correction to buy up.
Follow me for short-term scenario updates during the week, especially as news and US fiscal policy changes can significantly impact gold.

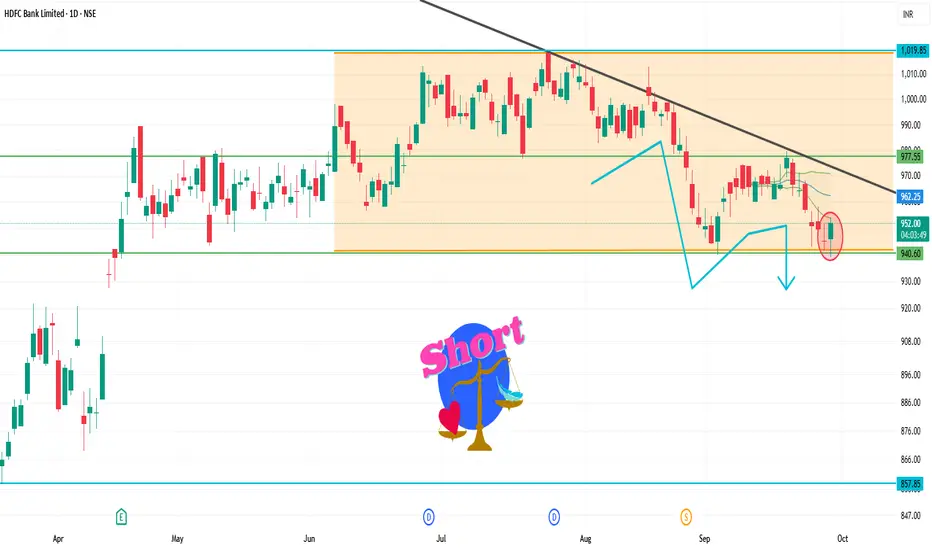
HDFCBANK 1D Time frameCurrent Market Snapshot
Current Price: ₹954.05
Opening Price: ₹945.10
Day's Range: ₹939.10 – ₹953.00
Previous Close: ₹945.05
🔑 Technical Indicators
Relative Strength Index (RSI): 35.08 – indicating a neutral to bearish condition.
Moving Average Convergence Divergence (MACD): -6.02 – suggesting bearish momentum.
Moving Averages: Trading below the 50-day and 200-day moving averages, indicating a bearish trend.
📈 Key Support & Resistance Levels
Immediate Support: ₹939
Immediate Resistance: ₹953
Pivot Point: ₹946
📉 Market Sentiment
Trend: The stock is trading below its 50-day and 200-day moving averages, indicating a bearish trend.
Volume: Trading volume is higher than average, suggesting increased investor activity.
📈 Strategy (1D Timeframe)
1. Bullish Scenario
Entry: Above ₹953
Stop-Loss: ₹939
Target: ₹960 → ₹965
2. Bearish Scenario
Entry: Below ₹939
Stop-Loss: ₹953
Target: ₹930 → ₹925
⚠️ Risk Management
Limit risk to 1% of capital per trade.
Always use stop-loss to protect against unexpected market movements.
Monitor broader market trends and sector-specific news that may impact stock performance.
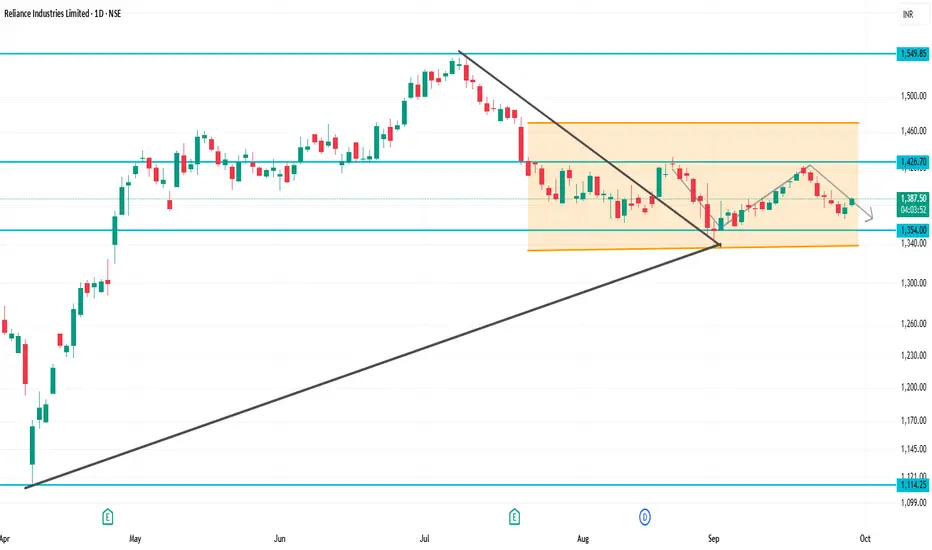
RELIANCE 1D Time frameCurrent Market Snapshot
Current Price: ₹1,383.30
Opening Price: ₹1,381.60
Day’s Range: ₹1,379.00 – ₹1,386.90
Previous Close: ₹1,377.60
🔑 Technical Indicators
Relative Strength Index (RSI): 49.76 – indicating a neutral condition.
Moving Average Convergence Divergence (MACD): -3.20 – suggesting bearish momentum.
Moving Averages: Mixed signals; trading slightly below the 50-day and 200-day moving averages, indicating a neutral to bearish trend.
📈 Key Support & Resistance Levels
Immediate Support: ₹1,379
Immediate Resistance: ₹1,387
Pivot Point: ₹1,383
📉 Market Sentiment
Recent Performance: Reliance Industries experienced a decline of 0.82% on September 25, 2025, underperforming the broader market.
Volume: Trading volume is higher than average, suggesting increased investor activity.
📈 Strategy (1D Timeframe)
1. Bullish Scenario
Entry: Above ₹1,387
Stop-Loss: ₹1,379
Target: ₹1,395 → ₹1,400
2. Bearish Scenario
Entry: Below ₹1,379
Stop-Loss: ₹1,387
Target: ₹1,370 → ₹1,365
⚠️ Risk Management
Limit risk to 1% of capital per trade.
Always use stop-loss to protect against unexpected market movements.
Monitor broader market trends and sector-specific news that may impact stock performance.
NIFTY 1D Time frameOpening Level: ₹24,691.10
Current Level: ₹24,765
Day's Range: ₹24,500 – ₹24,900 (approximate)
🔑 Key Support & Resistance Levels
Immediate Support: ₹24,500
Immediate Resistance: ₹24,900
Pivot Point: ₹24,765
📊 Market Sentiment
Trend: The NIFTY 50 has experienced a six-day losing streak, indicating bearish momentum.
NDTV Profit
Volume: Trading volume is higher than average, suggesting increased investor activity.
📈 Strategy (1D Timeframe)
1. Bullish Scenario
Entry: Above ₹24,900
Stop-Loss: ₹24,500
Target: ₹25,100 → ₹25,300
2. Bearish Scenario
Entry: Below ₹24,500
Stop-Loss: ₹24,900
Target: ₹24,300 → ₹24,100
⚠️ Risk Management
Limit risk to 1% of capital per trade.
Always use stop-loss to protect against unexpected market movements.
Monitor broader market trends and sector-specific news that may impact index performance.