LiamTrading – XAUUSD OutlookSharing my personal view on the possible next move for gold.
Based on the current chart structure, the wave formation suggests that XAUUSD is most likely in Wave 4. The correction started yesterday after price touched the 3,700 mark – a round resistance level which also coincides with the 1.618 Fibonacci extension. This area often attracts heavy liquidity, and the subsequent pullback further supports the view that Wave 4 has been activated.
At present, the key support to watch is 3,675. If this level breaks, the corrective structure could complete around 3,656. On the H1 timeframe, the RSI has moved below the 30 level, indicating oversold conditions. In my view, while the market remains in this phase, it is still preferable to look for selling opportunities, though patience is needed until clearer confluence signals appear.
Trading plan (short-term focus):
Sell entry 3685–3687, SL 3693, TP 3670 – 3656
Buy entry 3656–3654, SL 3648, TP 3675 – 3690 – 3702 – 3721 – 3740
I will continue to share further updates if there are significant moves in price. Wishing everyone successful and effective trading.
Fundamental Analysis

Why wait for FOMC when you can book 1:10 in GOLD like this...Took a beautiful trade in gold, went pretty well.
Done and dusted, will eat popcorn while FOMC happens.
ALL THE BEST EVERYONE
Nifty 50 Breakout and RSI Momentum Analysis – Sept 2025This TradingView chart presents a technical analysis of Nifty 50, highlighting a recent breakout from a descending trendline with harmonic ABCD pattern and advanced RSI insights. Key support and resistance levels are marked, and RSI momentum shows a clear structural shift as of September 17, 2025. The setup visualizes Fibonacci zones, price action targets, and a multi-timeframe confluence to help traders anticipate future market moves and confirm trend reversals.

XAUUSD H1 – Pennant + Head & ShouldersXAUUSD H1 – Pennant + Head & Shoulders: Two Key Levels 3657 / 3627
Hello Traders,
Gold opened the week with a bounce of over 20 points from the rising trendline and is now consolidating within a Pennant, which aligns with a small Head & Shoulders structure on the H1 chart. At the moment, the market is waiting for a breakout and confirmation to establish a clearer direction.
Pattern: A narrowing Pennant Flag alongside an H&S (left shoulder – head – right shoulder).
Key Zones to Watch
3655–3660: Crucial reaction zone (trendline + Pennant top).
3627: Critical support — a break below would invalidate the short-term bullish structure.
Fibonacci Levels:
1.618 in the mid-range, 2.618 lower — possible targets for a deeper correction.
MACD (12,26,9): Histogram has turned negative → short-term bearish momentum has the edge, though clear confirmation is still pending.
Trading Scenarios
Bullish Setup
Entry: Retest around 3654–3657
Targets: 3663 – 3670 – 3680 → 3695
Stop: Below 3648
Bearish Setup
Entry: Sell directly on breakdown, or wait for a retest near 3671–3674
Targets: 3663 – 3650 – 3633 – 3615 → 3595 → 3568 → 3540
Stop: Above 3679
the market is currently pricing in near certainty of a 0.25% Fed rate cut on 17th September, while the probability of a 0.50% cut still remains on the table.
If you find this analysis helpful, feel free to share your thoughts in the comments. I’ll update the outlook as soon as the price structure changes — follow me to get the latest setups first.

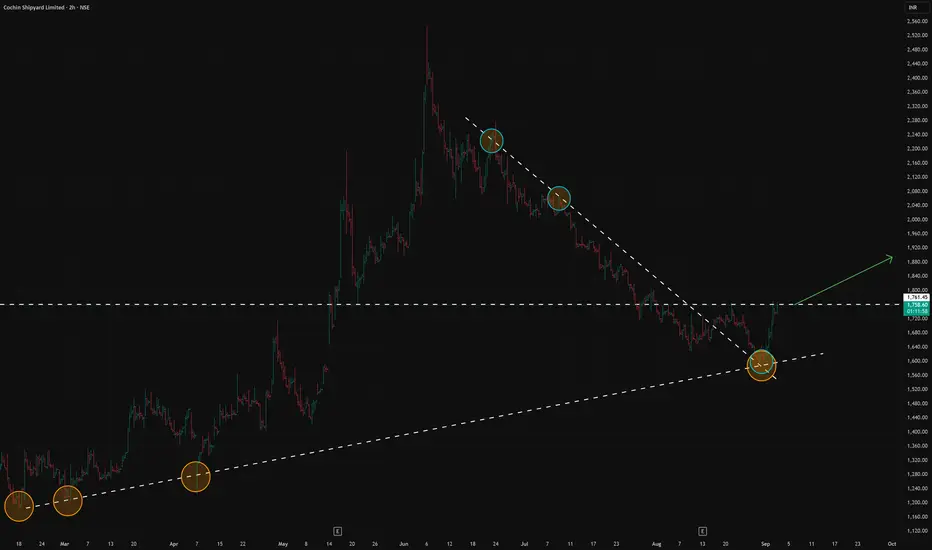
COCHINSHIP IN (Cochin Shipyard) LongCSL is the largest shipbuilder and ship repairer in India
The company recently bagged a contract with Adani Ports and SEZ for the construction of eight tugboats worth about $54 million through its subsidiary Udupi Cochin Shipyard Limited
The conclusion of the Master Ship Repair Agreement (MSRA) with the US Navy for the repair of USNS ships opens up a significant new source of revenue
The company showed an impressive 38.51% YoY revenue growth in the last quarter, reaching INR 106.86 billion
From a technical perspective
-There was an ascending trend line
-Breakout up and then retest of the descending line.
-The correction is ending
-Expect a breakout of the resistance and an increase in quotes
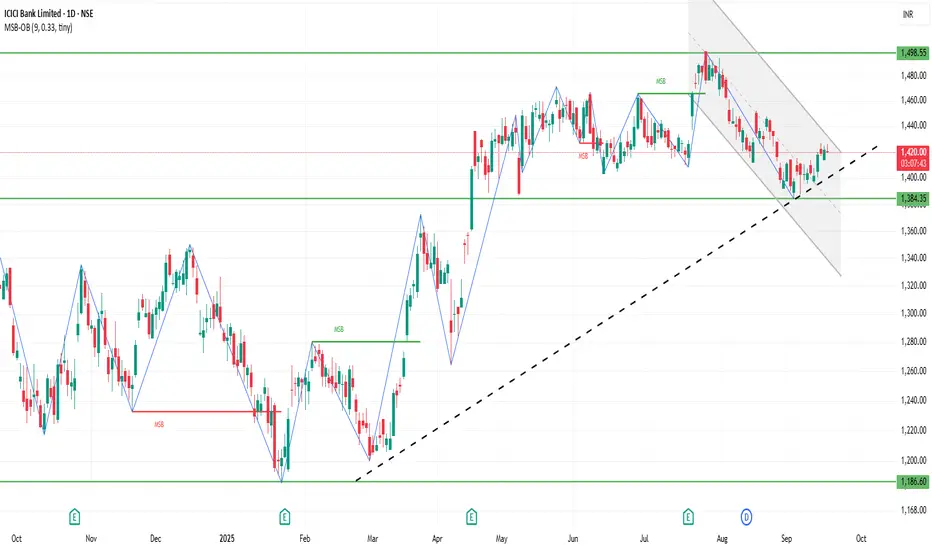
ICICIBANK 1D Time frameCurrent Stock Price
Current Price: ₹1,421.60
Day’s Range: ₹1,420.00 – ₹1,426.10
52-Week Range: ₹1,186.00 – ₹1,500.00
Market Cap: ₹10.17 lakh crore
P/E Ratio (TTM): 18.01
EPS (TTM): ₹74.05
Dividend Yield: 0.77%
Book Value: ₹436.67
📈 Trend & Outlook
Short-Term Trend: Bullish; the stock is trading near its 52-week high, indicating strong investor confidence.
Resistance Levels: ₹1,426.10 (day’s high), ₹1,500.00 (52-week high).
Support Levels: ₹1,420.00 (day’s low), ₹1,400.00 (psychological support).
Investor Sentiment: Positive, with strong institutional interest and favorable analyst outlooks.
🧭 Analyst Insights
Valuation: The stock is trading at a P/E ratio of 18.01, which is slightly below the sector average of 19.82, suggesting potential value.
Growth Prospects: The bank's strong earnings growth and robust capital position support its premium valuation.
SINDHUTRAD IN ( Sindhu Trade Links Limited) Long#Invest #India #SINDHUTRAD
🇮🇳
Sindhu Trade Links is an Indian company operating in the logistics and transportation services sector
SINDHUTRAD is involved in key infrastructure projects in India
The logistics sector in India is expected to grow by 15% in the next 12 months. SINDHUTRAD, with its current growth rate, can beat this growth
The company plans to expand its presence in new regions, which can increase its market share
The company's revenue has increased by 70% in the last three years, significantly exceeding the industry average
The company's P/S is 2.4, which is higher than the industry average of 0.6. This indicates investor expectations for future growth
___________________________
Invest Ideas and Analytics on Global Markets

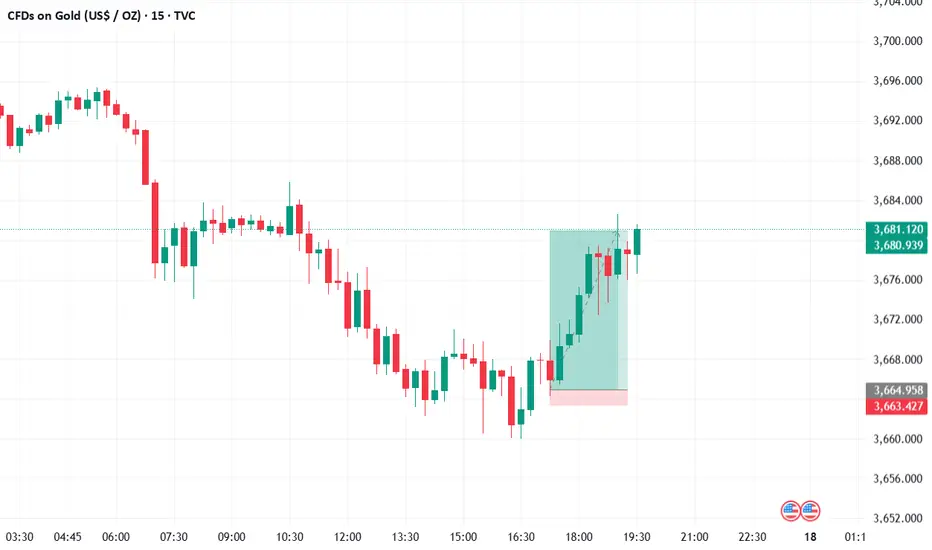
LiamTrading – XAUUSD Strategy for TodayI would like to share my personal view on gold for the day.
The overall trend in XAUUSD continues to be very strong, with the price consistently making fresh highs over the past two weeks. Buying interest has remained steady across sessions, while any corrections have been short-lived, mostly visible on the M15–M30 timeframes.
Yesterday, gold broke out of the Pennant pattern on the upside and is now consolidating near 3,680. On the H4 chart, this level aligns with an important Fibonacci zone, providing further technical confirmation.
From an Elliott Wave perspective, I expect Wave 3 to conclude near 3,700, followed by a corrective Wave 4 towards 3,660 – a level which has acted as reliable support in the past. After that, gold may enter its final Wave 5, with the potential to move towards the 3,740+ region.
Trading setups for consideration:
Buy 3658 – 3656, SL 3651, TP 3674 – 3688 – 3700 – 3715 – 3730 – 3744
Sell 3697 – 3700, SL 3705, TP 3688 – 3672 – 3660 – 3650
Sell 3740 – 3744, SL 3748, TP will be decided based on the price structure at that time
Important levels to keep in focus: 3673 – 3663 – 3635 and 3721, as these zones may trigger price reactions and could be useful for intraday scalping opportunities.
This is my personal outlook on gold for today. I hope it will be helpful to fellow traders in making better trading decisions. Kindly share your feedback in the comments.

GESHIP: Supply Zone Test After Base Formation GESHIP has rebounded and is now testing a prominent supply zone near ₹1,100 after forming a steady base and triggering pocket pivot and non-linear base patterns. Price action shows improving momentum above key EMAs, with accumulation possible in the ₹1,000–₹1,050 zone and targets at ₹1,200–₹1,250. Traders should note the base formation, supply zone resistance, and maintain risk management below ₹920 (closing basis).

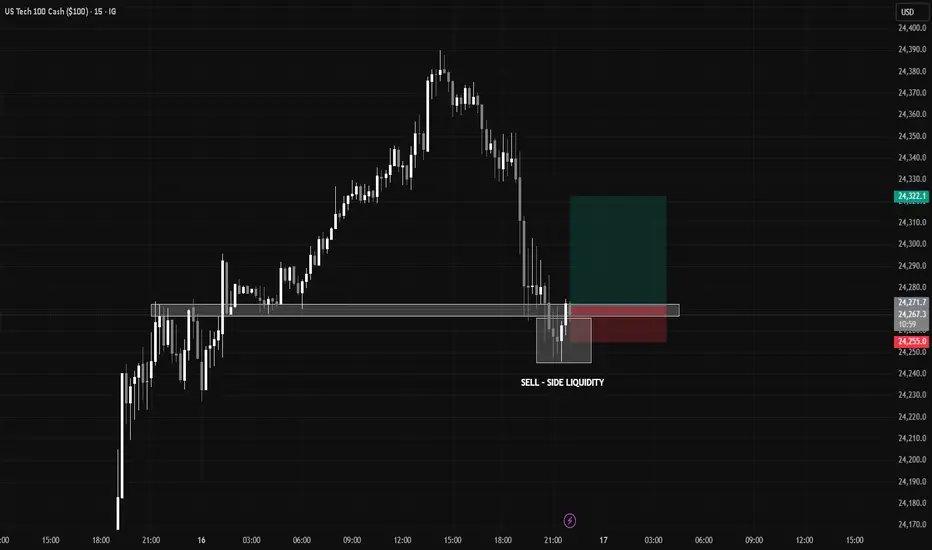
NQ-LONGSSELL-SIDE LIQUIDITY GRAB.
Lets see how liquidity sweep works. Perfect setup !!
Good 1:3 target
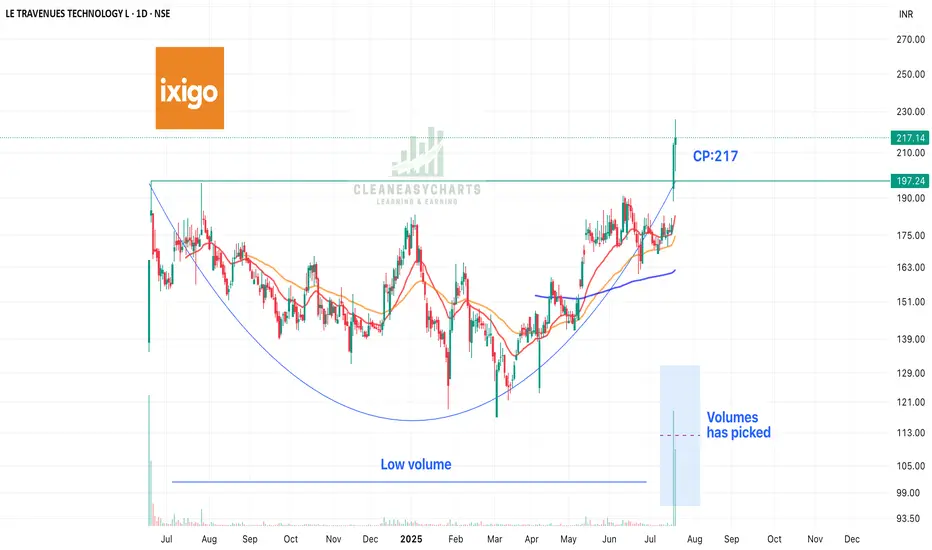
ixigo - Rounding Bottom Patter; IPO StrategyIXigo is a online travel aggregator and is the fastest gorwing Co. in this sector. This stock is looking great on account of following:
1. Fit into the criterion of IPO Strategy - crossed high of its listing price with big volumes
2. Rounding Bottom Patter
3. Best Q1 2025 results
4. Number 2 in OTA sector
This stock should be in your watching list for a good big returns.
Keep following @Cleaneasycharts as we provide Right Stocks in Right Time at Right Price!!.
Cheers!!
Nifty 50 Breakout & Market Breadth Trend (Sep 2025) This chart highlights a Nifty 50 near-term breakout following a completed ABCD harmonic structure and rising market breadth levels into mid-September 2025. Key Fibonacci resistance zones are mapped, with price targets up to 25,500 based on the 0.786 and 0.886 extension levels. The market breadth indicator signals an emerging bullish momentum, reinforcing potential continuation above recent highs if index breadth sustains above 60.
This format provides clarity, technical reference, and aligns with TradingView’s audience expectations for actionable trading insights.

Gold on Fire: Fed Rate Cuts & Global Tensions Fueling the Rally!Hello, fellow traders! Gold (XAU/USD) is on an absolute tear, closing strong at $3,680.80/oz on September 15, 2025, after hitting a new all-time high (ATH) of $3,685.39/oz. The past week has been solid, with gold up 1.6% as the US dollar weakened (down 0.3% to a one-week low) and US bond yields dropped. The market is buzzing with talk of a sure-shot 0.25% Fed rate cut on September 17, with some even betting on a bigger 0.5% move as per the CME FedWatch Tool. Plus, geopolitical tensions and reports of China easing gold import norms are adding more fuel to this fire. Let's do a deep dive and check out some solid trading setups! 💰
Fundamental Analysis: All That Glitters Is Gold! 🌟
Fed Rate Cuts: The latest US data is a mixed bag—the August CPI was hot, but the jobs market is cooling down. This is giving the Fed a clear signal to cut rates for the first time since December 2024. Lower interest rates are a big negative for the US Dollar, making non-yielding assets like gold super attractive. This is a classic "buy the rumor, sell the news" situation, but right now, the rumor is all about buying gold!
Geopolitical Jitters: The upcoming Fed meeting is quite tense, with political drama and a lot of pressure from the White House. This kind of uncertainty is gold's best friend, as it’s the ultimate safe-haven asset.
Chinese Demand: Recent reports suggest China is making it easier to import gold, which means more demand is coming from the world's biggest consumer. Strong buying from both official and private players in China is a major tailwind for gold's upward move.
Technical Analysis: Breaking All Barriers! 📉
Gold has smashed through the Fibo 2.618 level and is in uncharted territory. What's impressive is that the pullbacks are very shallow, just a $10 blip before it resumes its rally. This shows the bulls are in complete control, and selling pressure is minimal. The strategy is simple: look to buy on dips and be very selective about any shorting opportunities.
Resistance Levels: $3704, $3714, $3724
Support Levels: $3694, $3686, $3674, $3666
Trading Setups (Strict Risk Management Is Key):
Buy Scalp:
Zone: $3688 - $3686
SL: $3682
TP: $3691 - $3696 - $3701 - $3706
Buy Zone:
Zone: $3667 - $3665
SL: $3657
TP: $3675 - $3685 - $3695 - $3705 - $3715
Sell Scalp:
Zone: $3704 - $3706
SL: $3710
TP: $3701 - $3696 - $3691 - $3686
Sell Zone:
Zone: $3724 - $3726
SL: $3734
TP: $3716 - $3706 - $3696 - $3686 - $3676
Gold is at an ATH—so be careful of liquidity traps around the Fed announcement! Above $3694, the target is the sky; below, we could see a test of $3666. Manage your risk tightly before September 17! What's your plan: buy the dip or sell the top? Let me know your strategy in the comments! 👇
#Gold #XAUUSD #Fed #RateCuts #CPI #TradingView #MarketUpdate #Forex #Investing #TechnicalAnalysis #GoldTrading #Finance #Geopolitics #CentralBank

SupremeKeep an eye on Supreme CMP 4612; it looks good above 4680 and sustained, then we can see 5000/5200++
Potential Upside Stocks!
#Disclaimer: View shared it for educational purposes only.
Follow for more upcoming charts.

Railtel Corporation of India LtdDate 16.09.2025
Railtel
Timeframe : Day Chart
News Flash :
Government of India to announce tax exemption for Data Center companies/projects for the next 20 years
About
(1) Objective of creating nationwide broadband and VPN services, telecom, and multimedia network, to modernize the train control operation and safety system of Indian Railways.
(2) It is a "Navratna" PSU of the Government of India. At present, RailTel's network passes through around 6,000 stations across the country, covering all major commercial centers
Business Segments
(1) Project Work Services 59%
(2) Telecom Services 49%
Telecom Revenue Mix
(1) NLD: 47%
(2) ISP: 34%
(3) IP: 19%
Note*
(1) NLD : National Long Distance
(2) ISP : Internet Service Provider
(3) IP : Internet Protocol
Clientele
Ministry of Railways, SAIL, ONGC, Google, SECL, SBI, Bank of Baroda, Amazon, etc.
Order Book
Company has a total order book of Rs. 7000 Cr+ split across:
(1) State Govt: 40%
(2) Railways: 20%
(3) Govt Departments: 14%
(4) Coal: 9%
(5) Banking: 8%
(6) Others: 9%
Valuations
(1) Market Cap ₹ 12,634 Cr.
(2) Stock P/E 39.6
(3) ROCE 21.8 %
(4) ROE 16.5 %
(5) OPM 15%
(6) PEG 1.76
(7) Sales Growth 37% (y-o-y)
(8) Profit Growth 16% (y-o-y)
(9) Promoter 72%
Regards,
Ankur

Anant Raj Date 16.09.2025
Anant Raj
Timeframe : Day Chart
News Flash :
Government of India planning tax exemption for Data Centers companies/projects for the next 20 years
Remarks :
(1) Average traded volume/s in the last one year is 21,57,683 (21.57 lacs)
(2) On 15th September volume traded was 3,46,25,724 (3.46 cr)
(3) Forming Cup & Handle with breakout of 200 ema + ichimoku cloud
(4) Seems like under impulsive wave 3, any gap up opening will confirm that
Key Point
The company proposes to scale up its data center capacity to 307 MW within 5 to 6 years. As of Q3 FY25, it is developing 15 MW in Manesar and 7 MW in Panchkula, bringing the total IT load capacity under development to 22 MW.

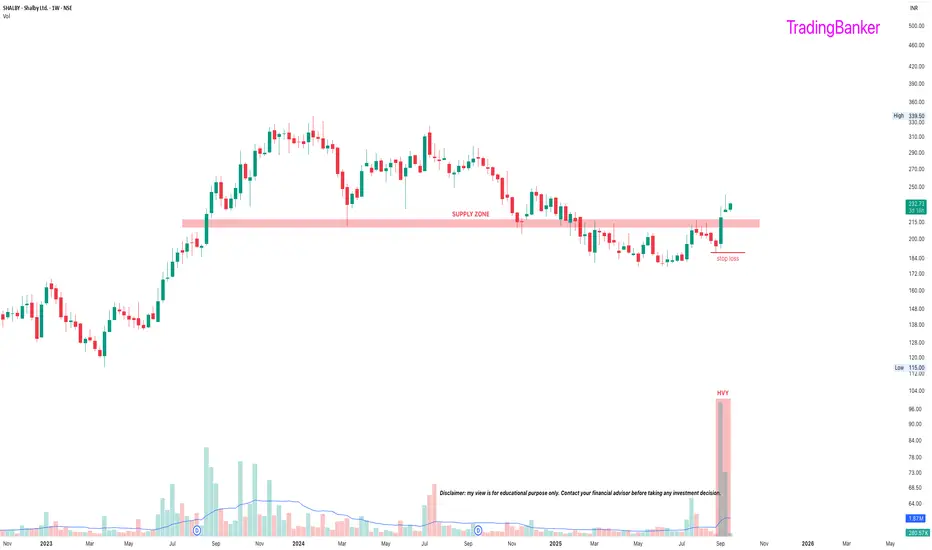
SHALBY: a probable longPros
-hospitals are a money minting machine attracting institutions (FII stake ⬆️)
-ARPOB (average revenue per occupied bed, one of the core metrics in hospitals)⬆️
-positive management commentary. for eg, aiming to improve profitability by reducing low margin schemes and focusssing on profitable schemes
-highest ever sales
-expanding through acquisitions, would eventually bring in the highest ever profits
-highest volumes of the year (week)
Cons
-SL needs risk management
-receivables > 6M = 20% of quarterly turnover (although some are from the government, they are still overdue)
Disc: Invested
Samvardhana Motherson International (NSE: MOTHERSON) – Rising BrTechnical Setup (1D Chart)
• Stock is trending higher for the 7th straight day, up ~3% to ₹107.8, and trading volume accelerated (~44 M shares)
• Price has broken above a key horizontal resistance around ₹107–108 (purple zone) and is now supported by an upward-sloping trendline connecting recent swing lows (~₹70 → ₹90 → ₹100)
• Next target zone lies near ₹115–120, followed by all-time high resistance around ₹144–145
Catalysts & Fundamentals
• Management reiterated its Vision 2030—targeting aggressive growth through auto and non-auto segments, including assembling cars by 2030
• FY26 plans: allocating 70% of ₹6,000 cr capex into non-auto verticals to diversify revenue streams
• Q4/FY25 financials: revenue grew ~8% YoY, but PAT dropped ~23%, weighed by rising expansion costs
• Strategic expansion underway: pursuing $2B acquisition of Marelli, though facing opposition from hedge fund Strategic Value Partners
Outlook & Expectation
Momentum remains bullish, with the strong breakout and support at ₹107–108. Short-term pullback is plausible if profit-taking appears, with support levels near ₹104–105 (pivot) and ₹100. If the breakout holds, price could test the ₹115–120 zone in the coming weeks. Watch for volume confirmation and any developments around the Marelli acquisition or diversification execution.

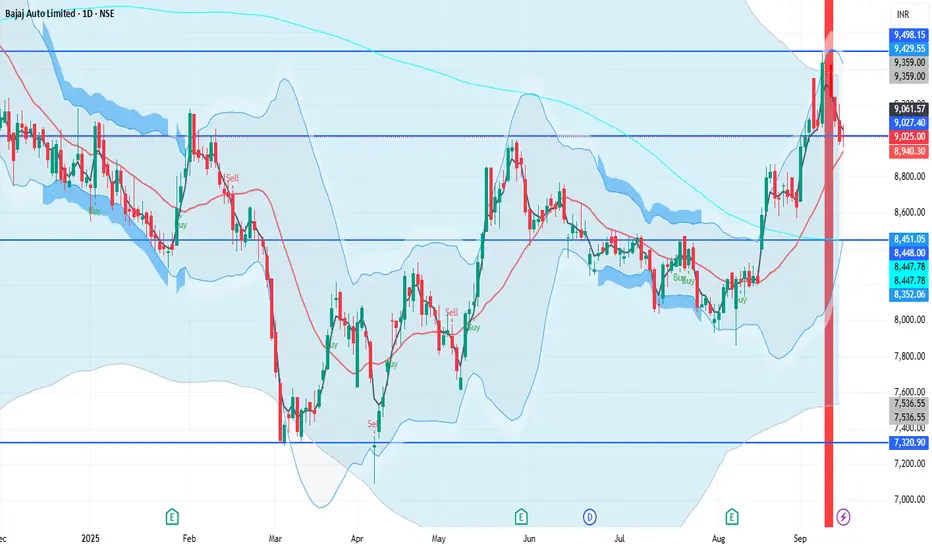
BAJAJ_AUTO 1D Time frameCurrent Price: ₹9,000 – ₹9,025
Day’s Range: ₹8,964 – ₹9,091.50
Previous Close: ₹8,999.50
🔹 Support & Resistance
Support 1: ₹8,950 – ₹8,900
Support 2: ₹8,800 – ₹8,750
Resistance 1: ₹9,050 – ₹9,100
Resistance 2: ₹9,200 – ₹9,250
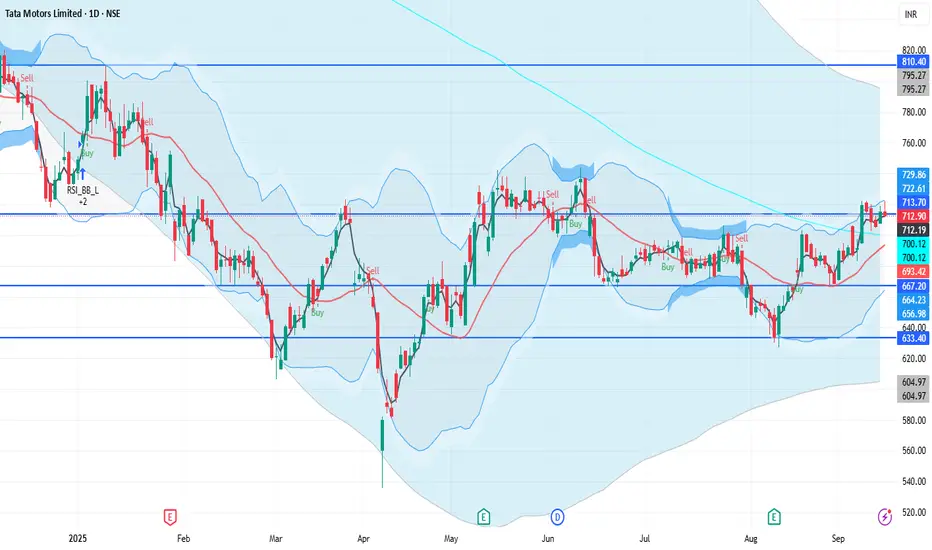
TATAMOTORS 1D Time frameUpdated Snapshot
Current Price: ₹712 – ₹715
Day’s Range: ₹712 – ₹721.95
Previous Close: ₹705.85
🔹 Support & Resistance
Support 1: ₹710 – ₹708
Support 2: ₹700 – ₹705
Resistance 1: ₹721 – ₹725
Resistance 2: ₹735 – ₹740
Gold Nears Peak: Fed Cuts & Tensions Fuel Indian Trades!Namaste, traders! Gold (XAU/USD) bounced from an early Asian dip at $3,626-$3,627 on Monday (15/09/2025), staying strong near record highs as weak US labor data locks in a 100% chance of a 0.25% Fed rate cut on 17/09, with two more expected in October and December (CME FedWatch). Geopolitical sparks—Ukraine hitting Russian energy and Iran pushing Qatar to counter Israel—make gold a top pick for Indian traders on MCX. With big central bank moves this week, let’s dive into the market and spot trading setups! 💰
Fundamental Analysis: Gold Shines for Indian Investors 🌟
Fed Rate Cut Fever: Weak US jobs (surging claims, 911,000 jobs revised down) keep USD near its 24/07 low and Treasury yields soft, driving gold’s 39% YTD rally—perfect for INR portfolios. The Fed’s set for three rate cuts in 2025, starting 17/09.
Geopolitical Boost: Ukraine’s energy strikes on Russia, US pushing NATO sanctions, and Iran’s missile talk in Qatar ahead of the Arab-Islamic summit fuel gold’s safe-haven demand. China’s relaxed gold import rules add more bullish vibes for MCX traders!
Key Events: Watch Fed Chair Jerome Powell’s comments (17/09), Bank of Canada, Bank of England (18/09), and Bank of Japan (19/09) decisions. Soft CPI and labor data mean dips are buying opportunities—don’t miss out!
Technical Analysis: Sideways Near Highs – Buy Dips 📉
Gold’s consolidating in a wide sideways range on M30, H1, H2 around 3650. If Fed news triggers a sharp drop, FVG zones (3608-3598) are prime for buying. Watch volume to confirm entries and dodge liquidity traps near round levels.
Resistance: 3646 - 3655 - 3666
Support: 3623 - 3615 - 3608 - 3598
Trade Setups (Tight RR):
Buy Scalp:
Range: 3623 - 3621
SL: 3617
TP: 3626 - 3631 - 3636 - 3641
Buy Zone:
Range: 3608 - 3606
SL: 3598
TP: 3616 - 3626 - 3636 - 3646
Sell Scalp:
Range: 3654 - 3656
SL: 3660
TP: 3651 - 3646 - 3641 - 3636
Sell Zone:
Range: 3665 - 3667
SL: 3675
TP: 3657 - 3647 - 3637 - 3627
Gold’s holding near highs—beware liquidity traps around Fed news! Above 3623, bulls aim for new highs; below, test 3608/3598. Indian traders, keep risk tight with central bank volatility ahead! Buy dips or sell highs? Share your MCX strategies below! 👇
#Gold #XAUUSD #Fed #RateCuts #CPI #TradingView #MarketUpdate #Forex #GoldTrading #IndiaTrading #MCX #Geopolitics #CentralBanks

HDFCBANK 1D Time framePrice Action
Current Price: ₹967.10 (approx)
Day’s Range: ₹965 – ₹970
52-Week Range: ₹806.50 – ₹1,018.85
🔹 Support & Resistance
Immediate Support: ₹960 – ₹958
Next Support: ₹954 – ₹950
Immediate Resistance: ₹970 – ₹975
Higher Resistance: ₹980

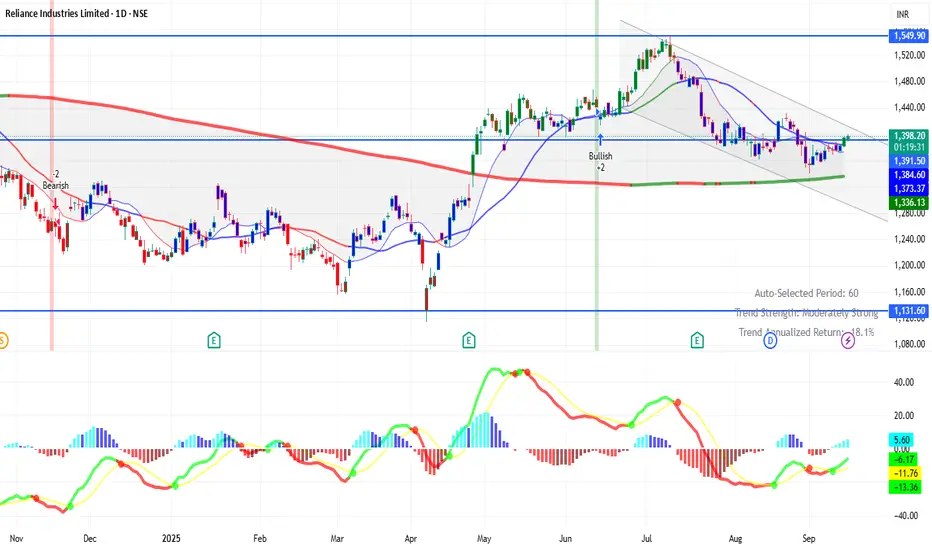
RELIANCE 1D Time framePrice Action
Current Price: ₹1,392 – ₹1,395 (approx)
Previous Close: ₹1,383.50
52-Week Range: ₹1,114.85 – ₹1,551.00
🔹 Support & Resistance
Immediate Support: ₹1,385 – ₹1,375
Next Support: ₹1,369
Immediate Resistance: ₹1,400 – ₹1,406
Next Resistance: ₹1,417