What is ADR/GDR – How Indian Companies Get Foreign Investors!Hello Traders!
You may have heard terms like ADR and GDR when companies talk about raising money abroad. These instruments allow Indian companies to get international investors without directly listing on foreign stock exchanges. Let’s understand them in simple words.
What is an ADR?
ADR stands for American Depository Receipt .
It is a certificate issued by a US bank that represents shares of a foreign company (like an Indian company). These ADRs trade on US stock exchanges just like normal US stocks.
Example: Infosys and Wipro have ADRs listed in the US.
Advantage: US investors can buy Indian companies without dealing with Indian exchanges.
What is a GDR?
GDR stands for Global Depository Receipt .
It works the same way as ADR, but instead of being limited to the US, GDRs are listed on global exchanges like London or Luxembourg.
Example: Many Indian companies raise funds through GDRs in Europe.
Advantage: Gives access to a larger pool of foreign investors.
Why Do Companies Issue ADR/GDR?
Access to Foreign Capital: Helps Indian companies raise funds from global investors.
Better Visibility: Being listed abroad increases global recognition of the company.
Diversified Investor Base: Attracts institutional investors who may not invest directly in Indian markets.
Liquidity: Allows more trading activity and easier buying/selling internationally.
Rahul’s Tip:
ADR/GDR listings are a sign that a company wants to expand globally and attract foreign capital. But as an investor, always check if the company is fundamentally strong before getting influenced by the “global listing” tag.
Conclusion:
ADR and GDR are simple tools that connect Indian companies with foreign investors.
While ADRs are limited to the US, GDRs open doors to global markets.
For long-term investors, these instruments show how Indian companies are scaling globally.
If this post made ADR/GDR clear for you, like it, share your thoughts in comments, and follow for more market education in simple language!
Fundamental Analysis
Stock Market is in Risk OnThe US market, as well as some assets, is in a risk-on mode.
Most assets have their own seasonality.
The chart above shows one of them:
In recent years, in the period July-September, a correction began on the US market.
A number of macro indicators also speak in favor of a correction and that it is overdue.
Risk appetite according to Morgan Stanley research has reached a historical maximum
Although seasonality does not guarantee a correction right here and now, but at least it gives reason to think about reducing long positions

We are not positive about TeslaThe impact of tariffs and expiring EV credits is expected to pressure future US deliveries and regulatory credit revenue in the near term
Elon Musk: Well, we're in this weird transition period where we will lose a lot of incentives in the US. Slab incentives actually in many other parts of the world. But we'll lose them in the US. Across all of it at the relatively early stages of autonomy. On the other hand, autonomy is most advanced and most available from a regulatory standpoint in the US. Does that mean we could have a few rough quarters? Yeah. We probably could have a few rough quarters. I'm not saying that we will, but we could. Q4, Q1, maybe Q2.
Revenue -12% y/y ( decline for the first time in 10 years)!!!
EPS 0,27 $ agj vs 0,39 $ estimated
FCF -89% y/y but still positive ( just 146 M$)
CAPEX for 2025 increased
EBITDA dropped by 7.8%.
Price to Sales 12,7
P/B 14
Expensive
We expect declining of the stock price to 210 $
And, yes, many still regard Tesla as a car manufacturer, but this is not a correct view of the company. Later in our blog we will touch on the question of how to correctly look at the brainchild of Elon Musk.

Bearish Trade Setup for SOLUSDOverview:
This is a short position on SOLUSD, entering on the 1-hour chart with a well-defined risk-to-reward ratio. The trade is based on a downward trend confirmed by the price action and EMAs, making this a high-probability bearish scenario.
Key Levels and Indicators:
Entry Point: 186.6736
The entry is triggered when the price moves below the resistance level. This confirms the continuation of the downtrend.
Stop Loss: 202.2042
The stop loss is set above the most recent swing high to protect from any sudden price reversals. This level is designed to avoid a whipsaw and ensures the trade is kept within a reasonable risk range.
Target: 155.5356
The target is calculated based on a projected price movement in line with the current trend. Given the current market structure, this target provides an optimal reward-to-risk ratio.
Why is this a Bearish Setup?
Trend Confirmation:
The price has been consistently moving lower, showing strong bearish momentum. The EMAs (9 and 20) are also sloping downwards, reinforcing the likelihood of further downside movement.
Price Action:
The recent price action has formed lower highs and lower lows, a key indication of a strong downtrend.
EMA Alignment:
The 9-period EMA (188.6387) is below the 20-period EMA (192.3233), a classic bearish crossover that confirms the downward bias of the market.
Risk-to-Reward Setup:
The trade offers an excellent risk-to-reward ratio of approximately 1:3, which ensures that potential profits outweigh the risk taken on the trade.
Trade Management:
Entry Criteria: Enter the position when the price breaks below the support zone, ideally near the entry point.
Exit Strategy: Target is set at 155.5356, but keep an eye on the price action in case a trend reversal occurs before hitting the target. Always adjust the stop loss to lock in profits as the price moves in your favor.
Final Thoughts:
This is a well-structured bearish trade idea based on both technical analysis and price action. Always ensure that you follow proper risk management rules and adjust your stop loss or take profit levels based on market conditions.

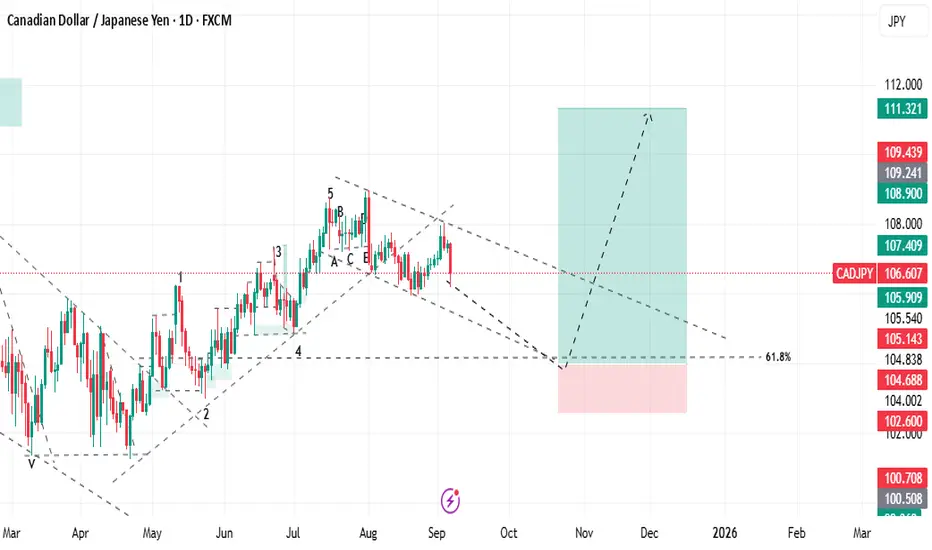
BUY CADJPY🚀 BUY CADJPY
Entry: 104.002
TP: 111.321 🎯
SL: 102.600 🛑
Bullish momentum in play — targeting higher levels! 📈
#CADJPY #ForexSignals #BuySignal #ForexTrading #PriceAction #ForexSetup #TradingSignal #ForexLife #Pips
Part 6 Learn Institutional Trading Factors Affecting Option Prices
Option premiums are influenced by multiple factors:
Underlying Price: Moves directly impact intrinsic value.
Time to Expiry: Longer duration = higher premium (more time value).
Volatility: Higher volatility = higher premium (more uncertainty).
Interest Rates & Dividends: Minor factors but can influence pricing.
The famous Black-Scholes Model is often used to calculate theoretical option prices.
Basic Option Strategies for Beginners
Here are some simple strategies you can start with:
1. Buying Calls
Use when you expect the stock/index to rise.
Risk: Premium loss.
Reward: Unlimited upside.
2. Buying Puts
Use when you expect the stock/index to fall.
Risk: Premium loss.
Reward: Significant downside profits.
3. Covered Call
Own a stock + Sell a call option on it.
Generates income but caps upside.
4. Protective Put
Buy stock + Buy a put option.
Acts like insurance for your stock portfolio.
5. Straddle (Advanced Beginner)
Buy a call and put with the same strike and expiry.
Profits from big moves in either direction.
Risk: Both premiums lost if market stays flat.

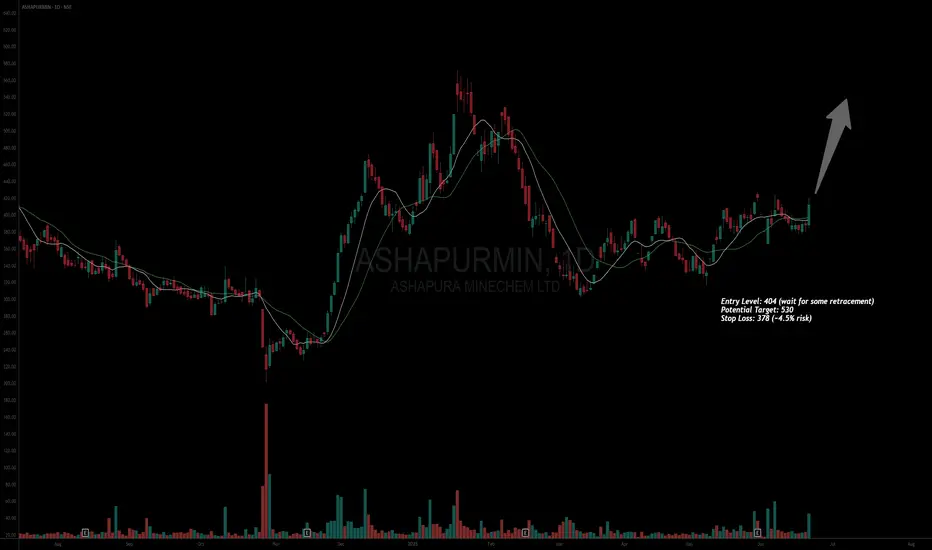
#ASHAPURMINAsset: Ashapura Minechem Ltd (ASHAPURMIN)
Entry Level: 404 (wait for some retracement)
Potential Target: 530
Stop Loss: 378 (~4.5% risk)
Timeframe: Short to Medium term
Risk to Reward ratio : 1:8
Rationale:
Fundamentals -
Fundamentally decent stock with the following attributes:
* ROCE - 17.1%
* ROE - 26.6%
* Debt to Equity - 0.94
* Stock PE 13.6 / Industry PE - 15.8 || Stock PBV 3.17 / Industry PBV 2.01 - Company is slightly underpriced
* EPS / Revenue - Increasing but pretty flat
* ADR is 4%
Technicals -
* Overall structure - Price is making a VCP pattern. The moving averages have aligned properly to create a launch pad. Price moved up 6% in the last trading session indicating potential beginning of institutional buying.
* Relative Strength is picking up.
* Multiple timeframe analysis - Weekly structure is surfing the 10 WMA
* Volumes have remained subdued and even in the last trading session it did not move much
Market analysis
* Promoter holding has gone up and the pledged shares have been bought back
* MFs, DIIs and FIIs have all started to increase their holding with FIIs being the highest
* Retail holding is going down
* Coal and Mining sector is seeing some positive movement in other stocks
Cons
* Volumes have remained tight and momentum is slow.
* Recommended to pyramid up in this stock
This analysis is for educational purposes only and should not be considered as financial advice. Trading and investing in financial markets involve significant risk, and past performance is not indicative of future results. You should conduct your own research and consult with a qualified financial advisor before making any trading or investment decisions. The author is not responsible for any financial losses or damages that may result from the use of this information.
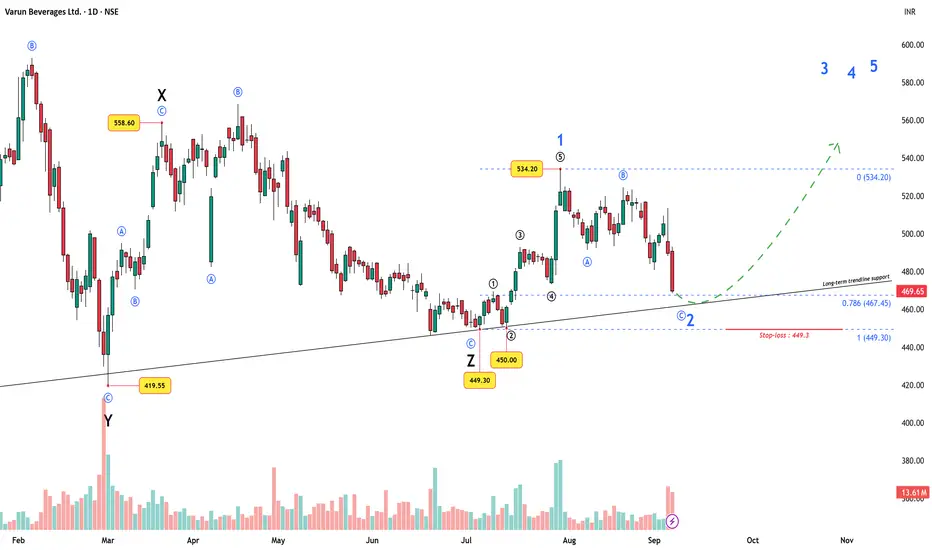
Varun Beverages Ltd – Wave 2 Setup at Trendline SupportVarun Beverages Ltd. (VBL), PepsiCo’s second-largest global bottling partner, has been through a long and exhausting corrective phase. On the Elliott Wave chart, this stretched out as a W–X–Y–X–Z sequence, finally bottoming out at ₹449.3 .
On the current chart you may not clearly see the entire W–X–Y–X–Z sequence, as it plays out on a slightly smaller scale — but it has been marked.
From that final low of ₹449.3, price started a fresh impulse :
Wave 1 up, then a tiny Wave 2 ending at ₹450 (just above the start of Wave 1).
A smooth, non-overlapping Wave 3, 4, and 5 followed, with Wave 5 topping at ₹534.20.
This whole structure completes a higher-degree Wave 1 .
The current decline from ₹534.20 is unfolding as a classic ABC zigzag , which fits perfectly as a Wave 2 correction .
Why this zone matters
Fibonacci retracement: Price is now testing the 0.786 retrace of the entire rally (449.3 → 534.2).
Trendline support: Aligns with a long-term rising trendline.
Invalidation: As per Elliott rules, Wave 2 cannot break below 449.3 (start of Wave 1). That level is the final stop-loss.
Trading roadmap
Entry Zone: Around 467–470 (Fib + trendline confluence).
Stop-loss: 449.3 (Wave 1 origin).
Targets: A move above 534.20 would confirm Wave 3 is in progress, with further Wave 4 and Wave 5 projections to be plotted as price action evolves.
This makes the setup very attractive from a risk–reward perspective : a tight stop vs. potentially large upside.
Fundamentals lining up
VBL just incorporated its joint venture with White Peak Refrigeration Pvt. Ltd . for visi-coolers and refrigeration equipment.
Q2 CY2025: despite a 3% volume dip, revenue grew 2.5% and net profit rose 5% , aided by efficiencies and lower finance costs.
International volumes (esp. South Africa, +16%) remain strong.
So, while the chart points to a possible Wave 2 bottom , the fundamentals also provide support.
(Source: in.tradingview.com)
Conclusion
If support holds at current levels, Varun Beverages could be setting up for a strong Wave 3 rally . If ₹449.3 is breached , the bullish impulse count is invalid and the structure must be re-evaluated.
Disclaimer: This analysis is for educational purposes only and does not constitute investment advice. Please do your own research (DYOR) before making any trading decisions.
Part 2 Support and ResistanceOption Trading in India
India has seen a boom in retail options trading.
1. Exchanges
NSE (National Stock Exchange): Leader in index & stock options.
BSE (Bombay Stock Exchange): Smaller but growing.
2. Popular Underlyings
Nifty 50 Options (most liquid).
Bank Nifty Options (very volatile).
Stock Options (Infosys, Reliance, HDFC Bank, etc.).
3. SEBI Regulations
Compulsory margin requirements.
Weekly index expiries (Thursday).
Physical settlement of stock options at expiry.
Put Options (Right to Sell)
A Put Option gives the holder the right to sell at a strike price. Used when expecting prices to fall.
Example: Buying Infosys ₹1,500 Put at ₹50 premium pays off if Infosys drops below ₹1,450.
Option Market Participants
Hedgers: Reduce risk by using options as insurance. (e.g., farmer hedging crop price, or investor protecting stock portfolio).
Speculators: Bet on price movements to earn profits.
Arbitrageurs: Exploit price differences across markets.
Writers (Sellers): Earn premium by selling options but take on higher risks.

Option Trading The Mechanics of Option Pricing
1. Intrinsic Value vs. Time Value
Intrinsic Value: The profit if the option were exercised now.
Time Value: The extra value due to remaining time until expiry.
Option Premium = Intrinsic Value + Time Value.
2. Moneyness of Options
In the Money (ITM): Immediate profit if exercised.
At the Money (ATM): Strike ≈ Current price.
Out of the Money (OTM): No immediate profit, only time value.
3. Option Greeks (The DNA of Options)
Delta: Sensitivity of option price to underlying movement.
Gamma: Sensitivity of Delta to underlying movement.
Theta: Time decay – options lose value as expiry nears.
Vega: Sensitivity to volatility.
Rho: Sensitivity to interest rates.
Understanding Greeks is critical for advanced traders.
Risks in Option Trading
Options are not risk-free.
Premium Decay (Theta Risk): Options lose value daily.
Volatility Risk: Implied volatility crush can hurt positions.
Liquidity Risk: Wide bid-ask spreads increase costs.
Assignment Risk: Writers can be forced to fulfill contracts.
Unlimited Losses: Naked option selling is dangerous.

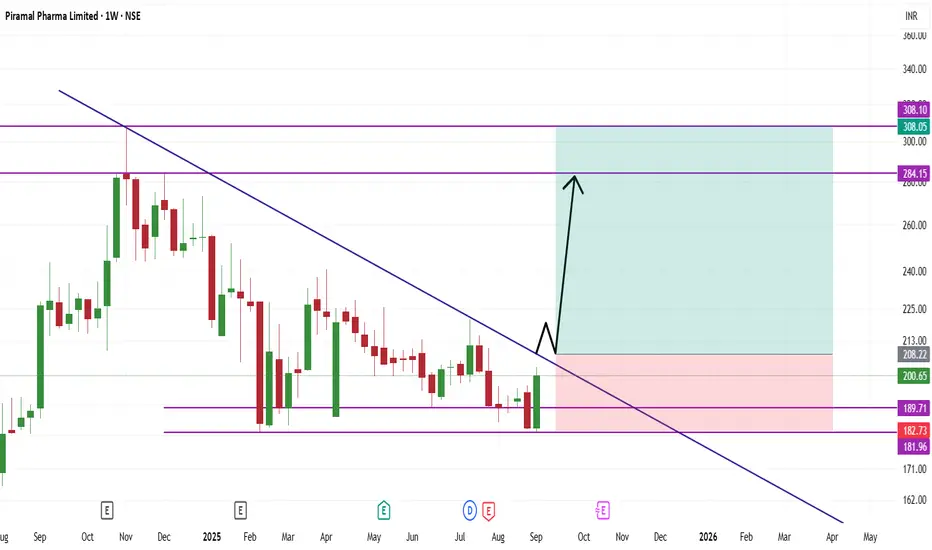
Piramal Pharma Limited Trade Information
Traded Volume (Lakhs) 27.39
Traded Value (₹ Cr.) 55.02
Total Market Cap (₹ Cr.) 26,850.81
Free Float Market Cap (₹ Cr.) 12,472.07
Impact cost 0.04
% of Deliverable / Traded
Quantity 36.39 %
Applicable Margin Rate 19.92
Face Value 10.00
Price Information
52 Week High (06-Nov-2024) 307.90
52 Week Low (14-Feb-2025) 181.73
Upper Band 218.87
Lower Band 179.08
Price Band (%) No Band
Tick Size 0.01
Securities Information
Status Listed
Trading Status Active
Date of Listing 19-Oct-2022
Adjusted P/E 27,623.23
Symbol P/E 912.99
Index NIFTY SMALLCAP 250
Basic Industry Pharmaceuticals
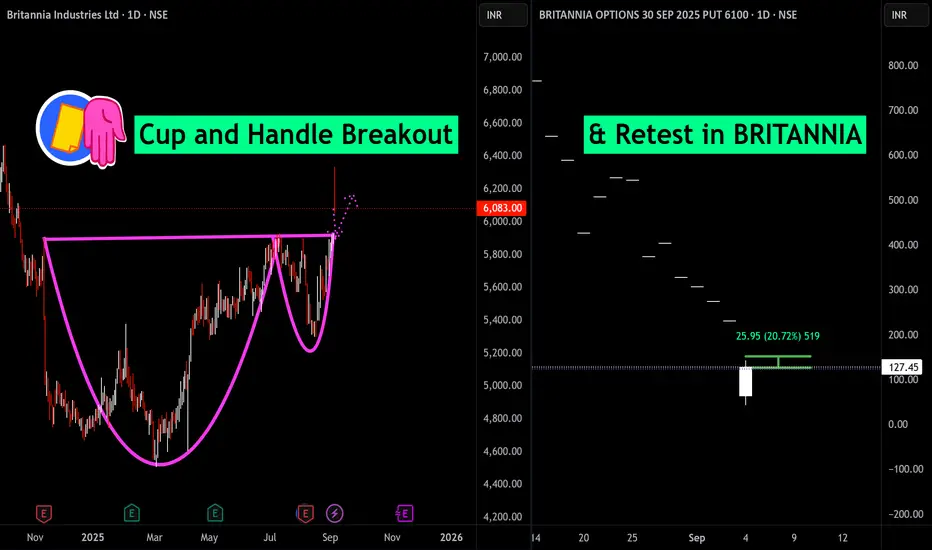
Cup and Handle Breakout & Retest in BRITANNIABritannia Industries has delivered a textbook Cup and Handle breakout on its daily chart, signaling renewed bullish momentum and the potential for higher highs ahead. After months of base-building, the stock surged above the key resistance level near ₹6,083, confirming the breakout with strong volume and a sharp price spike. This technical pattern often foreshadows continued upward movement, as buyers regain control following consolidation.
On the right, the Britannia 6100 September PUT option chart highlights a significant retest, with the PUT price dropping over 44% today, indicating strong bullish sentiment in the underlying stock. The sharp drop in the PUT’s value reinforces the breakout’s validity, since a falling PUT price typically aligns with rising equity prices.
Overall, Britannia’s decisive close above resistance and the synchronized retreat in bearish option premiums underscore an emerging uptrend. Traders may watch for continuation above ₹6,083 while managing risk near the breakout level.
Gold Slips After Peak: Trade Fed Uncertainty & Jobs Report!Hello traders! Gold (XAU/USD) pulled back on Thursday (04/09/2025) as investors took profits after its record-breaking rally, with focus now shifting to the upcoming US jobs report for fresh signals on the Fed’s policy path. Spot gold closed down 0.3% at $3,547.68/oz—is this a buying dip or a reversal? Let’s dive in and uncover trading setups! 💰
Fundamental Analysis: What’s Behind Gold’s Dip & Potential Rebound? 🌟
Profit-Taking Post-Record: Gold eased after hitting an all-time high of $3,578.50/oz on 03/09, driven by weak job openings data that bolstered rate cut bets and ongoing uncertainty fueling safe-haven demand. 📉
US Jobs Report Looms: Set for release tomorrow (05/09), this key report follows early-session data showing US jobless claims rising more than expected last week, signaling a softening labor market.
Fed Signals & Rate Cut Buzz: Several Fed officials on 03/09 highlighted labor market concerns, reinforcing confidence in rate cuts. Markets now see a 98% chance of a 0.25% rate cut this month, per CME FedWatch. As a non-yielding asset, gold thrives in low-rate and uncertain environments! 🏦
Fed Drama Heats Up: Trump’s attempt to fire Fed Governor Lisa Cook has sparked a serious legal challenge, raising fresh concerns about Fed independence. Coupled with tariff tensions (Trump’s appealing to the Supreme Court after two lower court losses), this is eroding USD asset confidence and boosting gold demand.
Bullish Outlook: Standard Chartered predicts further gains, citing persistent tariff uncertainty and Fed independence fears as key safe-haven drivers.
Technical Analysis: Consolidation Before Big Data—Buy Dips or Wait? 📉
Gold has been trading in an uptrend channel, with early-session accumulation. After a strong Asian session push, it hit the 356x OB zone and dropped quickly. The European session may see sideways action, awaiting tonight’s critical data. If gold holds the channel, bulls could take charge—watch for breakouts!
Key Resistance: 3560 - 3576 - 3586
Key Support: 3540 - 3526 - 3500 - 3490 - 3476
Trading Opportunities:
Sell Scalp: 3558 - 3560
SL: 3564
TP: 3555 - 3545 - 3535
Sell Zone: 3576 - 3578
SL: 3587
TP: 3568 - 3558 - 3548 - 3538
Buy Scalp: 3526 - 3524
SL: 3520
TP: 3529 - 3539 - 3549
Buy Zone: 3500 - 3498
SL: 3490
TP: 3508 - 3518 - 3518 - 3538
Gold’s in consolidation mode, but the jobs report could trigger a breakout—manage risk tightly! If it holds above supports, bulls may push for new highs post-data. 📊💡
#Gold #XAUUSD #Fed #USJobs #TradingView #MarketUpdate #Forex #Investing #TechnicalAnalysis #GoldTrading #Finance #Crypto

Trade the Fed Drama & Jobs Data Wave!Fundamental Analysis: Why Gold’s Rally Is Unstoppable 🌟
Historic Surge: Gold soared to an all-time high before US jobs data showed a sharper-than-expected drop in July 2025 openings and steady hiring, pointing to a softening labor market. This fueled gold’s rise, with $3,600/oz as the next target. 📈
Fed Rate Cut Fever: Post-data, the odds of a 0.25% rate cut at the Fed’s Sept 16-17 meeting jumped from 92% to 98%, per CME FedWatch. Fed Governor Christopher Waller stressed the need for a cut this month, with future moves tied to economic trends. 🏦
Key Data Ahead: All eyes are on today’s (04/09) ADP employment and US jobless claims, plus the big monthly payrolls report on 05/09. These could steer the Fed’s path and gold’s trajectory.
Fed Drama Boosts Gold: On Sept 3, Fed Governor Lisa Cook pushed back against Trump’s attempt to oust her, while Trump keeps slamming Chair Jerome Powell for not cutting rates. Worries about Fed independence are shaking confidence in USD assets, making gold the go-to safe haven. Trump’s also gearing up to appeal tariffs to the Supreme Court after two lower court losses. ⚖️🇺🇸
Gold’s Sweet Spot: As a non-yielding asset, gold shines in uncertain times and low-rate environments—perfect for India’s gold-loving market!
Technical Analysis: Bullish Run Continues, Buy Dips but Watch Reversals! 📉
After the Asian session opened, gold plunged to the 351x zone before bouncing back above 352x. This could be big players flushing out retail liquidity—a classic move during relentless all-time highs (ATHs) that create large FVGs. Stick to BUY if gold holds above 352x, but if it fails to break 365x today, brace for a SELL reversal, especially with ADP Nonfarm data incoming. Stay sharp for volatility!
Key Resistance: 3545 - 3561 - 3578 - 3586 - 3596
Key Support: 3521 - 3508 - 3493 - 3475
Trading Opportunities:
Sell Scalp: 3560-3562
SL: 3566
TP: 3557 - 3552 - 3547
Sell Zone: 3594 - 3596
SL: 3604
TP: 3586 - 3576 - 3566 - 3566 - 3546
Buy Scalp: 3508 - 3506
SL: 3502
TP: 3511 - 3516 - 3521
Buy Zone: 3493 - 3491
SL: 3483
TP: 3501 - 3511 - 3521 - 3531 - Open
Gold is blazing, but today’s data could shake things up—keep your risk tight! If it stays above 352x, bulls might charge to new highs. 📊💡

The Art of Position SizingIntroduction: Why Position Sizing is the Silent Weapon
When most people think about trading success, they picture things like stock picking, finding the next multibagger, or timing the market perfectly. But the truth is, none of these alone will make you a consistently profitable trader. The difference between traders who survive and thrive versus those who blow up their accounts often comes down to one thing: position sizing.
Position sizing is the art and science of deciding how much to risk on a trade. It’s not glamorous. It doesn’t make headlines like “XYZ stock doubled in a week.” But it’s the most powerful tool you have for controlling risk, managing emotions, and growing capital over the long term.
Think of trading like sailing. The market is the ocean — unpredictable, sometimes calm, sometimes stormy. Your strategy is the ship. But position sizing? That’s the steering wheel. Without it, even the strongest ship can sink.
In this article, we’ll dive deep into the art of position sizing, explore different methods, psychological aspects, and real-world applications, and by the end, you’ll understand why smart traders say: “It’s not about being right, it’s about surviving long enough to grow.”
What is Position Sizing?
In simple terms, position sizing answers the question:
“How many shares (or contracts/lots) should I buy or sell on this trade?”
Let’s take an example. Suppose you have ₹1,00,000 as trading capital. You see a stock trading at ₹500 and want to buy. Should you buy 20 shares, 100 shares, or go all-in with 200 shares? The answer depends on:
Your risk tolerance per trade (how much you’re comfortable losing if it goes wrong).
Your stop-loss level (the price at which you’ll exit if the trade fails).
Market conditions (volatility, liquidity, trend strength).
Two traders can take the exact same trade setup — same entry and exit — but one could lose 50% of his account, while the other loses just 1%. That’s the power of position sizing.
The Role of Risk Management in Position Sizing
Before we dive into methods, let’s lay the foundation: risk management.
The golden rule in trading: Never risk more than a small fraction of your capital on a single trade.
Commonly used: 1% Rule or 2% Rule.
Risk 1% of your account per trade.
Example: If you have ₹1,00,000, risk only ₹1,000 per trade.
Now, here’s the beauty: By limiting risk per trade, even if you face a losing streak, you can still survive.
Imagine you risk 10% of your capital per trade. After just 10 losing trades, your account is wiped out. But if you risk 1% per trade, you’d need 100 consecutive losing trades to lose everything. That’s survival power.
Position Sizing Methods
There’s no one-size-fits-all approach. Traders use different methods depending on style, psychology, and goals. Let’s go through the major ones:
1. Fixed Dollar Method
Decide a fixed amount to risk on every trade.
Example: “I’ll risk ₹2,000 per trade no matter what.”
Simple but not flexible. Works for beginners.
2. Fixed Percentage Method
Risk a set percentage of account equity per trade.
Example: 2% risk rule. If account = ₹1,00,000 → risk = ₹2,000.
Dynamic: As account grows, risk amount grows.
3. Kelly Criterion
A mathematical formula to maximize long-term growth by balancing win rate and risk-reward.
Powerful, but aggressive.
Example: If you win 60% of trades with 2:1 reward/risk, Kelly suggests a certain % of capital to risk.
Many traders use half-Kelly for safety.
4. Volatility-Based Position Sizing
Position size adjusts to stock volatility.
Use ATR (Average True Range) or standard deviation.
More volatile stocks → smaller size.
Less volatile → larger size.
Helps normalize risk across different stocks.
5. Risk/Reward-Driven Sizing
Position based on expected reward vs. risk.
Example: If reward:risk is 3:1, you may size slightly larger.
Ensures high probability trades get priority.
6. Scaling In & Out
Scaling in: Enter gradually, adding positions as trade confirms.
Scaling out: Reduce position as profit builds, locking gains.
Useful in trending or uncertain markets.
Mathematical Foundations
Let’s go step by step:
Formula:
Position Size = (Account Risk per Trade) ÷ (Trade Risk per Share)
Account Risk per Trade = % of account × account size.
Trade Risk per Share = Entry Price – Stop Loss.
Example:
Account = ₹1,00,000.
Risk per trade = 2% = ₹2,000.
Stock entry = ₹500, Stop loss = ₹490 → Risk per share = ₹10.
Position size = ₹2,000 ÷ ₹10 = 200 shares.
This formula keeps every trade within safe limits, regardless of stock price.
Psychology of Position Sizing
This is where most traders fail. Even with formulas, emotions creep in:
Greed: “This setup looks perfect, let me double my size.”
Fear: “I just had three losses; let me reduce my size drastically.”
Overconfidence: After a winning streak, traders often oversize.
Revenge trading: Going all-in after losses to “win it back.”
The art of position sizing isn’t just math — it’s discipline. Sticking to your rules despite emotions is what separates pros from amateurs.
Position Sizing in Different Trading Styles
Day Trading: Smaller time frames, quick exits. Use tight stop-loss → often larger position sizes.
Swing Trading: Wider stop-loss, overnight risks. Position size smaller to balance.
Long-Term Investing: Position sizing matters less per trade, but diversification becomes key.
Options & Futures: Leverage complicates sizing. Need margin-based calculations and higher discipline.
Adapting Position Sizing to Market Conditions
High Volatility Markets: Reduce position size. Survive turbulence.
Calm/Trending Markets: Increase size cautiously to capture trends.
During Losing Streaks: Reduce size temporarily to preserve confidence and capital.
During Winning Streaks: Carefully increase size, but avoid over-leverage.
Position Sizing Mistakes to Avoid
All-in mentality.
One bad trade can end your career.
Averaging down blindly.
Throwing good money after bad.
Ignoring correlations.
Buying 3 different banking stocks = concentration risk.
Sizing based on gut feel, not rules.
Leads to inconsistency.
Case Studies & Practical Examples
The Blow-Up Trader
Started with ₹2,00,000. Risked 20% per trade. After 5 losses, wiped out.
Lesson: Poor position sizing = fast death.
The Survivor Trader
Started with ₹2,00,000. Risked 1% per trade = ₹2,000.
Even after 10 losses, only down 10%. Account intact.
Lesson: Survival > glory.
The Professional Fund Manager
Doesn’t risk more than 0.5%–1% per trade.
Manages billions, but each trade is just a small piece.
Lesson: Longevity and risk control matter most.
Position Sizing as an Art
So far, we’ve discussed the science — formulas, rules, risk percentages. But in real life, position sizing is also an art.
It requires judgment — when to size up, when to stay small.
It requires psychological control — sticking to plans.
It requires adaptability — markets change, volatility changes.
Great traders think of position sizing like a volume knob: turning risk up and down depending on conditions, but never letting it break the system.
Conclusion
At its core, position sizing is about survival first, profits second. You can have the best strategy in the world, but without proper sizing, you’ll blow up before you can reap the rewards.
The art of position sizing is:
Mathematical discipline (formulas, risk per trade).
Psychological discipline (controlling greed/fear).
Strategic flexibility (adapting to markets).
So next time you’re about to hit “buy” or “sell,” ask yourself:
How much am I risking?
Is this within my rules?
If I lose, can I survive to trade another day?
Because in trading, the ultimate goal isn’t to win one big trade.
The ultimate goal is to stay in the game long enough to let compounding work its magic.

Crude oil - Sell around 64.00, target 62.00-60.00Crude Oil Market Analysis:
Crude oil is still experiencing a recent correction in daily price action. We should consider continuing to sell on any rebounds. Previous crude oil contracts and inventories haven't changed the trend, and recent data doesn't support it. I predict it will be difficult to reverse the weak selling trend in the short term. Today, we're considering selling around 64.00.
Fundamental Analysis:
Recent fundamentals haven't significantly stimulated the market. Today, we'll focus on the US non-farm payroll data.
Trading Recommendations:
Crude oil - Sell around 64.00, target 62.00-60.00

Navin Fluorine: Supply Zone Breakout Sparks RallyTechnical Analysis
Navin Fluorine Ltd has demonstrated an extraordinary long-term growth trajectory, showcasing a super bullish rally from below ₹100 levels to the current ₹5,000 zone - representing an exceptional 50x growth over the years.
The ₹4,700-₹5,000 zone has been acting as a formidable supply zone over the past year, creating multiple rejection points. However, the game-changing moment arrived with very strong positive Q1 FY26 results that provided the fundamental catalyst needed for a decisive breakout.
With this confirmation, the stock successfully broke above the supply zone and surged to ₹5,444 before pulling back to current levels of ₹4,843. The key now is whether the previous supply zone transforms into a demand zone with bullish candlestick pattern confirmations.
Entry Strategy: Enter on any dips toward ₹4,700-₹4,800 range, ensuring the old supply zone acts as new demand zone.
Targets:
Target 1: ₹5,500
Target 2: ₹6,000
Target 3: ₹6,500
Stop Losses:
Critical Support: ₹4,700-₹5,000 (previous supply zone, now key demand zone)
If stock doesn't sustain above this zone, no more expectations on this stock.
Q1 FY26 Financial Highlights (vs Q4 FY25 & Q1 FY25)
Total Income: ₹725 Cr (↑ +3% QoQ from ₹701 Cr; ↑ +38% YoY from ₹524 Cr)
Total Expenses: ₹519 Cr (↓ -1% QoQ from ₹522 Cr; ↑ +23% YoY from ₹423 Cr)
Operating Profit: ₹207 Cr (↑ +16% QoQ from ₹179 Cr; ↑ +107% YoY from ₹100 Cr)
Profit Before Tax: ₹155 Cr (↑ +22% QoQ from ₹127 Cr; ↑ +128% YoY from ₹68 Cr)
Profit After Tax: ₹117 Cr (↑ +23% QoQ from ₹95 Cr; ↑ +129% YoY from ₹51 Cr)
Diluted EPS: ₹23.62 (↑ +23% QoQ from ₹19.15; ↑ +129% YoY from ₹10.32)
Fundamental Highlights
Navin Fluorine delivered spectacular Q1 FY26 performance with PAT soaring 129% YoY to ₹117 crore, driven by robust revenue growth of 38.5% to ₹725.40 crore. The company is recognized among the fastest-growing specialty chemical stocks with impressive financial metrics.
Market cap stands at ₹24,011 crore (up 42.1% in 1 year) with promoter holding at 27.1%. The stock is trading above all major moving averages (5-day, 20-day, 50-day, 100-day, 200-day), indicating robust upward trend momentum.
Financial strength is evident with 3-year average ROE of 16.7% and RoCE of 19.8%, while revenue grew at CAGR of 18.8% and net profit at 31.6% over the past three years. The company maintains healthy debt-to-equity ratio of 0.56.
The global fluorochemicals industry is expected to grow to $29.61 billion by 2027 at CAGR of 5.06%, driven by surging demand from semiconductors, batteries, and electronic components. Specialty chemicals segment is projected to grow at 12% CAGR between 2020-2025.
Stock has outperformed its sector and reached new 52-week highs, with consistent gains demonstrating strong investor confidence in the specialty chemicals leader's growth prospects.
Conclusion
Navin Fluorine's exceptional 129% YoY PAT surge and successful breakout above ₹5,000 supply zone creates compelling technical and fundamental convergence. The 50x long-term growth story, combined with 42.1% annual market cap increase and industry-leading ROE of 16.7%, validates the breakout thesis. Current consolidation near ₹4,843 offers attractive entry for targeting ₹6,500 levels. Critical support at ₹4,700-₹5,000 zone must hold for sustained bullish trajectory in the specialty chemicals space.
Disclaimer: lnkd.in

UltraTech: Two-Decade Bull Rally Reaches New SummitTechnical Analysis
UltraTech Cement presents one of the most spectacular long-term growth stories in Indian equity markets. Having observed this stock for two decades, the journey from ₹250 levels to ₹12,000 represents a phenomenal 48x growth over 20 years - a testament to consistent value creation.
The ₹12,000 level acted as formidable resistance from July 2024 to July 2025, creating a year-long consolidation phase. This resistance was finally breached in July 2025, coinciding with confirmation of positive YoY quarterly results that provided the fundamental catalyst needed for the breakout.
Currently trading at ₹12,700, the stock has successfully broken above the psychological ₹12,000 barrier. This breakout, supported by strong fundamental performance, opens up the path for the next leg of the bull rally.
Entry Strategy: Enter on any dips toward ₹12,200-₹12,300 range, ensuring the ₹12,000 level holds as new support.
Targets:
Target 1: ₹13,000
Target 2: ₹13,500
Target 3: ₹14,000
Stop Losses:
Critical Support: ₹12,000 (previous resistance, now key support)
If the market doesn't sustain above ₹12,000 level, no more expectations on this stock.
Q1 FY26 Financial Highlights (vs Q4 FY25 & Q1 FY25)
Total Income: ₹21,275 Cr (↓ -8% QoQ from ₹23,063 Cr; ↑ +13% YoY from ₹18,819 Cr)
Total Expenses: ₹16,869 Cr (↓ -9% QoQ from ₹18,456 Cr; ↑ +7% YoY from ₹15,801 Cr)
Operating Profit: ₹4,406 Cr (↓ -4% QoQ from ₹4,608 Cr; ↑ +46% YoY from ₹3,017 Cr)
Profit Before Tax: ₹3,008 Cr (↓ -3% QoQ from ₹3,101 Cr; ↑ +62% YoY from ₹1,857 Cr)
Profit After Tax: ₹2,221 Cr (↓ -10% QoQ from ₹2,475 Cr; ↑ +49% YoY from ₹1,493 Cr)
Diluted EPS: ₹75.54 (↓ -10% QoQ from ₹84.23; ↑ +46% YoY from ₹51.78)
Fundamental Highlights
UltraTech Cement delivered exceptional Q1 FY26 performance with consolidated net profit surging 49% YoY to ₹2,221 crore, driven by strong volume growth of 9.7% YoY to 36.83 million tonnes. Income rose 13% with EBITDA per MT increasing ₹337.
Market cap stands at ₹3,75,630 crore (up 11.1% in 1 year) with stable promoter holding at 59.2%. The company increased grey cement capacity by 3.5 MTPA in Q1 FY26, bringing total capacity to 192.26 MTPA.
UltraTech has allocated ₹10,000 crore capex for FY26 to bolster capacity and energy efficiency initiatives. Company achieved over 1 GW renewable power installations milestone and expects 7-8% sustainable volume growth.
UltraTech is on track to become world's top cement seller outside China with operational footprint of 34 integrated units, 30 grinding units, and 9 bulk terminals across India. In FY25 alone, the company added 42.6 MTPA capacity, accounting for 55% of the entire sector's expansion.
Strategic positioning includes targeting 209.3 MTPA output by FY27 and maintaining strong operational metrics with focus on sustainability through renewable energy integration.
Conclusion
UltraTech's remarkable 20-year bull run from ₹250 to ₹12,700, combined with 49% YoY PAT growth and successful ₹12,000 resistance breakout, validates the long-term growth thesis. The 192.26 MTPA capacity milestone, ₹10,000 crore FY26 capex, and 1 GW renewable energy achievement position the company as industry leader. Technical breakout toward ₹14,000 appears feasible provided ₹12,000 support holds. Strong fundamentals justify premium valuation in cement sector leadership.
Disclaimer: lnkd.in

Breaking Out of Falling Wedge and Symmetrical TriangleNSE:SYRMA is breaking out of Falling Wedge and Symmetrical Triangle Breakout on Weekly TF. With 2nd Best Weekly Volumes.
NSE:SYRMA is a Chennai-based engineering and design company engaged in electronics manufacturing services (EMS). The company provides integrated services and solutions to original equipment manufacturers (OEMs) from the initial product concept stage to volume production through concept co-creation and product realization.
Recently it posted good Q2 FY 24-25 Results, posting a 30% Y/Y rise in Q2 consol profit after tax. The auto and healthcare businesses led growth in Q2 and will drive future growth further ahead. Also, expect a recovery in margins fuelled by higher exports and design and manufacturing businesses. NSE:SYRMA faces margin challenges as the consumer segment, which comprises 35%—38% of topline, operates with lower margins, and they are aiming to lower the segment's share further.
One can wait for a retracement or ride the momentum with the current week candle as stop loss.
🙋♀️🙋♂️If you have any questions about this stock, feel free to reach out to me.
📌Thank you for exploring my idea! I hope you found it valuable.
🙏FLLOW for more
👍BOOST if useful
✍️COMMENT Below your views.
Meanwhile, check out my other stock ideas below until this trade is activated. I would love your feedback.
Disclaimer: This analysis is intended solely for informational and educational purposes and should not be interpreted as financial advice. It is advisable to consult a qualified financial advisor or conduct thorough research before making investment decisions.

Part 3 Learn Institutional Trading Option Pricing & Premiums
The premium (price of option) is determined by many factors:
Intrinsic Value – Difference between current stock price and strike price. Example: If stock = ₹200, strike = ₹180 (call), intrinsic value = ₹20.
Time Value – Extra premium because of time left until expiry. More time = higher premium.
Volatility – Higher volatility increases premium (uncertainty = higher value).
Interest rates & dividends – Also affect option pricing slightly.
The most famous model for pricing options is the Black-Scholes Model, used worldwide.
Moneyness (ITM, ATM, OTM)
Options are classified as:
In The Money (ITM): Option already has intrinsic value. (Example: Stock = ₹250, Call strike = ₹240).
At The Money (ATM): Stock price = strike price.
Out of The Money (OTM): Option has no intrinsic value yet. (Example: Stock = ₹250, Call strike = ₹280).
OTM options are cheaper, but riskier. ITM options are costlier, but safer.

BUY EURUSDEUR/USD – Buy Setup 📈
Entry: 1.16564
Stop Loss: 1.16058
Take Profit: 1.18758
Reasoning: Price bounced from key supportwith bullish candlestick confirmation.

Open Interest Chain Analysis1. Basics of Open Interest
Open Interest refers to the total number of outstanding derivative contracts (futures or options) that are currently active and not closed or settled. Unlike stock trading, where the number of shares is fixed, derivatives can be created and extinguished through contracts.
If a new buyer and new seller enter a contract → OI increases by 1.
If an existing contract holder closes their position (buy vs sell) → OI decreases by 1.
If an existing position shifts hands (buyer sells to a new buyer) → OI remains unchanged.
Key Points:
OI is reported at the end of the trading day.
OI gives a measure of liquidity and market participation.
Higher OI means greater trader interest and tighter spreads.
2. Difference Between Open Interest and Volume
Many beginners confuse volume with open interest.
Volume: Number of contracts traded during the day (can include multiple trades of the same contract).
Open Interest: Number of outstanding contracts still open at the end of the day.
Example:
Trader A buys 1 lot of Nifty call option from Trader B.
Volume = 1
OI = 1 (new contract created)
If Trader A sells that contract to Trader C:
Volume = 2 (two trades happened)
OI = 1 (still one open contract, just transferred)
So, volume measures activity, while OI measures positions outstanding.
3. Mechanics of Open Interest Creation and Reduction
Understanding how OI increases or decreases helps in interpreting market activity:
New Buyer + New Seller → OI Increases.
Old Buyer + Old Seller Square Off → OI Decreases.
Old Position transferred (buyer sells to new buyer) → OI unchanged.
This is why OI analysis is powerful—it helps in distinguishing between fresh positions and unwinding.
4. Importance of OI in Options and Futures
Open Interest matters because:
It reflects market participation (are traders interested?).
Identifies support/resistance levels (through strike-wise OI).
Highlights trend confirmation or rejection.
Reveals institutional footprints (big money creates large OI).
Useful for strategy adjustments (hedging, spreads, straddles).
5. Open Interest Chain (OI Chain) Explained
An OI Chain is essentially a table of strike-wise option contracts, displaying:
Strike Price
Call OI (with changes)
Put OI (with changes)
Volume
Last Traded Price (LTP)
By analyzing this chain, traders can:
Spot which strikes have maximum call OI (resistance).
Spot which strikes have maximum put OI (support).
Track shift in OI to see if market is building bullish or bearish sentiment.
6. Techniques of OI Chain Analysis
A. Call vs Put OI Analysis
High Call OI at a strike → resistance level.
High Put OI at a strike → support level.
If Call OI increases and price falls → bearish confirmation.
If Put OI increases and price rises → bullish confirmation.
B. Change in OI (Intraday vs Daily)
Rising OI + Rising Price = Long Build-up (Bullish).
Rising OI + Falling Price = Short Build-up (Bearish).
Falling OI + Rising Price = Short Covering (Bullish).
Falling OI + Falling Price = Long Unwinding (Bearish).
C. Put-Call Ratio (PCR)
PCR = Total Put OI ÷ Total Call OI.
PCR > 1 = more puts than calls → bullish sentiment.
PCR < 1 = more calls than puts → bearish sentiment.
Extreme PCR values indicate overbought/oversold conditions.
D. OI Concentration Zones
Maximum Call OI → major resistance.
Maximum Put OI → major support.
These act like psychological barriers where option writers defend positions.
7. Bullish, Bearish, and Neutral Interpretations
Bullish Signs:
Put OI increasing at higher strikes.
Call OI unwinding.
PCR rising above 1.
Long build-up observed in futures.
Bearish Signs:
Call OI increasing at lower strikes.
Put OI unwinding.
PCR falling below 1.
Short build-up in futures.
Neutral/Range-Bound:
Balanced OI between calls and puts.
High OI at both nearest call and put strikes → “straddle zone.”
PCR around 1.
8. Combining OI with Price Action and Volume
Open Interest Chain Analysis is powerful only when combined with price and volume.
Price Up + OI Up + Volume Up → Strong bullish momentum.
Price Down + OI Up + Volume Up → Strong bearish momentum.
Price Sideways + OI Up → Range formation.
Price Up + OI Down → Short covering rally.
Thus, OI confirms whether a price move is genuine or just short-term volatility.
9. Institutional vs Retail Perspective
Institutions (FIIs, DIIs) often write options (sell calls/puts) to collect premium, leading to high OI concentrations.
Retail traders usually buy options, creating temporary OI spikes but often losing to time decay.
Hence, smart traders watch where institutions build OI—those levels become critical.
10. Limitations and Misinterpretations
Lagging Indicator – OI data is end-of-day in many markets.
False Signals – OI can rise due to hedging, not directional bets.
Expiry Week Noise – OI shifts rapidly as contracts near expiry.
Market Structure Differences – In US, OI behaves differently due to weekly expiries vs Indian markets.
Not Standalone – Should be used with price, volume, and broader trend.
11. Practical Case Studies
Case Study 1: Bullish Setup
Nifty at 20,000.
Max Put OI at 19,800, Max Call OI at 20,200.
PCR = 1.2.
Price rising with Put OI addition.
👉 Interpretation: Support strong at 19,800, resistance at 20,200. Bullish bias.
Case Study 2: Bearish Setup
Bank Nifty at 45,000.
Call OI rising at 45,500, Put OI unwinding at 44,800.
Futures showing short build-up.
👉 Interpretation: Resistance building overhead, downside likely.
Case Study 3: Range-Bound Setup
Stock XYZ trading at ₹1000.
Equal OI at 980 Puts and 1020 Calls.
PCR = 1.
👉 Interpretation: Market makers expect sideways movement, straddle possible.
12. Conclusion
Open Interest Chain Analysis is a window into the psychology of derivative markets. It reveals where big players are positioning, what levels they defend, and whether price action has strength behind it.
Key Takeaways:
OI measures open contracts, not trading volume.
Call OI = Resistance, Put OI = Support.
Change in OI + Price helps identify long/short build-ups.
PCR gives overall sentiment.
Best used with price action and volume.
A disciplined trader does not rely solely on OI but combines it with technical analysis, market structure, and macro events to refine decisions. With practice, OI Chain Analysis becomes a powerful tool for forecasting and risk management.
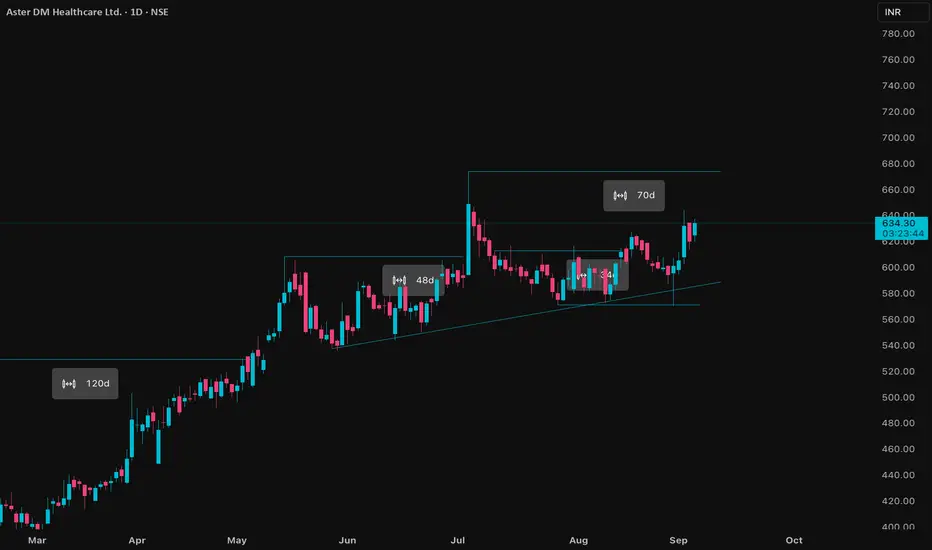
ASTERDM Price ActionAster DM Healthcare is trading around ₹632–₹634 as of September 4, 2025, and has shown solid resilience and upward movement over recent sessions. The company’s market capitalization stands at about ₹32,122 crore, and its current price-to-book ratio is roughly 9.4, reflecting growth expectations and sector strength.
Recent financial results highlight substantial improvement: Q1 FY26 revenue reached ₹1,078 crore, up 8% year-on-year, and consolidated net profit for the quarter is ₹85.52 crore, maintaining momentum following last year’s major gains from the strategic disposal of its Gulf business. The EBITDA margin for FY25 has strengthened, averaging 19.5%, due to increased patient volumes and operational efficiency. For the whole of FY25, revenue grew 12% to ₹4,138 crore, and net profit posted a strong jump to over ₹5,400 crore with strategic gains from the GCC business separation.
Balance sheet analysis shows rising book value and a stable asset base, indicating ongoing capital investment and sector expansion. Total expenses have grown moderately, while EBIT and PAT both reflect favorable YoY growth, with EBIT up 30% for the recent period. Trading volumes are steady, and the price action is currently above key moving averages, supporting a bullish technical outlook.
Aster DM Healthcare’s positive trend is backed by solid quarterly results, sector tailwinds, and strategic realignment of its international operations. Investors remain optimistic for further medium-term gains if the company sustains improved margins and expanding patient demographics.