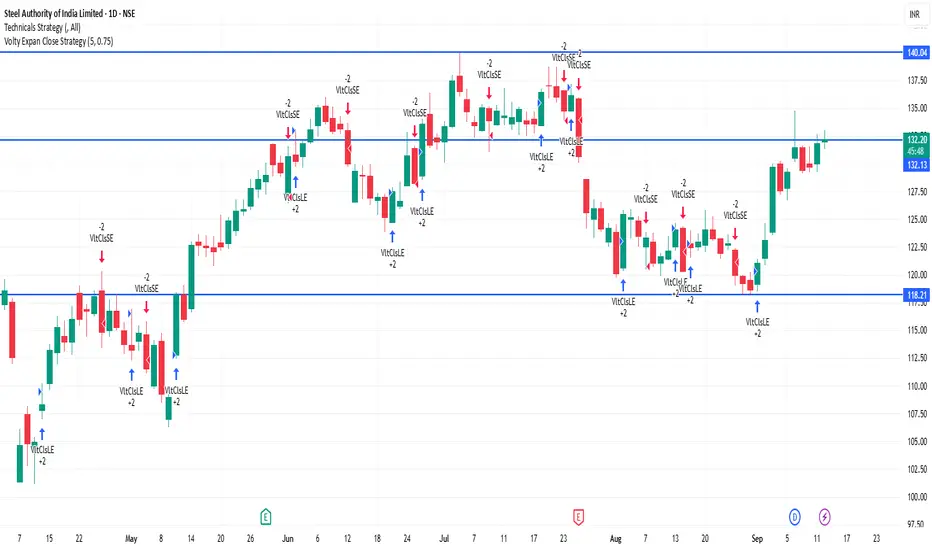
SAIL 1D Time frame🔢 Current Level
Trading around ₹132.28
🔑 Key Resistance & Support Levels
Resistance Zones:
₹133.00 – ₹134.00 (near-term resistance; breakout above this may lead to further upside)
₹135.00 – ₹136.00 (stronger resistance above)
Support Zones:
₹131.50 – ₹132.00 (immediate support; failure to hold above this may lead to a decline)
₹130.00 – ₹130.50 (short-term support; a break below this could indicate weakness)
₹128.00 – ₹129.00 (deeper support zone if price dips further)
📉 Outlook
Bullish Scenario: If SAIL holds above ₹132.00, upward momentum may continue. Break above ₹134.00 can open the way toward ₹135.00+.
Bearish Scenario: If it falls below ₹130.00, risk increases toward ₹128.00 – ₹129.00.
Neutral / Range: Between ₹132.00 – ₹134.00, SAIL may consolidate before a directional move.
Fundamental Analysis
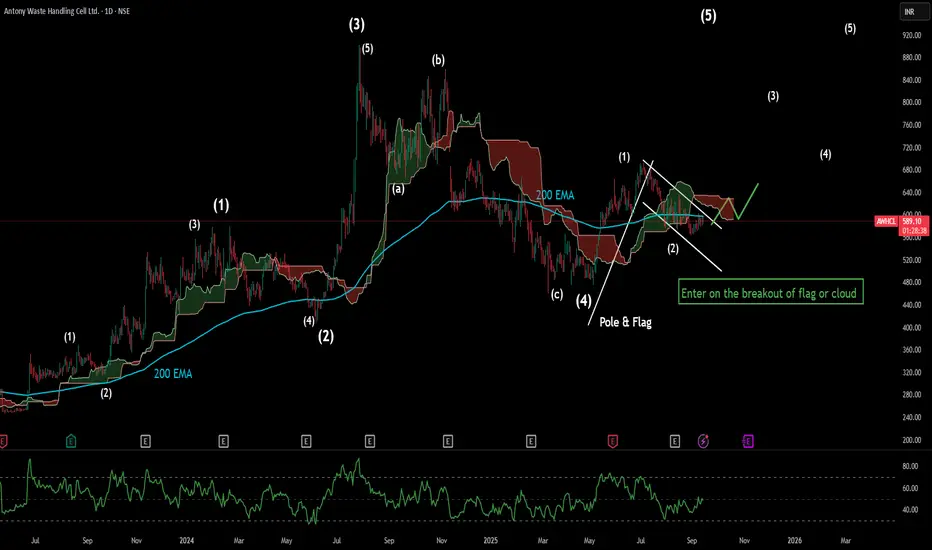
Antony WasteDate 12.09.2025
Antony Waste Handling Cell Ltd
Timeframe : Day Chart
About
(1) Engaged in the business of mechanical power sweeping of roads, collection and transportation of waste.
(2) The company operates one of the largest single-location waste processing plants in Asia
(3) The company entered the Waste-to-Energy (WTE) sector featuring a power generation capacity of 14 MW
Revenue Mix
(1) MSW C&T: 62%
(2) MSW Processing: 23%
(3) Contracts & Others: 15%
MSW : Municipal Solid Waste
Operational Metrics
(1) Waste Managed (MMT): 2.37
(2) Refuse Derived Fuel Sold (Tonnes): 64,500
(3) Compost Sold (Tonnes): 10,000
Vehicles Fleet
(1) Company has 2,295 vehicles
(2) 1,436 Small Tippers
(3) 446 Compactors
(4) 100 Big Tippers
(5) 93 EVs
Its key equipment vendors include Bucher, Hyvam, Caterpillar, etc.
Debt
(1) The total debt has increased from Rs. 200 Cr in FY20 to Rs. 429 Cr in Q2 FY5
(2) While the cost of borrowings decreased from 12.4% to 9.6%
Focus
(1) Aims for a 25% CAGR in revenue growth over the next 3–5 years
(2) Sustaining EBITDA margins at 23–24%
Regards,
Ankur
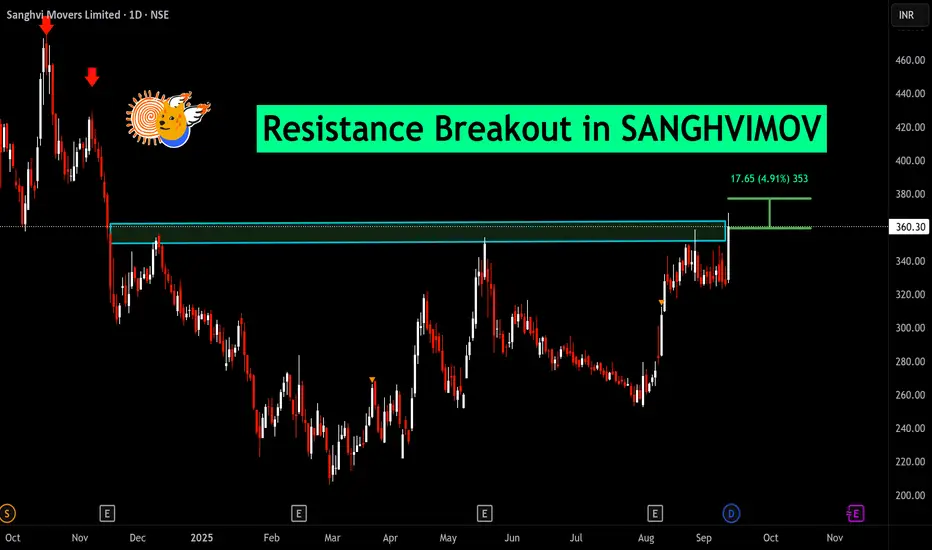
BUY TODAY SELL TOMORROW for 5%DON’T HAVE TIME TO MANAGE YOUR TRADES?
- Take BTST trades at 3:25 pm every day
- Try to exit by taking 4-7% profit of each trade
- SL can also be maintained as closing below the low of the breakout candle
Now, why do I prefer BTST over swing trades? The primary reason is that I have observed that 90% of the stocks give most of the movement in just 1-2 days and the rest of the time they either consolidate or fall
Resistance Breakout in SANGHVIMOV
BUY TODAY SELL TOMORROW for 5%
SBIN 1D Time frame🔢 Current Level
Trading around ₹823.65 - ₹825.00
🔑 Key Resistance & Support Levels
Resistance Zones:
₹824 – ₹826 (recent highs; breakout above this may lead to further upside)
₹830 (psychological resistance)
₹840 – ₹850 (stronger resistance above)
Support Zones:
₹820 – ₹822 (immediate support; failure to hold above this may lead to a decline)
₹810 (short-term support; a break below this could indicate weakness)
₹800 – ₹805 (deeper support zone if price dips further)
📉 Outlook
Bullish Scenario: If SBIN holds above ₹822, upward momentum may continue. Break above ₹826 can open the way toward ₹830+.
Bearish Scenario: If it falls below ₹810, risk increases toward ₹800 – ₹805.
Neutral / Range: Between ₹822 – ₹826, SBIN may consolidate before a directional move.

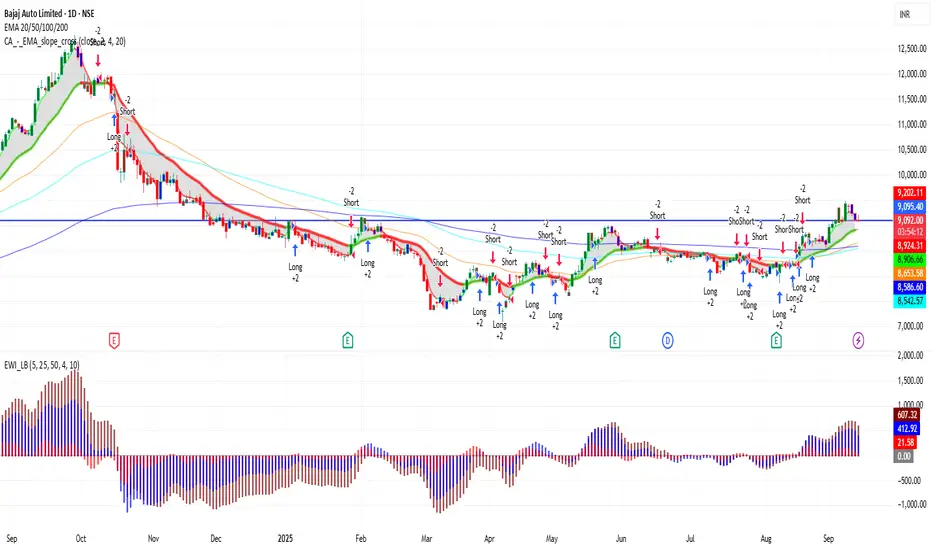
BAJAJ_AUTO 1D Time frame🔢 Current Level
Trading around ₹9,092 – ₹9,110
🔑 Key Resistance & Support Levels
Resistance Zones:
₹9,150 – ₹9,200 (near-term resistance; breakout above this may lead to further upside)
₹9,300 (stronger resistance above)
Support Zones:
₹9,070 – ₹9,090 (immediate support)
₹8,900 (stronger support if price dips further)
₹8,800 (deeper support zone)
📉 Outlook
Bullish Scenario: If Bajaj Auto holds above ₹9,090, upward momentum may continue. Break above ₹9,200 can open the way toward ₹9,300+.
Bearish Scenario: If it falls below ₹8,900, risk increases toward ₹8,800.
Neutral / Range: Between ₹9,090 – ₹9,200, Bajaj Auto may consolidate before a directional move.
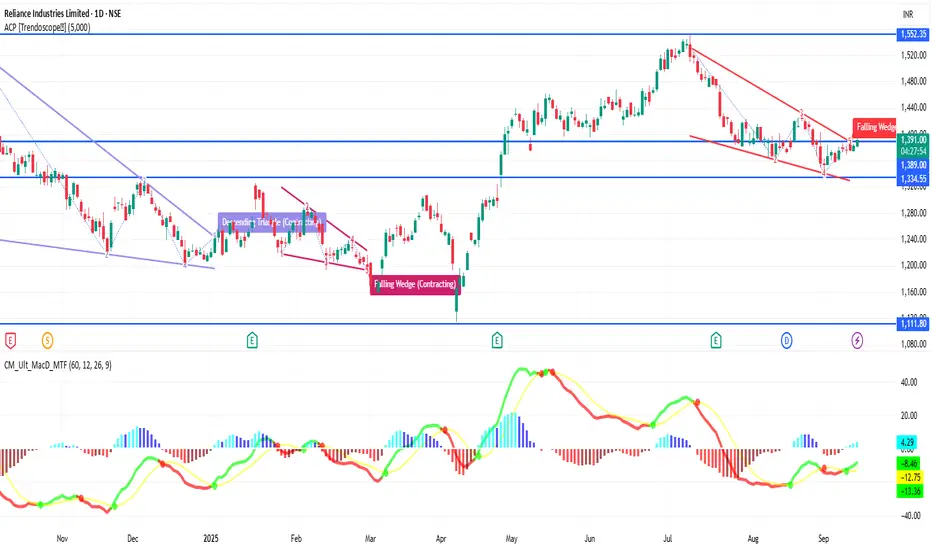
RELIANCE 1D Time frame🔢 Current Level
RELIANCE is trading around ₹1,391 – ₹1,392
🔑 Key Resistance & Support Levels
Resistance Zones:
₹1,392 – ₹1,396 (near-term resistance; breakout above this may lead to further upside)
₹1,400 (psychological resistance)
₹1,427 (stronger resistance above)
Support Zones:
₹1,380 – ₹1,385 (immediate support)
₹1,370 (short-term support; break below may indicate weakness)
₹1,350 (deeper support zone if selling pressure continues)
📉 Outlook
Bullish Scenario: If RELIANCE holds above ₹1,385, upward momentum may continue. Break above ₹1,396 can open the way toward ₹1,400+.
Bearish Scenario: If it falls below ₹1,370, risk increases toward ₹1,350.
Neutral / Range: Between ₹1,385 – ₹1,396, RELIANCE may consolidate before a directional move.
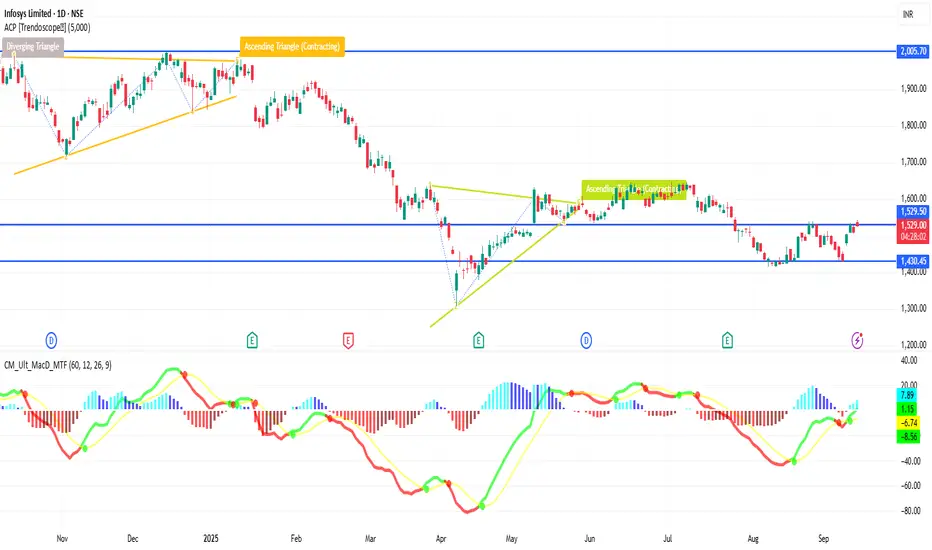
INFY 1D Time frame🔢 Current Level
INFY is trading around ₹1,510 – ₹1,529
🔑 Key Resistance & Support Levels
Resistance Zones:
₹1,518 – ₹1,520 (near-term resistance; breakout above this may lead to further upside)
₹1,530 (stronger resistance above)
Support Zones:
₹1,484 – ₹1,485 (immediate support)
₹1,481 (stronger support if price dips further)
₹1,470 – ₹1,472 (deeper support zone)
📉 Outlook
Bullish Scenario: If INFY holds above ₹1,485, upward momentum may continue.
Breakout Scenario: A move above ₹1,520 can open the way toward ₹1,530+.
Bearish Scenario: If it falls below ₹1,481, risk increases toward ₹1,470 – ₹1,472.
SENSEX 1D Time frame🔢 Current Level
Sensex is around ₹81,800 – ₹81,818
🔑 Key Resistance & Support Levels
Resistance Zones
~ ₹81,900 – ₹82,200 (recent highs / selling pressure zone)
~ ₹82,500 (stronger resistance above)
Support Zones
~ ₹81,300 – ₹81,400 (immediate support)
~ ₹81,100 (stronger support if price dips further)
~ ₹80,800 – ₹80,900 (deeper support zone)
📉 Outlook
If Sensex holds above ~ ₹81,400, bullish scenario remains alive.
Break above ~ ₹82,200 can open upside toward ~ ₹82,500+.
If it loses ~ ₹81,300, then downward risk increases, possibly toward ~ ₹81,100 or lower.

Potential Bullish Scenario In Expeditors,There is a strong possibility of an upward breakout, driven by the company's robust fundamentals, including strong financials and a significant cash reserve. A sustained break above the resistance zone of $130-$134 would confirm this bullish momentum. Such a move would likely signal the start of a new upward trend, reflecting renewed investor confidence and a potential revaluation of the company's stock.
Alternatively, if the stock fails to sustain its position above the $130 resistance level, it may signal a rejection of the upward move. This failure could lead to a price correction, with a high probability of the stock reverting to the $80-$85 support range. This potential pullback would likely be a temporary discount, offering a more attractive entry point before the stock resumes its long-term upward trajectory.
In summary, the stock is at a critical inflection point. The resolution of its long-term consolidation will determine its near-term direction, with a breakout above $134 confirming a bullish trend and a failure to hold above $130 potentially leading to a temporary retracement to the $80-$85 level.

Bullish Silver is looking very very hot
Its bullish Flag making if silver sustain this week above 42.25$, then it comes to 49 superfast maybe next in two days only
There's no recommendations from my side
Only for learning purpose

BUY GBPNZD📊 Trade Idea: BUY GBPNZD
The GBP is showing resilience supported by strong economic outlook, while NZD remains under pressure from weaker global risk sentiment and softer commodity demand. This creates a bullish setup for GBPNZD.
🔹 Technical Outlook:
Price is trading above the 2.26756 support zone, keeping the bullish structure intact.
Higher highs and higher lows indicate continued upside momentum.
🔹 Trading Bias: Bullish
Entry Zone: 2.26456-2.26056
Targets: 🎯2.34384
Stop Loss: 2.24132
⚠️ Risk management is crucial as GBPNZD is a high-volatility pair.

BUY EURAUDTrade Idea: BUY EURAUD
The EURAUD pair is showing renewed bullish momentum as the Euro gains strength against the Australian Dollar. Market sentiment is tilted in favor of EUR, supported by stability in the Eurozone, while AUD is weighed down by softer risk appetite and commodity price pressures.
🔹 Technical Outlook:
Price is holding firmly above the support zone, which acts as a strong base for buyers.
The pair is trending higher, forming higher lows — a sign of continued upward momentum.
Immediate resistance lies at 1.75874. A breakout above this could open the path toward 1.75870 levels.
🔹 Trading Bias: Bullish
Entry: Around 1.76092-1.76080 (on pullbacks)
Target: 1.84419
Stop Loss: 1.74217
⚠️ Always apply proper risk management as volatility in EURAUD can be high.

Breakout Soon Stock: Kross Ltd.Introduction:
Kross Manufacturers (India) Pvt Ltd is a leading supplier to OEMs, KROSS is an acknowledged specialist in manufacturing a wide variety of critical automobile components like Universal Joints, Diff. Spiders, Axle Shafts, Spindles, Companion Flanges and many critical Tractor Parts- like Stub Axle, P.T.O Shafts, Hydraulic Shafts Ring Gear etc.
Fundamentals:
Market Cap: ₹ 1,445 Cr.;
Stock P/E: 28.29 (Ind. P/E: 29.00) 👍;
ROCE: 21.7% 👍; ROE: 16.5% 👍;
3 Years Sales Growth: 28% 👍
3 Years Compounded Profit Growth: 58% 👍
Technicals:
Kross is trading above all key EMAs like 20 EMA(Black Line), 50 EMA (Orange Line), 100 EMAs (Blue Line) and 200 EMA (Pink line).
Resistance levels: 235, 270
Support levels: 211, 199, 188
Note: As per technical analysis, Kross has formed a strong base. Upside potential huge provided the current levels are maintained for few sessions.

MRK [merck & company ] bullishUS STOCK merk&company is in demand zone .its time to take long
drawn on liquidity = 97 $
target 97 $

Ingersoll Rand (India) getting ready for UpmoveIngersoll Rand (India)
Current Range: 3600 - 3900
Target Range: 4300 - 4600
Upside Possible: 17%
Technical: CCI (Commodity Channel Index) Indicator turned positive

Ashok Leyland: Q1 Results Drive Breakout MoveTechnical Analysis
Ashok Leyland has showcased an extraordinary super bullish rally spanning an incredible 25-year journey since 1999. The stock's transformation from trading below ₹1 in 1999 to the current level of ₹134 represents a phenomenal 13,400%+ growth over two and half decades - a testament to India's commercial vehicle revolution.
However, since 2024, the stock encountered formidable resistance at the ₹130-132 zone, creating a critical supply area that tested multiple times. In August 2024, this resistance proved too strong, causing a sharp correction down to ₹96 levels, representing a significant 27% decline from resistance.
The game-changing catalyst arrived with the announcement of strong Q1 FY26 results, showcasing record commercial vehicle volumes and impressive cost discipline. These stellar quarterly numbers provided the momentum needed to stage a remarkable recovery, with the stock breaking above the stubborn ₹132 resistance level with strong volume confirmation on September 8th, 2025.
Currently trading at ₹134, the stock has successfully conquered the 130-132 resistance zone. If this previous resistance transforms into robust support with bullish candlestick pattern confirmation, the technical setup appears highly favorable for the next leg of rally.
Entry Strategy: Enter on any dips toward ₹130-132 range, ensuring the old resistance holds as new support with volume confirmation.
Targets:
Target 1: ₹140
Target 2: ₹145
Target 3: ₹150
Stop Losses:
Critical Stop: ₹130 (previous resistance, now key support)
If ₹130-132 zone doesn't sustain as support or demand zone, no more expectations on this stock.
Q1 FY26 Financial Highlights (vs Q4 FY25 & Q1 FY25)
Total Income: ₹11,709 Cr (↓ -20.3% QoQ from ₹14,696 Cr; ↑ +9.2% YoY from ₹10,724 Cr)
Total Expenses: ₹9,535 Cr (↓ -18.5% QoQ from ₹11,705 Cr; ↑ +7.7% YoY from ₹8,856 Cr)
Operating Profit: ₹2,173 Cr (↓ -27.4% QoQ from ₹2,991 Cr; ↑ +16.3% YoY from ₹1,868 Cr)
Profit Before Tax: ₹891 Cr (↓ -45.0% QoQ from ₹1,621 Cr; ↑ +16.5% YoY from ₹765 Cr)
Profit After Tax: ₹658 Cr (↓ -47.2% QoQ from ₹1,246 Cr; ↑ +19.4% YoY from ₹551 Cr)
Diluted EPS: ₹1.04 (↓ -45.8% QoQ from ₹1.92; ↑ +19.5% YoY from ₹0.87)
Fundamental Highlights
Ashok Leyland delivered impressive Q1 FY26 performance with PAT surging 19.4% YoY to ₹658 crore, driven by record commercial vehicle volumes and superior cost discipline. The company achieved record Q1 volumes with profit rising on improved market execution and cost control, with exports reaching all-time high levels.
As India's 2nd largest commercial vehicle manufacturer, 4th largest bus manufacturer globally, and 19th largest truck manufacturer worldwide, Ashok Leyland maintains a dominant market position with diversified operations across 9 manufacturing plants internationally.
The company sold 44,238 units in Q1 - its highest for any first quarter - and posted revenues of ₹8,725 crore, marking the strongest-ever first-quarter results in company history. This record performance validates the technical breakout above ₹132 resistance levels.
Operating margin resilience demonstrated through 16.3% YoY operating profit growth despite seasonal QoQ decline, showcasing management's focus on operational efficiency. Recent January 2025 sales data shows continued momentum with 8% YoY growth in commercial vehicle sales to 17,213 units.
The commercial vehicle cycle is expected to continue into FY25 driven by economic growth and infrastructure spending, with government likely to introduce payment security mechanism for electric buses. This provides strong sectoral tailwinds for sustained growth.
Strategic expansion initiatives include network expansion in Eastern India to tap regional economic growth and strengthen customer service in light commercial vehicle segment. Partnership with Nidec in October 2024 to boost commercial vehicle electrification through E-Drive system development positions the company for future mobility trends.
Cost management excellence reflected in expense control while maintaining record volume performance, demonstrating operational leverage benefits. Strong balance sheet fundamentals and established market leadership support the technical breakout thesis for sustained momentum.
Conclusion
Ashok Leyland's spectacular 19.4% YoY PAT growth and record Q1 volumes triggering successful breakout above 25-year resistance at ₹132 creates compelling technical and fundamental convergence. The company's market leadership position, record quarterly performance, and strong sectoral tailwinds from infrastructure spending provide robust backing for the upward trajectory. Critical support at ₹130-132 breakout zone must sustain for continued bullish momentum toward the ₹150 target zone. The 25-year wealth creation journey continues with fresh technical setup favoring further upside.
Disclaimer: lnkd.in

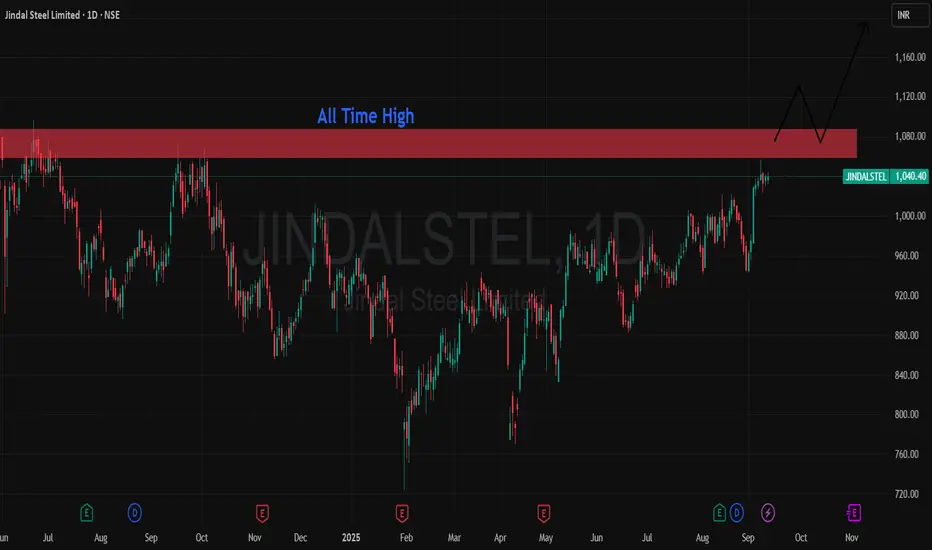
Jindal Steel: Q1 Turnaround Fuels Technical Breakout SetupTechnical Analysis
Jindal Steel has demonstrated an exceptional super bullish rally spanning the past decade, establishing itself as a market leader. However, since 2024, the stock encountered formidable resistance at the 1050-1100 zone, creating a critical supply area that has tested multiple times.
The game-changing catalyst arrived with the announcement of stellar Q1 FY26 results in August 2024, showcasing remarkable operational turnaround. These super positive quarterly numbers provided the momentum needed to challenge the stubborn resistance zone once again.
Currently trading at ₹1,039, the stock sits just below the crucial 1050-1100 supply zone. A decisive breakout above this range with strong volume confirmation would mark a significant technical milestone, transforming previous resistance into robust support.
Entry Strategy: Enter on sustained breakout above ₹1,100 with volume confirmation, ensuring bullish candlestick patterns emerge.
Targets:
Target 1: ₹1,150
Target 2: ₹1,200
Target 3: ₹1,250
Stop Losses:
Critical Stop: ₹1,050 (supply zone breakout level)
If the supply zone sustains and market fails to hold above these levels, no more expectations on this stock.
Q1 FY26 Financial Highlights (vs Q4 FY25 & Q1 FY25)
Total Income: ₹12,294 Cr (↓ -6.7% QoQ from ₹13,183 Cr; ↓ -9.7% YoY from ₹13,618 Cr)
Total Expenses: ₹9,289 Cr (↓ -14.9% QoQ from ₹10,922 Cr; ↓ -13.8% YoY from ₹10,779 Cr)
Operating Profit: ₹3,006 Cr (↑ +32.9% QoQ from ₹2,262 Cr; ↑ +5.9% YoY from ₹2,839 Cr)
Profit Before Tax: ₹2,018 Cr (↑ +2,703% QoQ from ₹72 Cr; ↑ +8.6% YoY from ₹1,859 Cr)
Profit After Tax: ₹1,498 Cr (Turnaround from ₹-304 Cr QoQ; ↑ +11.8% YoY from ₹1,338 Cr)
Diluted EPS: ₹14.65 (↑ +540% QoQ from ₹-3.33; ↑ +11.5% YoY from ₹13.14)
Fundamental Highlights
Jindal Steel delivered a spectacular operational turnaround in Q1 FY26 with PAT surging to ₹1,498 crore, marking an impressive 11.8% YoY growth and complete recovery from Q4 FY25 losses. The dramatic quarterly improvement showcases superior cost management with expenses declining 14.9% while operating profits jumped 32.9%.
Market cap stands at ₹1,05,635 crore (up 7.49% in 1 year) with strong promoter holding of 62.4% indicating management confidence. The company maintains diversified operations across steel, power, mining and infrastructure sectors providing business stability.
Operating margin expansion from 20.8% in Q1 FY25 to 24.5% in Q1 FY26 demonstrates exceptional operational efficiency improvements. The integrated steel-to-power business model offers competitive advantages and revenue diversification benefits.
India's steel sector momentum provides strong tailwinds with market projected to grow from $102.67 billion in 2024 to $166.96 billion by 2030 at 8.28% CAGR. Infrastructure boom and government initiatives support sustained steel demand growth prospects.
Cost optimization excellence reflected in 13.8% YoY expense reduction while maintaining operational capabilities, showcasing management's focus on profitability enhancement. The company's strategic positioning in key infrastructure segments aligns with India's growth trajectory.
EPS improvement from negative territory to ₹14.65 validates the operational turnaround strategy. Strong balance sheet fundamentals and debt management support the technical breakout thesis for sustained momentum.
Conclusion
Jindal Steel's remarkable Q1 FY26 turnaround with 11.8% YoY PAT growth and operational margin expansion creates compelling technical setup at the 1050-1100 resistance zone. The company's integrated business model and sector tailwinds from India's infrastructure boom provide strong fundamental backing. Critical breakout above ₹1,100 with volume confirmation could unlock significant upside to the ₹1,250 target zone. Support at ₹1,050 breakout level must sustain for continued bullish trajectory.
Disclaimer: lnkd.in
MARUTI 1D Time frame📍 Current Price Action
Last traded price: ~₹ 15,096
Minimal intraday change (~0.1%, slightly up)
⚙ Technical Indicators
RSI (14): ~72 → strong uptrend / overbought conditions
Stochastic RSI: Low / showing weakness → possible cooling off
CCI (14): ~92 → uptrend strength
MFI (Money Flow Index): ~84 → strong buying pressure
📊 Moving Averages & Trend Strength
Price is above 50-day and 200-day SMAs & EMAs → long-term trend is bullish
20-day SMA/EMA are more neutral-to-slightly bullish
All major moving averages are broadly supporting upwards bias
🔧 Support & Resistance / Pivot Zones
Support Levels: ~₹ 14,900 – ₹ 15,000
Resistance Levels / Pivot: ~₹ 15,300 – ₹ 15,500
🧠 Summary
Maruti is in a strong uptrend on the daily chart. Overbought indicators like RSI and MFI suggest buying strength is high, which also means risk of a short-term pullback or consolidation. Key support ~₹ 15,000 needs to hold for bulls. If price clears resistance near ₹ 15,300-15,500 convincingly, upward move likely to continue.

INFY 1D Time frame📍 Current Price Action
Current Price: ~₹1,509
Day Change: about –1.5%
Daily Range: ₹1,500 – ₹1,515
⚙ Technical Indicators
RSI (14): ~57–60 → neutral to mildly bullish momentum
MACD: Positive → signals upward bias
Stochastic Oscillator: Near oversold zone → indicates possible bounce
ADX (14): ~26 → moderate trend strength
Money Flow Index (MFI): Mid-range → no extreme buying/selling pressure
📊 Moving Averages
Short-term (5, 10-day): Price trading slightly below → short-term weakness
Medium to Long-term (50, 100, 200-day): Price still above → long-term structure supportive
📉 Support & Resistance
Immediate Support: ~₹1,500
Next Support: ~₹1,480 – ₹1,470
Immediate Resistance: ~₹1,512 – ₹1,515
Breakout Target (if above resistance): ~₹1,530 – ₹1,540
🧠 Summary
INFY is neutral to mildly bullish on the daily chart. Support at ₹1,500 is crucial — holding above it keeps momentum intact. If the stock breaks above ₹1,515, it can push toward ₹1,530–1,540. On the downside, breaking below ₹1,500 may invite weakness toward ₹1,480–1,470.

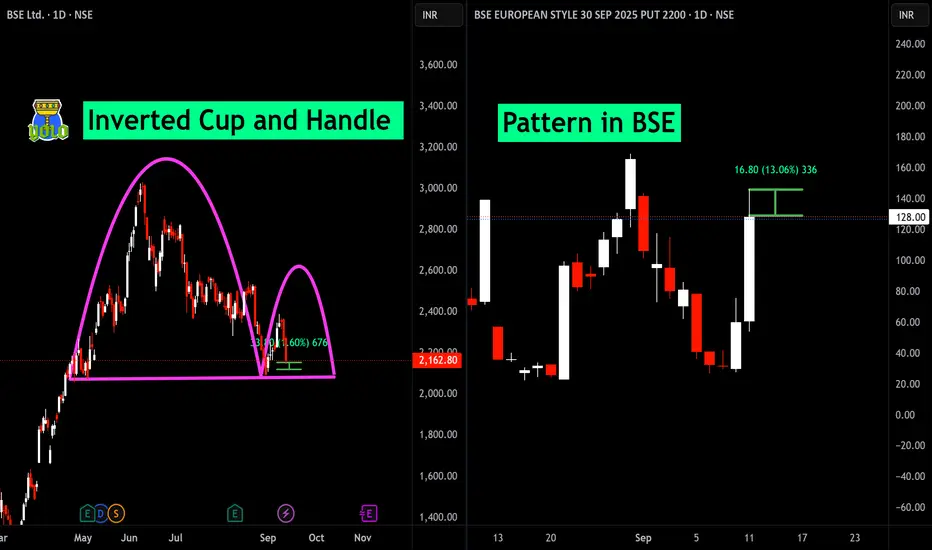
Inverted Cup and Handle Pattern in BSE Spotting high-probability setups in BSE Ltd.: The left chart reveals a textbook Inverted Cup and Handle breakdown, signaling potential bearish continuation if support cracks. On the right, the BSE option displays a powerful breakout pattern, offering a 13% move and momentum for agile traders.
Why It Matters
Bearish momentum building in BSE Ltd.—watch for downside triggers.
Volatility surge in BSE PUT options—opportunity for decisive trades.
Take action: Review your positions and set alerts for key breakdown or breakout levels to capture the next move. For premium setups and live market calls—connect today!
HCG Price ActionHealthcare Global Enterprises Ltd (HCG) is trading near ₹690 as of September 11, 2025. The stock opened at ₹692, touched a high of ₹696, and a low of ₹667 during the session. Market capitalization is about ₹9,700 crore, with relatively strong volumes and current price action near year-to-date highs. Over the past year, the share has rallied from a low of ₹398 to as high as ₹708, reflecting a rapid uptrend.
Valuation metrics are elevated, with a trailing P/E ratio of 261 and P/B ratio of 10.7, much above the sector medians, reflecting market optimism for future expansion. The company’s annual revenues continue to grow, supported by increased occupancy and expanded hospital networks. Operating profit margin remains strong at 17%, while recent annualized EPS is ₹2.66. Though profit growth has been solid over the last few years, returns on equity and capital employed remain moderate, and promoters have decreased their shareholding with a high proportion pledged.
Technically, HCG trades well above its 50-day and 200-day moving averages and the 14-day RSI sits at 68, showing positive momentum but approaching overbought territory. The stock has no dividend payout history and continues to use profits to fund growth and operational expansion. Overall outlook remains constructive, contingent on continued sector demand and successful network scaling, though valuation risks and promoter pledges merit attention.

Waaree Energies: A Solar Powerhouse or Overheated Rally.?**Waaree Energies at ₹3,188: A Solar Powerhouse or Overheated Rally?**
Waaree Energies (NSE: WAAREE), a prominent player in India’s burgeoning solar sector, closed at ₹3,188.90, up 2.84% on the day. With a market capitalization exceeding ₹91,000 Cr, the company is clearly a force to reckon with. But what does the current valuation and underlying fundamentals tell us about its future trajectory?
Is Waaree Energies poised for continued growth fueled by the renewable energy wave, or is it showing signs of a rally that needs fundamental catch-up?
Let’s dissect the numbers.
**Shareholding Breakdown (as of June 2025)**
A significant 64.30% of the company is held by Promoters, signalling a strong conviction and long-term vision from the core leadership. On the institutional front, Domestic Institutional Investors (DIIs) hold a minimal 1.46%, while Foreign Institutional Investors (FIIs) have virtually no presence at 0.00%. Public investors account for 21.95% of the shares, with "Others" making up the remaining 12.29%. The government holds no stake. This strong promoter holding is generally a positive, suggesting alignment with long-term shareholder value. However, the almost non-existent FII and DII presence suggests the stock might not yet be on the radar of large institutional funds, or they are yet to build significant positions. This could also mean potential for future institutional buying if the growth story strengthens.
**Financial Performance Snapshot**
Waaree Energies has demonstrated impressive financial growth. Sales surged from ₹11,398 Cr in March 2024 to ₹14,445 Cr in March 2025, marking a 26.73% increase. Operating Profit nearly doubled, jumping from ₹1,574 Cr to ₹3,119 Cr in the same period, an astounding 98.16% rise. Concurrently, the Operating Profit Margin (OPM%) expanded from 14% to a robust 19%. This efficiency is also reflected in the Net Profit, which climbed by 54.55%, from ₹1,274 Cr to ₹1,969 Cr.
While the profit and revenue trends are undeniably strong, a look at the cash flows for March 2024 shows a net negative cash flow of ₹-132 Cr. This was primarily driven by substantial investing activities (₹-3,347 Cr), indicating significant capital expenditure, likely for expansion. This is a point to monitor as continued growth will require efficient funding. The balance sheet reflects healthy expansion, with Reserves & Surplus growing significantly from ₹3,825 Cr in March 2024 to ₹9,192 Cr in March 2025, and Total Equity and Liabilities also expanding from ₹11,314 Cr to ₹19,747 Cr in the same period.
**Market Landscape**
India's renewable energy sector, especially solar, is experiencing a boom propelled by government support, surging energy demand, and a global pivot towards clean energy. As a key manufacturer of solar PV modules, Waaree Energies is strategically positioned to capitalize on this robust growth. The stock's 36.34% return over the past year underscores the sector's vibrant momentum.
**Analysts' Outlook**
With a P/E ratio of 47.60 and no dividend yield, the market is clearly pricing in substantial future growth for Waaree Energies. This elevated P/E ratio implies that investors anticipate consistently strong earnings performance to justify the current valuation.
**Technical Analysis – Approaching Resistance with Upside Potential**
The stock closed at ₹3,188.90, trading above its daily pivot point of ₹3,122.93. Immediate resistance levels are notable, with R1 at ₹3,174.87, followed by R2 at ₹3,248.83, and R3 at ₹3,300.77. On the downside, key support levels are at S1 (₹3,048.97) and S2 (₹2,997.03).
Looking at moving averages, the stock is trading above its short-term and medium-term SMAs and EMAs, indicating a generally positive trend. For instance, the 5-SMA is at 3123.18, and the 10-SMA is at 3143.64, both below the current price. However, the MACD indicator is currently at -7.39, signalling a bearish divergence despite the recent positive price action, suggesting some underlying weakness or consolidation. The Relative Strength Index (RSI) stands at 54.86, residing in a neutral zone and not yet indicating overbought conditions.
If Waaree Energies manages to break and sustain above the R1 level of ₹3,174.87 with strong volume, it could potentially target the next resistance zones at R2 (₹3,248.83) and R3 (₹3,300.77). **Furthermore, according to our technical analysis, the stock appears poised to climb above ₹4,000 soon, suggesting significant upside potential beyond immediate resistance levels.** Conversely, a dip below the pivot point (₹3,122.93) could lead to a retest of support at ₹3,048.97 and potentially ₹2,997.03.
**Real Talk: Growth vs. Valuation**
Waaree Energies presents an intriguing case with its strong fundamental growth in a high-growth sector. However, the current valuation, highlighted by its P/E ratio, is on the higher side. This suggests that a significant portion of the anticipated future growth may already be factored into the present share price.
For **Traders**: The immediate technical picture suggests the stock is battling resistance, but there's a strong expert view for significant upside. A clear breakout above R1 with sustained volume would be a strong signal to confirm this bullish outlook. Given some mixed technical indicators like MACD, caution is still advised. Implementing tight stop losses is paramount to managing risk.
For **Investors**: The long-term narrative for Waaree Energies within the burgeoning renewable energy sector remains compelling. While the current valuation demands a close look, the robust financial growth and the strong technical forecast of hitting ₹4,000 soon could make current levels attractive for long-term accumulation, particularly on any dips. While the strong promoter holding is a positive indicator, the absence of substantial FII and DII participation implies that sustained institutional demand is yet to fully materialize, which could be a future catalyst.
Would you consider this a "buy on dips" opportunity for the long-term, especially with the ambitious technical target in view, or is the current valuation too steep for comfort?
**Want More?**
👉 Follow me here for honest, data-driven stock breakdowns.
**Disclaimer:** This article is for educational purposes only. Please consult a SEBI-registered financial advisor before making investment decisions.

SENSEX 1D Time frame📍 Current Price Action
Sensex is currently trading around 81,577.
Day’s low is near 81,216 and high is near 81,589.
The index is consolidating near recent highs.
⚖️ Key Levels
Immediate Resistance: 81,600 – 81,850
Next Resistance: 82,000 – 82,200
Immediate Support: 81,200 – 81,000
Strong Support: 80,800 – 80,500
📊 Indicators
Moving Averages: Short-, medium-, and long-term averages are in bullish alignment → trend remains positive.
RSI (14-day): Around 60–62 → shows bullish momentum, not in overbought zone.
MACD: Positive, confirming bullish bias.
📈 Outlook
As long as Sensex holds above 81,000, the bias stays bullish.
A breakout above 81,850 – 82,000 can open upside toward 82,500+.
If it slips below 81,000, a pullback toward 80,800 – 80,500 is possible.
