Short Goldbullish Gartley pattern is in making so target will be 3607.72 and if fails to go up as it is making on top then next target will be 3566.25. lets see.
Fundamental Analysis

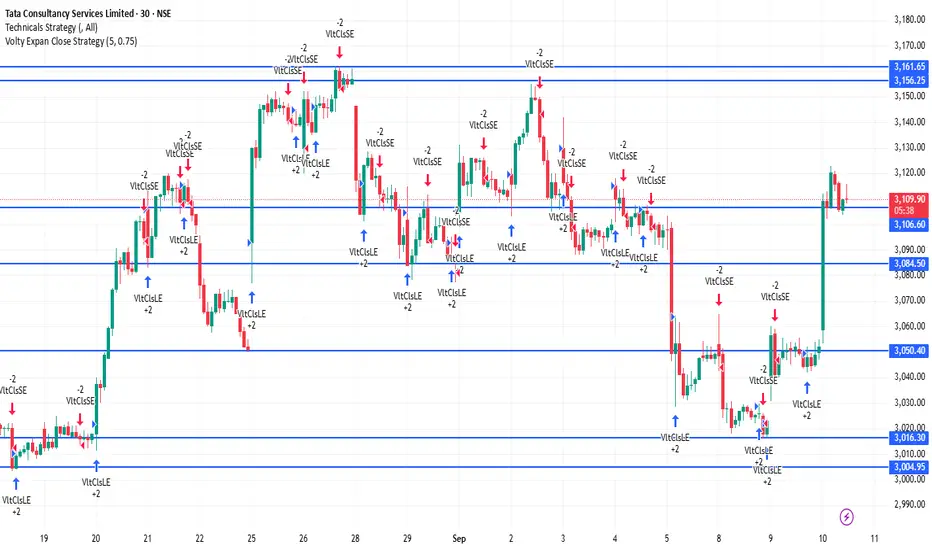
TCS 30Minutes Time frameTCS – 30-Minute Time Frame Important Levels (Current Estimate)
Support Zones
₹3,080 – ₹3,090 → Immediate intraday support
₹3,050 – ₹3,060 → Stronger support level where dip-buying may emerge
₹3,020 – ₹3,030 → Major support; a breakdown here may indicate intraday weakness
Resistance Zones
₹3,130 – ₹3,140 → Immediate intraday resistance
₹3,160 – ₹3,170 → Strong resistance zone; a breakout may extend upward momentum
₹3,200 – ₹3,210 → Major resistance; surpassing this can fuel a more sustained rally
Intraday Trend Outlook (30M Chart)
The trend appears mildly bullish as long as TCS holds above ₹3,080.
A clear move above ₹3,140 can open the path toward ₹3,160–₹3,200.
If it falls below ₹3,050, price may pull back toward ₹3,020, and a break under that could signal further downside.
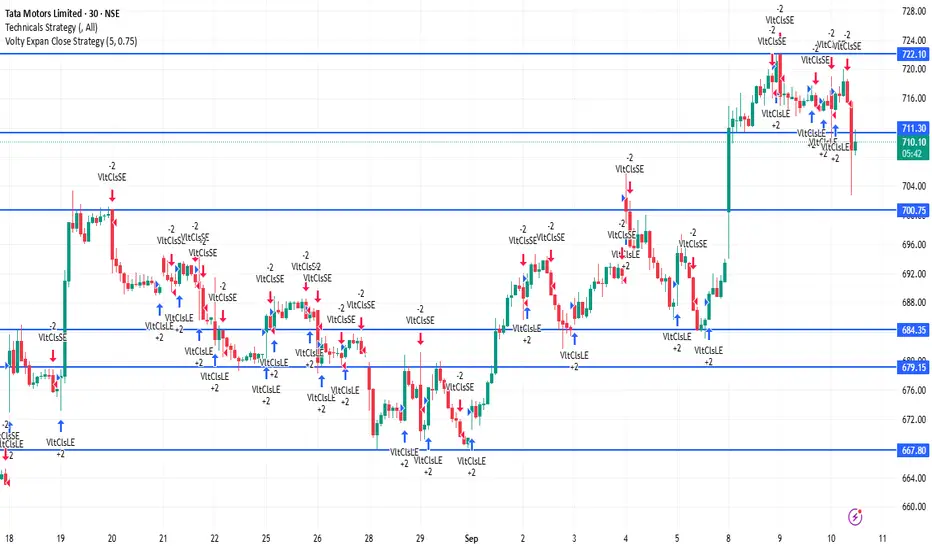
TATAMOTORS 30Minutes Time frame📊 Tata Motors – 30M Technical Levels
🔹 Support Zones
₹708 – ₹710 → Immediate intraday support
₹705 – ₹707 → Strong support zone
₹702 – ₹704 → Critical support; breakdown here can lead to further weakness
🔹 Resistance Zones
₹720 – ₹722 → First major resistance
₹724 – ₹726 → Strong supply zone
₹728 – ₹730 → Intraday breakout level; above this, momentum may pick up strongly
📈 30M Trend Outlook
Stock is sideways to mildly bullish on the 30-min chart.
Above ₹722 → Buyers gain control; possible upside to ₹726–₹730.
Below ₹708 → Weakness likely; price may slip to ₹705–₹702.
As long as it stays above ₹710, bias remains positive in the short term.
Sustainable Finance in India1. Understanding Sustainable Finance
Sustainable finance is broadly defined as financing and investment decisions that take into account not only financial returns but also environmental and social impacts. The core objectives include:
Environmental Responsibility: Supporting initiatives that reduce carbon footprints, promote renewable energy, manage natural resources, and foster climate adaptation.
Social Inclusion: Financing projects that reduce inequality, provide affordable healthcare and education, and support marginalized communities.
Governance Accountability: Ensuring transparency, ethical conduct, and responsible corporate practices.
Sustainable finance is thus the backbone of green growth, which prioritizes ecological balance without compromising development.
2. Evolution of Sustainable Finance in India
The roots of sustainable finance in India can be traced back to the early 2000s, but momentum has significantly increased in the past decade.
2007: India’s first Corporate Social Responsibility (CSR)-linked financing practices gained attention.
2012: Securities and Exchange Board of India (SEBI) introduced mandatory Business Responsibility Reports (BRR) for top listed companies.
2015: The Indian government launched the National Electric Mobility Mission and issued guidelines on renewable energy investments.
2016 onwards: The rise of green bonds and increased global investor interest in India’s renewable energy projects.
2021: India announced the net-zero by 2070 pledge at COP26, creating a roadmap for sustainable financing needs.
2023: SEBI made Business Responsibility and Sustainability Reporting (BRSR) mandatory for top 1,000 listed companies.
This journey reflects India’s gradual integration of sustainability into mainstream finance.
3. Key Drivers of Sustainable Finance in India
Several factors have accelerated the growth of sustainable finance in India:
a) Climate Change Commitments
India has pledged to reduce carbon intensity of GDP by 45% by 2030 and achieve 50% renewable energy capacity by 2030. Financing these transitions requires sustainable investments.
b) Policy and Regulatory Push
Policies like Perform, Achieve, and Trade (PAT) scheme, Renewable Energy Auctions, and SEBI’s ESG reporting mandates have pushed companies to adopt sustainable practices.
c) Investor Preferences
Global and domestic investors are increasingly prioritizing ESG-compliant businesses, leading to a surge in green bonds, ESG mutual funds, and sustainability-linked loans.
d) Corporate Responsibility
Indian companies are realizing that long-term growth depends on environmental stewardship, resource efficiency, and social inclusivity.
e) International Influence
Institutions like the World Bank, Asian Development Bank, and IFC are channeling billions of dollars into India’s green energy and sustainable infrastructure projects.
4. Sustainable Finance Instruments in India
a) Green Bonds
Green bonds are debt instruments where proceeds are used exclusively for financing climate-friendly projects such as solar, wind, waste management, and sustainable transport.
India issued its first green bond in 2015 by Yes Bank.
As of 2023, India has raised over $20 billion through green bonds.
The government launched its first sovereign green bond in 2023 worth ₹16,000 crore.
b) ESG Funds
Mutual funds and asset managers in India are offering ESG-focused funds. As of 2023, ESG funds in India have assets under management (AUM) of over ₹12,000 crore.
c) Sustainability-Linked Loans (SLLs)
Banks and financial institutions are tying loan terms to borrowers’ ESG performance, incentivizing companies to meet sustainability targets.
d) Blended Finance
Combining public and private capital to fund projects like affordable housing, clean water, and renewable energy. This de-risks investments for private players.
e) Carbon Markets
India is developing a voluntary carbon credit market where businesses can trade carbon offsets. This provides a financial incentive for emission reductions.
f) Green Insurance
Insurance products designed to cover renewable energy projects and climate-related risks are gradually emerging.
5. Role of Regulators and Institutions
a) Securities and Exchange Board of India (SEBI)
Introduced BRSR reporting.
Regulates ESG fund disclosures to ensure transparency.
b) Reserve Bank of India (RBI)
Published a Discussion Paper on Climate Risk and Sustainable Finance (2022).
Encouraging banks to assess climate-related risks in lending.
c) Ministry of Finance
Issuing sovereign green bonds.
Partnering with international climate finance organizations.
d) Indian Banks and NBFCs
SBI, ICICI, and HDFC have launched green finance products.
Rural banks are financing solar pumps and microgrids.
e) International Agencies
The World Bank, ADB, and IFC are major contributors to India’s renewable energy financing.
6. Sectors Benefiting from Sustainable Finance
Renewable Energy: Solar, wind, biomass, and hydropower projects.
Electric Mobility: EV infrastructure, charging stations, and battery manufacturing.
Sustainable Agriculture: Organic farming, drip irrigation, and agri-tech solutions.
Green Buildings: Energy-efficient real estate and smart city projects.
Water and Waste Management: Recycling, sewage treatment, and waste-to-energy plants.
Healthcare and Education: Inclusive access to services for underprivileged communities.
7. Challenges Facing Sustainable Finance in India
Despite progress, India faces several hurdles:
Limited Awareness: Many investors and corporates are still unfamiliar with ESG principles.
Greenwashing Risks: Companies sometimes overstate sustainability claims to attract investments.
High Financing Costs: Green projects often involve higher upfront costs and long payback periods.
Regulatory Gaps: Lack of unified sustainability standards across industries.
Limited Domestic Capital: Heavy reliance on foreign investments for green finance.
Infrastructure Bottlenecks: Grid connectivity and storage challenges for renewable energy projects.
8. Case Studies of Sustainable Finance in India
a) ReNew Power
A leading renewable energy company that raised significant funding through green bonds, contributing to India’s solar and wind capacity.
b) State Bank of India (SBI)
Issued green bonds worth $650 million to fund renewable energy and electric mobility.
c) Government’s Sovereign Green Bonds (2023)
Proceeds allocated to solar energy projects, afforestation, and energy-efficient housing.
Conclusion
Sustainable finance is not just a trend in India—it is a necessity. With climate change posing existential risks, the integration of ESG principles into financial systems is essential for long-term stability and growth. India, as one of the world’s fastest-growing economies and a key player in global climate action, must continue to accelerate its sustainable finance journey.
The combined efforts of regulators, corporations, investors, and citizens will shape India’s financial ecosystem into one that is resilient, inclusive, and aligned with the United Nations Sustainable Development Goals (SDGs). From sovereign green bonds to ESG-driven investments, India is laying the foundation of a sustainable financial future that balances profit with purpose, growth with inclusivity, and development with environmental stewardship.

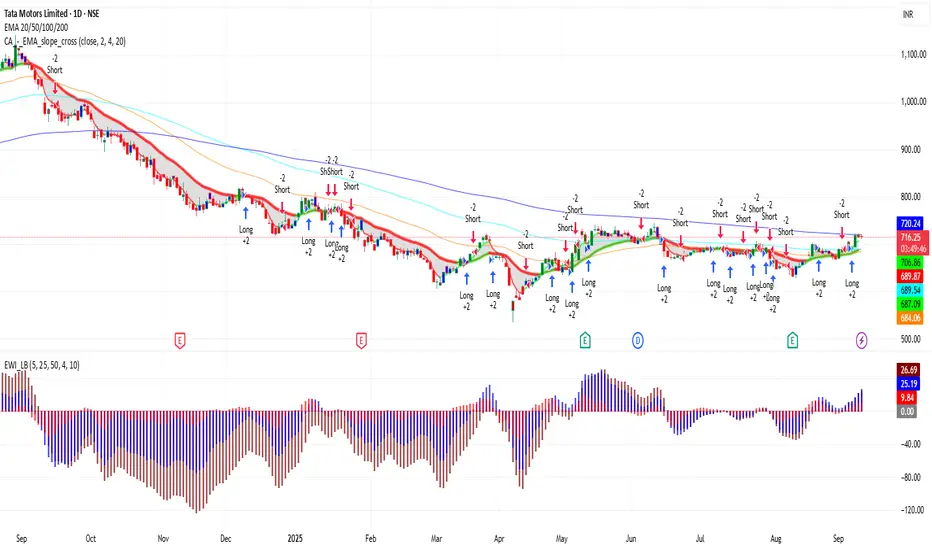
TATAMOTORS 1D Time frame📍 TATAMOTORS – 1D Important Levels (Current)
🔹 Support Zones
900 – 910 → Immediate daily support
870 – 880 → Strong support; buyers likely to defend here
835 – 850 → Major support; breakdown here may shift trend bearish
🔹 Resistance Zones
940 – 950 → Immediate daily resistance
970 – 980 → Strong resistance; breakout above this can fuel momentum
1,000 – 1,020 → Major psychological resistance; if crossed, bullish trend strengthens further
⚖️ Daily Trend Outlook
Tata Motors is in a bullish phase on the daily chart, making higher lows and sustaining above key supports.
As long as price holds above 900, the stock remains positive.
A breakout above 950 – 980 may open the path towards 1,000+.
A breakdown below 900 may lead to weakness toward 880 – 850.
KOTAKBANK 1D Time frame📍 KOTAKBANK – 1D Important Levels (Current)
🔹 Support Zones
1,730 – 1,750 → Immediate daily support
1,680 – 1,700 → Strong support; buyers likely to defend here
1,620 – 1,640 → Major support; breakdown here may turn trend bearish
🔹 Resistance Zones
1,780 – 1,800 → Immediate daily resistance
1,830 – 1,850 → Strong resistance zone
1,900 – 1,920 → Major resistance; breakout above this can fuel strong upside momentum
⚖️ Daily Trend Outlook
Kotak Bank is currently in a sideways to mildly bullish phase on the daily chart.
Price is consolidating between 1,730 support and 1,800 resistance.
A breakout above 1,800 – 1,850 could trigger a rally towards 1,900+.
A breakdown below 1,730 may drag the stock toward 1,700 – 1,640.

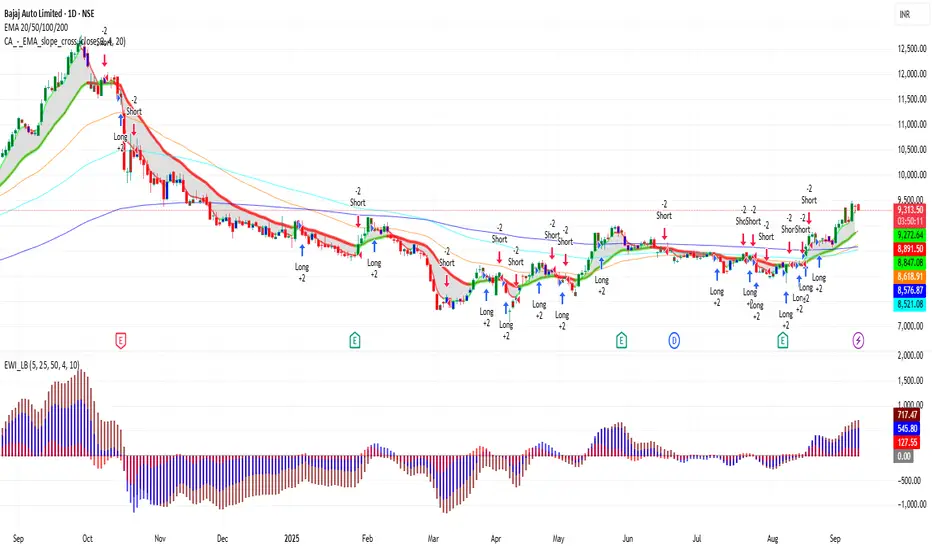
BAJAJ_AUTO 1D Time frame📍 BAJAJ_AUTO – 1D Important Levels (Current)
🔹 Support Zones
9,050 – 9,100 → Immediate daily support
8,800 – 8,900 → Strong support; buyers likely to defend this zone
8,500 – 8,600 → Major support; breakdown here may shift trend bearish
🔹 Resistance Zones
9,300 – 9,400 → Immediate daily resistance
9,550 – 9,650 → Strong resistance zone; breakout may extend upside momentum
9,800 – 10,000 → Major psychological resistance; if crossed, bullish trend strengthens further
⚖️ Daily Trend Outlook
Bajaj Auto is in a bullish structure on the daily chart, forming higher lows.
As long as price stays above 9,050, the stock remains positive.
A breakout above 9,400 – 9,650 can take it towards 9,800 – 10,000.
A breakdown below 9,050 could drag it towards 8,900 – 8,600.
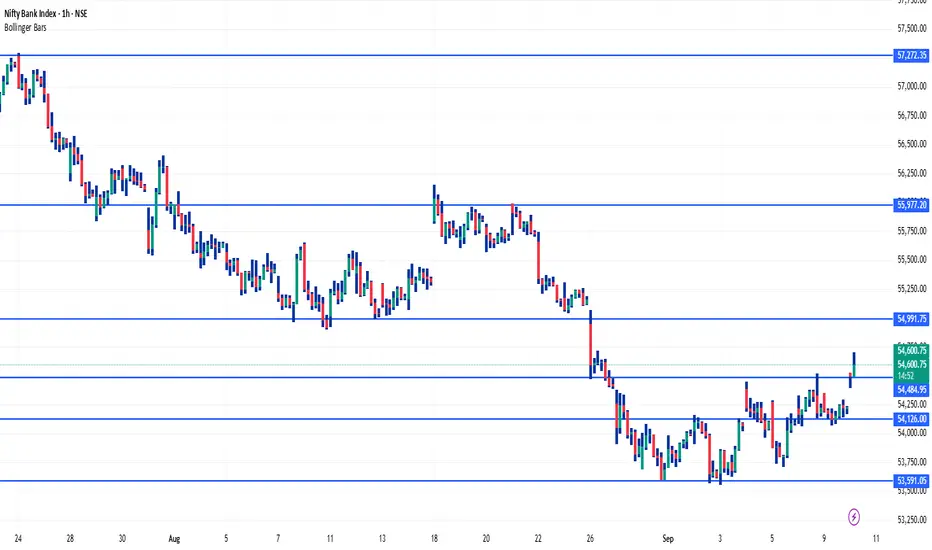
BANKNIFTY 1Hour Time frame📍 Bank Nifty – 1H Important Levels (Current)
🔹 Support Zones
47,800 – 47,900 → Immediate intraday support
47,400 – 47,500 → Strong support; buyers expected to defend here
47,000 – 47,100 → Major support; breakdown here can invite heavy selling
🔹 Resistance Zones
48,400 – 48,500 → Immediate 1H resistance
48,800 – 48,900 → Strong resistance zone
49,200 – 49,300 → Major resistance; breakout here may fuel a rally
⚖️ Quick Summary
Bias: Range-bound with a bullish tilt as long as Bank Nifty trades above 47,800.
Breakout above 48,500 can push towards 48,900 – 49,300.
Breakdown below 47,800 can drag the index to 47,400 – 47,000.
Current watch zone: 47,800 – 48,500.
USDJPY 1H📍 USDJPY – 1H
🔹 Support Zones
147.80 – 148.00 → Immediate intraday support
147.30 – 147.50 → Strong support; buyers likely active
146.80 – 147.00 → Major support; breakdown here may extend bearish momentum
🔹 Resistance Zones
148.50 – 148.70 → Immediate intraday resistance
149.00 – 149.20 → Strong resistance; breakout can trigger further rally
149.70 – 150.00 → Major psychological resistance
⚖️ Quick Summary
Bias: Currently range-bound with a bullish tilt as long as price stays above 147.80.
Breakout above 148.70 may open the way towards 149.20 – 150.00.
Breakdown below 147.80 may drag price back to 147.30 – 147.00.
Current watch zone: 147.80 – 148.70.

Solana Breakout: Ready for Bull Rally After Key Resistance FlipSolana (SOL) has decisively broken out above key resistance in September 2025, signaling strong bullish momentum as traders eye new targets.
Technical Setup and Breakdown:
Solana (SOL) has decisively broken out above the key resistance zone of $200–$210, a level that capped price gains for months. This breakout is validated by a significant surge in trading volume, signaling strong market conviction behind the move. The previous resistance now flips to support, setting a solid foundation for the next leg of the rally toward $250.
What’s Next? Scenarios and Targets:
The breakout sets the stage for two primary scenarios:
1. Bullish Continuation: If price holds above $210 and builds momentum, Solana could quickly revisit $244–$250 and higher, especially if the crypto market remains positive. Some projections for 2025 suggest targets as high as $350, though immediate monthly resistance sits closer to $250.
2. Pullback Risk: If price fails to sustain above new support, a retest of the Support zone near $205–$210 is possible, providing a key reaction zone for traders.
Final Take:
This chart offers traders a textbook example of a confirmed breakout with actionable price levels and volume confirmation. It provides a structured roadmap for both breakout traders and momentum investors focused on Solana’s bullish momentum.

Gold Breaks $3,600/oz: Fed Rate Cut Hype & Trading Setups!Namaste, traders! Gold (XAU/USD) has blasted through $3,600/oz for the first time on Monday (08/09/2025), smashing a new all-time high as weak US jobs data ramps up bets for a Fed rate cut next week. With a massive 38% YTD gain after 27% in 2024, gold's on fire—driven by a weakening USD, central bank hoarding, easing policies, and global uncertainty. For Indian investors, this is prime time amid rising demand and INR volatility. Let’s analyze today’s (09/09/2025) market and spot trading opportunities! 💰
Fundamental Analysis: Why Gold’s Rally Is Unstoppable 🌟
Historic Break: Weak US jobs (August growth slowed, unemployment at 4.3%) has markets pricing in an 88% chance of 0.25% rate cut and 12% for 0.5% in September, per CME FedWatch. Low rates slash the opportunity cost for non-yielding gold—perfect for India’s festive season buys! 📈
Expert View: Peter Grant from Zaner Metals sees gold hitting $3,700–$3,730/oz short-term, with dips as buy chances. Ongoing labor weakness and Fed easing into 2026 will keep supporting it.
Global Boosters: China’s PBOC extended gold buys to 10 months in August. Falling USD and 10-year Treasury yields near 5-month lows make gold even more attractive for Indian rupee holders.
Data Watch: Eye US PPI (10/09) and CPI (11/09) for Fed clues. Tariff wars and geopolitics add safe-haven fuel—great for India’s gold ETFs and physical demand.
Gold’s your ultimate hedge in this setup—will the Fed’s cut keep the party going for Indian portfolios?
Technical Analysis: Breakout Frenzy with Traps—Buy the Dips! 📉
Gold’s power surge blew past 3600 with no brakes, but eye the Fibo 2.618 at 3685 for a possible breather. Bullish momentum screams BUY, but watch FVG traps from the fast climb. Key focus: 3641—break below pulls back to 3600; hold above and bulls target 3685. Ideal for Indian traders riding the rupee-gold link!
Key Resistance: 3663 - 3673 - 3685 - 3690
Key Support: 3641 - 3629 - 3596 - 3581
Trading Opportunities:
Sell Scalp: 3673 - 3675
SL: 3679
TP: 3670 - 3665 - 3660 - 3655
Sell Zone: 3684 - 3686
SL: 3694
TP: 3676 - 3666 - 3656 - 3646 - Open
Buy Scalp: 3641 - 3639
SL: 3635
TP: 3644 - 3649 - 3654 - 3659
Buy Zone: 3605 - 3603
SL: 3595
TP: 3613 - 3623 - 3633 - 3643 - Open
Gold’s breaking out big, but traps await—confirm at key levels! Holds support? Bulls aim for 3685. 📊💡
#Gold #XAUUSD #Fed #USJobs #TradingView #MarketUpdate #Forex #Investing #TechnicalAnalysis #GoldTrading #Finance #Crypto #IndiaTrading #INR #MCX

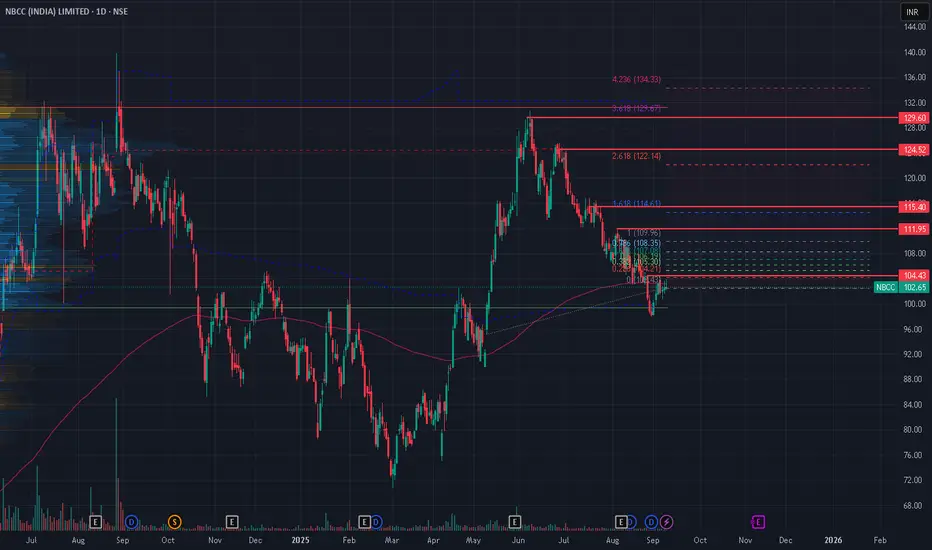
NBCC ANALYSIS NBCC (India) Ltd is fundamentally strong with impressive growth, high profitability, and sector leadership, but valuations are currently stretched versus recent earnings. Technical indicators are bullish, signaling potential upside. Peer comparison highlights NBCC’s strong returns and capital efficiency among real estate and construction stocks. Brokerage targets suggest moderate gains in the next 6–12 months.
***
## Fundamental Analysis
- **ROCE:** 39.22% (FY2025), consistently high and sector leading.
- **ROE:** 23.7% (FY2025), higher than most competitors (DLF 7.8%, Godrej Properties 6.3%).
- **CAGR (5Y):** Revenue CAGR 14.71%, PAT CAGR 24.44%, Operating Profit CAGR 43.51% (FY21–FY25)
- **Debt:** Debt-free with strong balance sheet and high interest coverage.
- **Fair Value:** Trading 103% above EV/EBITDA model fair value; P/E is 47.2x (TTM), above historical average for the sector.
- **Market Cap:** ₹27,618 Cr.
***
## Technical Analysis
- **Current Price:** ₹102.65 as of 9 Sept, 2025.
- **Trend:** Bullish across all major moving averages and oscillators (RSI, MACD, Stochastics).
- **Key Support Levels:** ₹100 (psychological), ₹98 (recent low).
- **Resistance/Targets (Fibonacci):** ₹104.43, ₹111.95, ₹115.40, ₹124.52, ₹129.60, ₹134.33 (major pivots/post-breakout targets in chart).
- **Volatility:** Recent correction offers accumulation zone, with upward momentum building in September.
***
## Brokerage & Peer Comparison
| Company | ROCE | ROE | PE Ratio | 5Y Sales CAGR | Market Cap (₹ Cr) | Target (₹, 6M–1Y) | Sector Avg PE |
|-------------------|--------|--------|----------|---------------|-------------------|-------------------|---------------|
| NBCC (India) Ltd | 39.2% | 23.7% | 47.2x | 14.7% | 27,618 | 115–120 (consensus) | 43.3x |
| DLF Ltd | 7.8% | 6.9% | 68.3x | 11.9% | 187,084 | 140–145 | |
| Godrej Properties | 6.3% | 5.6% | 38.1x | 8.4% | 59,107 | 1750–1800 | |
| Oberoi Realty | 13.9% | 6.4% | 28.9x | 12.4% | 59,410 | 1340–1400 | |
| Phoenix Mills | 10.2% | 8.4% | 41.5x | 11.1% | 54,265 | 2150–2200 | |
| Prestige Estates | 6.1% | 4.7% | 97.4x | 9.3% | 65,103 | 750–800 | |
- NBCC’s ROCE and ROE are **well above sector average**, signaling top operational performance.
***
## Market Share & Three-Year Outlook
- NBCC holds a significant share in government and public sector project management, specializing in redevelopment and infra construction.
- Growth is led by steady order book (~₹60,000+ Cr), executing marquee projects (government colonies, Bharat Vandana Park).
- With government infra push and NBCC’s debt-free profile, analysts expect 15–16% annual growth in topline with margin expansion.
- Prospects are positive for the next 3 years, with brokerage consensus targets of ₹115–120. Robust financials and business pipeline support steady double-digit CAGR, but valuation caution is advised for fresh entries at current levels.
***
**NBCC remains a leader in project management with strong returns, high growth, and bullish technicals, offering a solid medium-term investment outlook among peers but currently trading at a valuation premium**.
Max Healthcare Institute ANALYSIS Max Healthcare Institute Ltd is **fundamentally robust** and remains a sector leader, demonstrating above-average growth, profitability, and strong market positioning. Technicals suggest mild volatility with a moderately bullish range. Brokerages set an optimistic target, and Max’s returns outperform most listed hospital peers. See comparisons and a 3-year growth outlook below.
***
## Fundamental Analysis
- **ROCE:** 14.67% (FY2025), consistent and sector-leading; history: 16.26% (2024), 15.32% (2023).
- **ROE:** ~19.6% (TTM), among the highest in healthcare peers, well above Fortis (13.1%) and Apollo (~14%).
- **CAGR:** Net profit growth CAGR of ~28–33% over 3 years; revenue CAGR ~20–22% (FY21–FY25).
- **Debt & Balance Sheet:** Virtually debt-free; healthy interest coverage and operating cash flow.
- **Market Share:** Max holds ~19% of organized hospital sector market cap, second only to Apollo Hospitals.
***
## Technical Analysis
- **Trend:** Mildly bullish on daily chart but cautious due to bearish signals in weekly/monthly MACD/Bollinger Bands.
- **Support Levels:** ₹1,140, ₹1,100.
- **Resistance Zones:** ₹1,212, ₹1,255, ₹1,275, ₹1,303 (Fibonacci levels shown in image are next upside targets).
- **Volatility:** 52-week range ₹873.50–₹1,314.30; currently at lower end, suggesting good accumulation zone if market supports.
- **Momentum:** Daily moving averages give bullish cues, but medium-term caution warranted.
***
## Brokerage View & Target
- **Nuvama:** ‘BUY’ rating, ₹1,430 target (25% upside), driven by expansion to 9,400 beds by FY29 and strong margin retention
- **Industry Forecast:** Revenue CAGR 20% (FY25–28); Ebitda margins forecast to hold at 27–28% during capex cycle
- **Risks:** Doctor attrition, competition, and insurance cost pressure may cause temporary volatility.
***
## Peer Comparison Table
| Company | ROCE | ROE | 3Y CAGR (Sales) | Market Cap (₹ Cr) | RN Profit CAGR | Next Target (₹) | Market Share (%) |
|-----------------|--------|--------|-----------------|-------------------|----------------|---------------------|------------------|
| Max Healthcare | 14.7% | 19.6% | 20–22% | 1,11,816 | 28–33% | 1,430
(Nuvama) | 19 |
| Apollo Hospitals| 12.8% | 14% | 17% | 68,198 | 20% | 8,500 (consensus) | 32 |
| Fortis Healthcare| 13.1% | 11% | 16% | 21,954 | 15% | 1,060 (consensus) | 7.5 |
| Narayana Health | 10.5% | 8.2% | 15% | 21,583 | 12% | 1,210 (consensus) | 7.2 |
| Global Health | 9.1% | 10% | 13% | 16,950 | 10% | 1,580 (consensus) | 5.1 |
***
## Investment Outlook (Next 3 Years)
- **Growth Drivers:** Bed additions (target 9,400 beds by FY29), brownfield capex, technology-led outcomes, cash flow-funded expansion, and retention of leading margins.
- **Market Position:** Second-largest private hospital operator, high institutional holdings (>72%), strong cash flow for capex with leadership in North and growing pan-India footprint.
- **Summary:** Max Healthcare is well-positioned for ~25% upside over 6–12 months, sustainable double-digit (20%+) profit and sales CAGR, and steady margin leadership. Outlook remains attractive for accumulation on dips and long-term portfolio retention.
---

DTA PATTERNS - ANALYSIS **Data Patterns (India) Ltd** shows robust fundamentals and a bullish technical setup, albeit trading far above its fair value. Analysts expect continued growth, driven by strong defense and aerospace demand, but caution on premium valuation. Here’s a detailed summary with ROCE, ROE, CAGR, fair value, resistance/support, and target, plus competitive analysis.
***
## Fundamental Analysis
- **ROCE:** ~22.5% (TTM), indicating exceptional capital efficiency.
- **ROE:** ~19.2% (TTM), similar to top defense sector peers.
- **CAGR (3Y):** Estimated 54–58% stock price CAGR; revenue CAGR ~36%
- **Fair Value:** Median model puts fair value at ₹280 (EV/EBITDA), but more bullish models suggest up to ₹1,975 (Price/Sales).
- **Valuation Multiples:** P/E 66.82x (TTM), P/B 9.42, highlighting a premium to sector and market.
***
## Technical Analysis
- **Current Price:** ₹2,560.80 (as of Sep 2025).
- **Support Zones:** Near ₹2,350–2,400, also at ₹2,020 (major base).
- **Resistance Levels:** Fibonacci pivots at ₹2,735, ₹2,840, ₹3,010, ₹3,285 (major upside targets).
- **Momentum:** 20-day and 200-day moving average crossover signals recent bullish momentum, with ~13.5% average gains in prior cycles.
- **Target (Next 6 Months):** Analyst consensus targets ₹3,136–₹3,700, with the most conservative at ₹2,500.
***
## Competitive & Brokerage View
- **Peers:** Bharat Electronics (ROCE ~20%, lower valuation), Hindustan Aeronautics, Bharat Dynamics.
- Data Patterns ranks highest in margin, order pipeline, and growth of indigenous defense electronics.
- Brokerages have a “Strong Buy” bias with only valuation caution; strategic government contracts and indigenization drive growth.
***
## Summary Table
| Metric | Value/Level | Remarks/Peers Comparison |
|----------------|-----------------------------|-------------------------------------------------------|
| **ROCE** | ~22.5% | Highest among defense electronics peers |
| **ROE** | ~19.2% | Near sector best |
| **CAGR (3Y)** | 54–58% (stock), 36% (sales) | Rapid revenue and price growth |
| **Fair Value** | ₹280 (EV/EBITDA median) | Price/EBITDA models sharply below market price |
| **Current Price** | ₹2,560.80 | As of Sep 2025 |
| **Support** | ₹2,350–2,400, ₹2,020 | Key volume bases |
| **Resistance** | ₹2,735, ₹2,840, ₹3,010 | Fibonacci and prior highs |
| **6M Target** | ₹3,136–₹3,700 | Analyst consensus |
| **Peers** | BEL, HAL, BDL | Slight edge in margins/order visibility |
***
Data Patterns (India) Ltd is trading at a **significant valuation premium** compared to its defense sector peers, with higher price-to-earnings and price-to-book multiples, suggesting elevated growth expectations from investors versus most competitors.
## Valuation Comparison Table
| Company | P/E Ratio | P/B Ratio | Market Cap (₹ Cr) | Valuation Premium to Fair Value |
|-------------------------------|-------------|-------------|-------------------|-------------------------------|
| Data Patterns (India) Ltd | **66.82x** | 9.42x | 14,334.3 | 807% above fair value |
| Hindustan Aeronautics Ltd | 36.03x | Not shown | 297,839.0 | Moderate |
| Bharat Electronics Ltd | 49.76x | Not shown | 272,033.0 | Moderate |
| Bharat Dynamics Ltd | 93.06x | Not shown | 52,187.5 | High (outlier) |
| Zen Technologies Ltd | 47.45x | Not shown | 12,974.3 | Moderate |
| Astra Microwave Products Ltd | 62.07x | Not shown | 9,531.5 | Moderate |
| Paras Defence & Space Tech | 84.24x | Not shown | 5,195.1 | High |
| Rossell India Ltd | 17.75x | Not shown | 246.2 | Low |
- **Industry Median P/E:** 62.07x
- **Industry P/E Range:** 17.75x (lowest) to 93.06x (highest).
## Highlights
- Data Patterns’ **P/E of 66.82x** is above the industry average (60.15x) and close to the median, but its fair value premium (+807%) is among the highest in the sector—suggesting investors are factoring in strong order flows, rapid earnings growth, and superior margins.
- Price-to-book ratio of **9.42x** further confirms valuation stretching compared to most established defense peers.
- Only Bharat Dynamics and Paras Defence show similar or greater valuation multiples, usually reflecting cyclical earnings or momentum phases rather than long-term sustainability.
- Other large peers—such as Hindustan Aeronautics and Bharat Electronics—have lower P/E ratios despite bigger size and similar growth rates, indicating more reasonable market expectations.
## Takeaway
- **Data Patterns’ current valuation is at a substantial premium** to both its intrinsic value and most sector peers, justified only if its high growth sustains and market conditions remain favorable.
## Investment Outlook
- **Strengths:** High ROCE/ROE, strong sector tailwinds, margin leadership, and robust order book.
- **Risks:** Valuation premium (trading 807% above median fair value), short-term volatility possible if sector sentiment reverses.
- **Conclusion:** Data Patterns is favored for long-term growth but caution is advised for fresh entry at current levels; consider adding only on market dips and sector pullbacks.
[

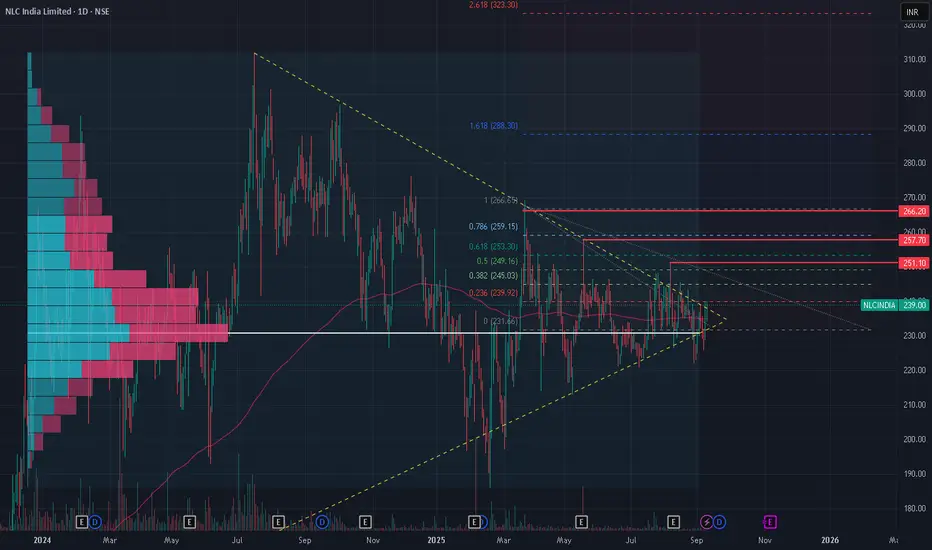
NLC INDIA - ANALYSISNLC India Ltd demonstrates **sound fundamentals** and a mixed technical outlook for September 2025, currently trading at a premium versus its fair value. The stock’s next six months’ target is moderately bullish, supported by its sector position but challenged by valuations and momentum. Below is a **comparative table and analysis** summarizing brokerage views, intrinsic value, ROCE, ROE, fair value, CAGR, and peer comparison.
## Fundamental Analysis
- **ROCE:** 7.7% (TTM) – indicates moderate capital efficiency, below some peers in the power/utilities sector.
- **ROE:** 14% (FY25, up from 10.5% five-year average) – recent improvement, outpacing sector averages.
- **CAGR (3Y):** Annual share price CAGR ~10.3%; revenue CAGR ~21.1%.
- **Fair Value:** Median model values NLC at ₹127.56; currently trading at an 87% premium to this estimated fair value.
- **Valuation:** P/E 11.1, P/B 1.44, P/S 2.11 – relatively low multiples versus sector and overall market, but elevated against its fair value.
## Technical Analysis
- **Trend:** Mildly bearish short-term; daily/weekly moving averages lean weak, though MACD/KST provide slight bullish hints.
- **Momentum:** Pivot resistance levels at ₹251, ₹257.7, and ₹266.2; support near ₹231–234, with price consolidating post breakout.
- **Upside Signals:** Recent EMA crossovers imply possible 3–5% upward moves over the short term if RSI strengthens and volume confirms.
- **Target (6M):** Brokerage consensus (Motilal Oswal, etc.) sees a target of ₹304 (+27%), with technical targets ranging ₹251–266 if resistance levels break.
## Brokerage View & Peer Comparison
| Stock | ROCE | ROE | CAGR (3Y) | Fair Value (₹) | Current Price (₹) | Next 6M Target (₹) | Major Competition |
|--------------|--------|-------|-----------|----------------|-------------------|--------------------|-----------------------------|
| **NLC India**| 7.7% | 14% | 10.3% | 127.56 | 239 | 251–304 | NTPC, Power Grid, Adani Power |
| NTPC | 14% | 11% | 12% | -- | 236 | 260–270 | NLC, Tata Power, Adani |
| Power Grid | 10.5% | 18% | 15% | -- | 230 | 250–280 | NTPC, NLC, Adani |
| Adani Power | 8% | 16% | 17% | -- | 532 | 580–620 | NTPC, Power Grid, NLC |
**Brokerage Opinion:** Motilal Oswal and other analysts rate NLC a medium-term 'BUY', targeting ₹304 based on sector expansion (10GW renewables by 2030). Peer stocks generally produce slightly higher capital returns
## Key Support, Resistance & Outlook
- **Support Zones:** ₹231–234, coinciding with breakout base and large volume node.
- **Resistance Levels:** ₹251, ₹257.7, ₹266.2, extending to ₹288 if sector momentum improves.
- **6-Month Target:** Consensus and technical models see ₹251–304 achievable if stock overcomes resistance, with downtrend risk if momentum deteriorates.
The **key drivers for NLC India's future growth potential** are its aggressive expansion into renewables, ongoing lignite mining and power generation, policy tailwinds, and strong financial performance supported by strategic investments. These elements position NLC as a major growth-focused utility in India
## 1. Renewable Energy Expansion
- NLC India is targeting to increase its renewable energy capacity from approximately **1.4 GW to 10 GW by 2030**, with a planned investment of ₹50,000–₹60,000 crore.
- Solar and wind energy projects are a strategic focus, supporting government targets for clean energy adoption and offering long-term growth opportunities.
- Large-scale IPO plans for its renewable arm (NIRL) to raise capital for this expansion further enhance NLC’s financial flexibility.
## 2. Lignite Mining & Thermal Power
- Lignite mining remains a core business, supplying fuel for NLC’s large thermal power stations and meeting regional power needs with cost-effective, captive resources.
- Joint ventures (e.g., Rajasthan Rajya Vidyut Utpadan Nigam) and operational launches like Ghatampur Thermal Power Plant have increased installed power capacity, directly impacting revenues and profits.
## 3. Financial Performance & Investments
- Strong quarterly results: Q3FY25 revenue up 39% YoY and net profit up 167%, reflecting robust cash flow and significant dividend payouts that support both growth and shareholder returns.
- Strategic capex investments (₹52.5 bn in nine months, FY25) for capacity building and technology enable sustainable growth.
## 4. Government Support & Policy Tailwinds
- As a government-owned entity, NLC benefits from regulatory and policy support for infrastructure, clean energy, and energy security initiatives, enhancing its competitive position.
- Policy frameworks incentivizing renewable capacity and carbon footprint reduction are key long-term growth drivers.
## 5. Operational Efficiency & Diversification
- Investments in automation, mine modernization, and green hydrogen projects position NLC for enhanced efficiency, safety, and new revenue streams.
- Diversification into renewables is reducing dependency on fossil fuels, improving ESG profiles and creating new markets.
## Conclusion
The combination of **massive renewable energy expansion, robust financials, diversification, continued mining strength, and supportive policy environment** provides NLC India sustained multi-year growth potential. Investors can expect the company to benefit from the ongoing energy transition, rising power demand, and capital market initiatives over the coming years.
## Summary
- NLC India is fundamentally **solid but presently overvalued**. Momentum is mixed, with slight short-term bullish cues.
- Six-month target is **₹251–304**, contingent on technical breaks and sector performance.
- ROCE, ROE, and CAGR are improving but **slightly lag major peers**. Investors should watch resistance levels and valuation premiums before fresh entries
eClerx Services Limited Long term Bet **eClerx Services Limited** is fundamentally strong but currently appears to be overvalued, with technical indicators showing mixed signals for short-term momentum. The target for the next six months ranges between ₹4,050 and ₹4,500, reflecting moderate upside potential, though valuations and profit booking may cause volatility.
## Fundamental Analysis
- **Revenue & Profit**: Trailing twelve months (TTM) revenue is ₹3,518 crore, with net profit at ₹571 crore. The company boasts healthy gross margins (~36%) and a solid net profit margin (~16%).
- **Valuation**: P/E ratio is 36.16 (TTM), making it expensive compared to sector peers; P/B stands at 9.21 and P/S at 5.87. The stock trades at a 51% premium to estimated intrinsic value (~₹2,860); fair value models cluster between ₹2,098 and ₹2,872.
- **Dividend & Shareholding**: Dividend payout is modest (₹1.00 per share, upcoming October 2025). Promoters hold the majority stake (53.8%), with high FII and DII interest.
- **Sector & Business Model**: eClerx serves top global sectors like finance, telecom, retail, offering advanced analytics and business process management. Expansion in US/Europe and digital solutions provide growth levers.
## Technical Analysis
- **Trend and Momentum**: Recent charts indicate a trading range bound near ₹4,300–4,400, with recent resistance near ₹4,588. Risk/reward ratios for short-term trades are favorable, but overall technical indicators lean towards 'Strong Sell'—a cautionary sign suggesting limited momentum in the near term.
- **Market Moves**: The stock fell 2.5% on September 5, but recovered in the following days, with volume profile indicating decent buyer interest below ₹4,300.
- **Support and Resistance**: Key support seen near ₹4,220–4,250; resistance is likely at ₹4,588. A break above ₹4,450 could open higher targets, while losses below ₹4,220 may trigger downside towards ₹4,050.
## Six-Month Target
| Source | Target (INR) | Time Frame |
|--------------|-------------------|--------------|
| TradingView | 4,053–4,500 | 6 months |
| Analyst Consensus | ~4,200–4,450 | 6 months |
| Technical Pivot | ~4,360 (current), with breakout potential to 4,588 | 6 months |
Analysts expect eClerx to trade between ₹4,050 and ₹4,500 over the next six months, with potential upside if business momentum and sector conditions remain favorable.
## Investment Outlook
- **Positives**: Strong fundamental growth, diversified business model, and consistent margins support long-term investment.
- **Risks**: High valuation premium, sector rotation, and overbought technicals may lead to periodic corrections.
- **Verdict**: eClerx Services is fundamentally robust but requires cautious approach for fresh entries given its premium pricing; ideal for accumulation on dips with a target up to ₹4,500 if sector tailwinds persist.
Here is a detailed table of **ROCE, ROE, CAGR, fair value, resistance, support, and 6-month target** for eClerx Services Limited, compiled from current data and recent technical levels:
| Metric | Value/Level | Source/Remarks |
|-----------------|---------------------------|-------------------------------------------------------|
| **ROCE** | 33.1% | Strong efficiency; sector-leading |
| **ROE** | 23.4%-24.3% | Latest 2025 values; robust |
| **CAGR (5Y)** | ~57% | 5-year annual return |
| **Fair Value** | ₹2,860 | Median intrinsic valuation |
| **1-Year High** | ₹4,640 | Technical resistance zone |
| **1-Year Low** | ₹2,168 | Technical support zone |
| **Current Price** | ₹4,338 | As of Sept 2025 |
| **Resistance** | ₹4,450–₹4,640 | Next upside hurdles |
| **Support** | ₹4,220–₹4,250 | Immediate downside guards |
| **Target (6M)** | ₹4,050–₹4,500 | Analyst/technical forecast |
All numbers are based on consolidated, trailing twelve months (TTM), annual returns, and latest analyst consensus as of September 2025.
- **ROCE** and **ROE** reflect strong operational and equity efficiency, supporting higher valuations.
- **CAGR** (~57%) shows powerful historical wealth creation, though fair value (₹2,860) warns of premium pricing.
- Support/resistance/target levels reflect current chart analysis and expert views for next six months.

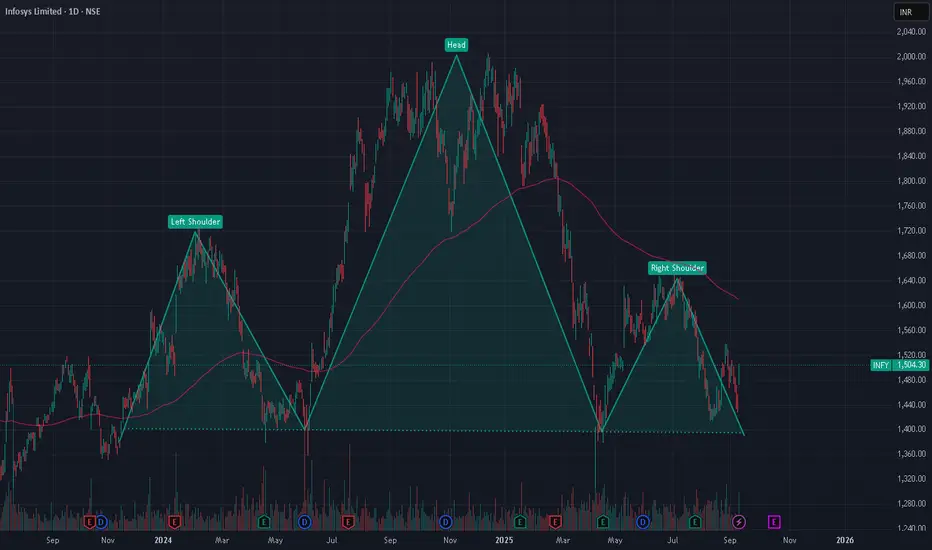
INFY showing Head and Shoulder Pattern - Analysis Infosys (INFY) has formed a prominent **head and shoulders pattern** on its daily chart around September 2025, signaling a possible bearish trend reversal. Recent news and brokerage views show cautious optimism, but global factors—especially upcoming US regulations and tax proposals—are causing market volatility and uncertainty in the IT sector.
## Head and Shoulders Pattern Analysis
- The chart for Infosys displays a classic **head and shoulders formation**, with visible left shoulder, head, and right shoulder, generally seen as a bearish reversal signal after a preceding uptrend.
- Key support levels observed: around ₹1345–1376 where the stock has repeatedly bounced, and resistance at ₹1645–1650, which INFY has failed to breach recently.
- Breakdown below the neckline (current support range) could trigger a move towards ₹1150; however, some analysts argue the pattern’s symmetry and volume confirmation are lacking for a textbook reversal, so a decisive breakout is awaited.
- RSI hovers at neutral levels (~50), suggesting indecision and the need for confirmation before traders take strong positions.
## Brokerage Views and Target Prices
- **Nomura:** Maintains a ‘Buy’ rating, with a target of ₹1,880, slightly reduced from ₹1,900. This indicates ~19% potential upside from recent prices.
- **Jefferies:** Also retains a ‘Buy’ call, targeting ₹1,700 (~22% upside), noting strong cash flows despite a ~26% correction YTD.
- Many top brokerages still consensus ‘Buy’ for Infosys, with 26 out of 39 analysts in strong agreement. However, there are isolated bearish calls (e.g., CapitalVia’s ₹1,000 target).
- Trading range in the near term is forecast between ₹1,334–1,574.
## Impact of US News on INFY Shares
- **Buyback Announcement:** Infosys’ decision to consider a share buyback on September 11, 2025, sparked a bounce in IT stocks, including a 4% surge in INFY, temporarily boosting sector sentiment.
- **US Tax Threats:** The HIRE Act proposes a steep 25% excise tax on payments by US companies to foreign service providers, making Indian IT exports less competitive and worrying investors about FII outflows and renewed tariffs.
- FIIs sold nearly ₹32,000 crore of Indian IT shares in July-August, leading to a correction in INFY and peers.
- Market players are watching for US diplomatic resolutions—any positive news could stabilize IT stocks, but implementation of tough US policies would likely trigger further downside.
- **US Rate Cuts:** Hopes of US interest rate reductions have lent some support, as weaker dollar could help Indian exporters, but persistent trade tensions remain a headwind.
## Conclusion
- The **head and shoulders pattern** in Infosys charts indicates caution; a breakdown below neckline supports could lead to sharp declines.
- Brokerages see upside potential, with targets around ₹1,700–1,880, but are wary of international regulatory risks—especially from the US
- Buyback news is currently bolstering price and sentiment, counteracting negative US headlines, but the outlook remains highly sensitive to global policy shifts.
Careful attention to technical confirmation, brokerage guidance, and evolving US market news is recommended before making investment decisions in Infosys.
NIFTTY HEAD AND SHOULDER PATTAERN - UPTREND A head and shoulders pattern has emerged on the Nifty 50 Index daily chart, which suggests possible trend reversal or limited upside unless key resistance levels are broken. Sector composition, support, resistance, and uptrend supporting stocks are provided below for your holistic Nifty analysis.
***
## Nifty Head & Shoulders Analysis
**Pattern Status:**
- The head and shoulders topping pattern is confirmed, but *becomes bearish only if the neckline (support at 24,420–24,337)* breaks down.
- If **24,337** is breached, expect declines to conservative target **23,620** and aggressive target **23,250**.
- If the index holds above the right shoulder (**25,100–25,200**), the uptrend can resume.
***
## Key Nifty Support and Resistance Levels
| Support (Major) | Support (Minor) | Resistance (Immediate) | Resistance (Major) | Description |
|---------------------|-------------------|------------------------|-----------------------|----------------------------------------|
| 24,420–24,337 | 24,300–24,200 | 24,700, 24,800 | 25,000–25,200 | Sell-on-rise strategy recommended if below 25,000
- **Stop-loss for Bulls:** 24,175 (daily close basis)
- **Continuation uptrend:** Only if sustained close above 25,100–25,200 (`right shoulder` zone).
***
## Sector Weightage in Nifty 50 (September 2025)
| Sector | % Share |
|--------------------|----------|
| Financial Services | 37.32% |
| Information Technology | ~11.2% |
| Energy (Oil/Gas) | ~10.5% |
| Automobiles | ~7.0% |
| Consumer Goods | ~6.5% |
| Telecom | ~4.8% |
| Healthcare | ~3.7% |
| Power | ~2.9% |
| Others (incl. Infra, Retail, Metal, FMCG) | Remaining ~16%
Financials are dominant, with IT and Energy also playing substantial roles in directional moves.
***
## Nifty Constituents Supporting Uptrend
Recent momentum (past week, EMA and price action) shows the following sectors and stocks providing relative strength:
### Leading Sectors for Upside (Next 45 Days)
- **Automobiles**: Auto sector led the recent rally, leading gains.
- **Private Banks**: Banking stocks showed green closes and were stable.
- **Consumer/FMCG**: Maintains strong price action; staple stocks act as defensive plays.
- **Selective Energy Stocks**: Some refineries and oil companies are holding support.
- **Shortlist of Uptrend-supporting Stocks** (selection):
- Maruti Suzuki, Mahindra & Mahindra, Tata Motors (Auto)
- ICICI Bank, HDFC Bank, Kotak Mahindra Bank (Private Financials)
- Hindustan Unilever, Nestle India (FMCG)
- Reliance Industries (Energy)
- Larsen & Toubro (Infra)
IT sector and some PSU banks are lagging or witnessing profit taking, not contributing to leadership for this uptrend window.
## Summary & Positioning
- **Target (downside):** If pattern confirms, expectation is a fall towards 23,620–23,250.
- **Support:** 24,420–24,337 (key), 24,200 (minor).
- **Resistance:** 24,700, 24,800, major at 25,000–25,200.
- **Stocks/sectors to watch for uptrend:** Auto, Private Banks, FMCG, select Energy and Infra stocks.
- **Sector weightages:** Financials lead, followed by IT and Energy. Stock selection should focus on leaders in high-weightage sectors.
The short-term trend is **cautiously bullish** if support holds, but any break below neckline risks a much deeper correction in Nifty 50
The key support and resistance levels for Nifty currently are:
- **Major Support:** 24,420–24,337
- **Minor Support:** 24,300–24,200
- **Immediate Resistance:** 24,700 and 24,800
- **Major Resistance:** 25,000–25,200
If Nifty remains above 24,337, uptrend continuation is possible; a sustained move above 25,000–25,200 would confirm renewed bullish momentum. If Nifty breaches below 24,337, expect further downside towards 23,620 as the next major support area.
***
## Current Nifty Support Levels
- **24,337 (critical neckline; below this, head and shoulders pattern triggers further selling)**
- **24,420 (first major floor)**
- **24,200 (minor intraday support zone)**
## Resistance Levels
- **24,700 and 24,800 (short-term ceiling)**
- **25,000–25,200 (right shoulder zone and main breakout threshold)**
**Trading near these zones suggests increased volatility. A close above 25,200 would invalidate the head and shoulder bearish setup; below 24,337 confirms downside risk for the index.

SEBI Expedites IPO Approvals: A Deep Dive into India’s Capital SEBI Expedites IPO Approvals: A Deep Dive into India’s Capital Market Shift
1. Introduction
The Securities and Exchange Board of India (SEBI) has recently undertaken a significant step—fast-tracking Initial Public Offering (IPO) approvals. Traditionally, IPO approval in India has been a lengthy process, often stretching to six months. But SEBI’s new measures aim to cut this time nearly in half, potentially bringing it down to three months or less.
This shift comes at a time when India’s equity markets are booming, with record levels of fundraising expected in 2025. After raising around $20.5 billion through IPOs in 2024, analysts predict that 2025 could surpass this figure. According to reports, $8.2 billion has already been raised so far in 2025, with an additional $13 billion in IPOs already approved and nearly ₹18.7 billion pending approval.
2. Why SEBI is Expediting IPO Approvals
Several factors are driving SEBI to accelerate the IPO pipeline:
Surging Investor Appetite
Indian retail participation in stock markets has seen an explosion in recent years.
Over 11 crore Demat accounts are active as of 2025, compared to just 3.6 crore in 2019.
More retail investors mean more demand for IPOs, making faster approvals essential.
Global Capital Flows
India is seen as one of the fastest-growing large economies.
With global investors diversifying away from China, India is attracting billions in Foreign Portfolio Investments (FPIs).
A streamlined IPO process will help India capture this liquidity flow before it moves elsewhere.
Boosting Startup Ecosystem
Unicorns like PhysicsWallah, Urban Company, and WeWork India are preparing for listings.
Startups require quicker capital-raising routes to compete globally.
Regulatory Efficiency and AI Adoption
SEBI is now deploying AI-powered document screening tools to check IPO filings.
This reduces human delays and allows faster compliance checks.
Collaboration with merchant bankers and exchanges has also been strengthened.
Record Fundraising Target
SEBI expects India to break the $20B mark again in 2025, possibly setting an all-time record.
Expedited approvals are central to making this happen.
3. How the New Approval System Works
Traditionally, IPO approvals involved multiple manual steps:
Filing of Draft Red Herring Prospectus (DRHP).
SEBI reviews disclosures, company financials, risk factors, and governance.
Queries are raised with the company, leading to back-and-forth communication.
Final approval takes 4–6 months.
Now under the fast-track mechanism:
AI Pre-Screening: Automated checks scan filings for missing data, compliance issues, and inconsistencies.
Concurrent Review: Instead of sequential reviews, SEBI, merchant bankers, and exchanges review documents simultaneously.
Time-Bound Queries: Companies are given strict deadlines to respond to SEBI’s queries.
Standardization: Risk disclosure formats and governance checks are now standardized across sectors.
This is expected to cut approval timelines by 40–50%.
4. IPO Pipeline for 2025
Some big-ticket IPOs in the pipeline include:
PhysicsWallah (₹3,820 crore) – Edtech unicorn expanding into AI-driven education.
Urban Company – Already raised ₹854 crore from anchor investors; IPO opening soon.
LG Electronics India – Large consumer electronics brand targeting India’s growing tech-savvy population.
WeWork India – Despite global challenges, the Indian arm remains profitable and expansion-focused.
Credila Financial Services – Education loan subsidiary of HDFC, a high-demand financial segment.
The SME IPO market is equally hot with listings like Goel Construction debuting at a 15% premium and Prozeal Green Energy getting SEBI approval.
5. Benefits of Faster IPO Approvals
For Companies
Quicker access to capital for expansion.
Ability to capitalize on favorable market sentiment without delays.
Reduced costs of prolonged regulatory processes.
For Investors
More frequent and diverse IPO opportunities.
Increased transparency due to standardized disclosures.
Higher liquidity as more firms enter the public market.
For Indian Markets
Strengthened image of India as an investment hub.
Alignment with global best practices (US SEC and Hong Kong’s IPO process are faster).
Improved global competitiveness for Indian startups.
6. Risks and Challenges
Speed vs. Quality
Faster approvals must not compromise on due diligence.
Weak companies slipping through could hurt investor trust.
Market Saturation
Too many IPOs in a short span could lead to oversupply, reducing listing gains.
Retail Investor Overexposure
Retail investors may flock to IPOs without understanding fundamentals, increasing risk of losses.
Global Volatility
Geopolitical tensions, US interest rate decisions, or oil price shocks can derail IPO plans.
7. Global Context
Globally, IPO markets have been mixed:
US Markets: Tech IPOs are recovering but still face valuation pressure.
China: Tighter regulations have slowed down IPO fundraising.
Middle East: Saudi Arabia and UAE continue to see large IPOs in energy and infrastructure.
In this scenario, India is positioning itself as a global IPO leader, especially in the tech and services sector.
8. Investor Strategy for 2025 IPOs
For investors, the IPO rush creates both opportunities and challenges. Some strategies include:
Focus on Fundamentals
Look for companies with strong financials, governance, and growth potential.
Avoid IPOs driven purely by hype.
Anchor Investor Signals
Strong anchor participation (like Urban Company’s ₹854 Cr funding) signals institutional confidence.
Sector Plays
Edtech, Renewable Energy, Fintech, and Consumer Services are hot sectors.
Traditional sectors like construction and manufacturing are also showing resilience.
Listing Gains vs. Long-Term Holding
Some IPOs (like Goel Construction SME) deliver quick listing pops.
Larger IPOs (like PhysicsWallah, Urban Company) may be better for long-term growth.
9. Case Study: Urban Company IPO
Urban Company is a prime example of SEBI’s faster approval ecosystem.
Filed DRHP earlier in 2025.
Received SEBI approval within 12 weeks.
Raised ₹854 crore from anchors before IPO launch.
Price band set at the higher end, reflecting strong demand.
Market analysts project strong long-term growth given India’s rising demand for home services.
This showcases how SEBI’s new process benefits both issuers and investors.
10. Conclusion
SEBI’s decision to expedite IPO approvals is a game-changer for India’s financial markets. By cutting approval times, using AI-driven compliance, and standardizing processes, SEBI is creating a faster, more transparent, and investor-friendly IPO environment.
With major companies like PhysicsWallah, Urban Company, Neilsoft, and Prozeal entering the market, and regulatory support from SEBI, 2025 is poised to be a record-breaking year for IPO fundraising in India.
However, investors must balance enthusiasm with caution—choosing fundamentally strong IPOs, monitoring global market conditions, and avoiding blind bets driven by hype.
In essence, SEBI’s move reflects India’s ambition to emerge as a global capital-raising hub, connecting domestic growth stories with global capital at unprecedented speed and scale.
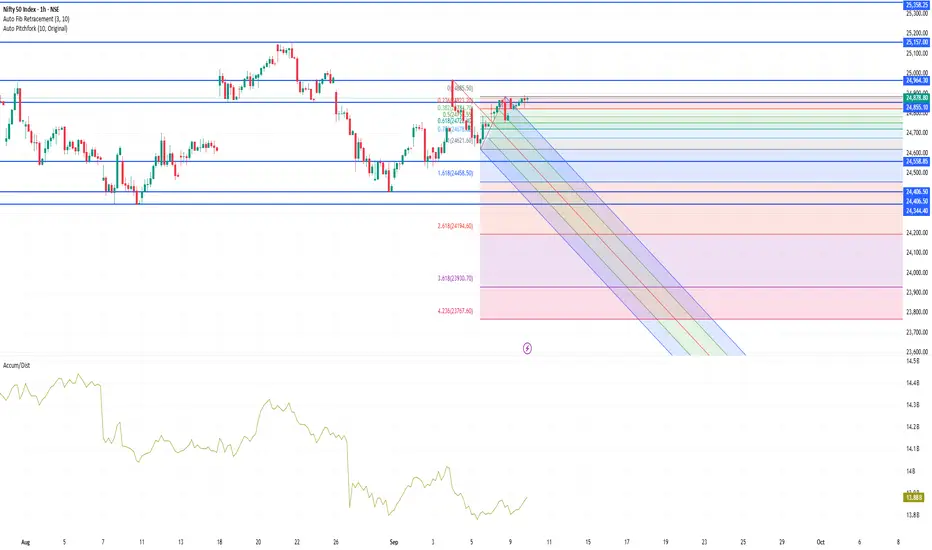
NIFTY50 index levelsKey Levels & Swing Trade Outlook (1-Hour Timeframe)
Resistance & Support (Broader Technical View)
Key Resistance Zones:
24,900–25,000 range (daily level)—a critical breakout area
Slightly higher potential if breakout occurs, toward 25,200+
Immediate Support Zones:
24,750–24,800 level
Broader range support at 24,620–24,700
More defensive base near 24,400 (longer-term)
Intraday Pivot Levels (Based on latest derived pivots)
From Moneycontrol, for the current trading session:
Classic Pivot R1: 24,855 | R2: 24,937 | R3: 24,989
Classic Pivot S1: 24,721 | S2: 24,669 | S3: 24,587
1-Hour Swing Trading Perspective
Although explicit 1-hour pivot data is not readily available, we can infer swing strategies using the broader technical context and typical indicators:
1-Hour Swing Fundamentals:
Use short-term moving averages (e.g., 20/50 EMA) to gauge trend direction. The index is trading above these on shorter timeframes, suggesting intraday bullish bias
Common indicators: RSI, Bollinger Bands, MACD, etc.
bharat forge ltd best time to buy stocks.everything and timing is good. you can buy. bharat forge stock.

Ye Chart Kuch Kehta Hai - Ramco Industries Limited (For Study)Based on the latest available fundamental and technical analysis, here is a rationale for considering a position in Ramco Industries Limited:
Fundamental Analysis
Ramco Industries has shown steady revenue growth, with a 10.5% YoY increase in Q1 FY2025-26 and a net profit growth of 28.3% in the same quarter, signaling improving operating performance and profitability.
The company’s trailing twelve months (TTM) financial ratios show a P/E of 28.55, P/B of 0.7, and P/S of 1.79, indicating that the stock may be reasonably valued with potential upside given its book value and sales metrics.
Ramco has a low debt-to-equity ratio (~0.03), indicating strong solvency and low financial risk, which supports financial stability and sustainable growth.
Recent quarters show positive trends in operating cash flow, reaching the highest in three years, suggesting good cash generation capacity.
The company is making consistent efforts to improve profitability and efficiency despite a moderate Return on Equity (ROE) around 2-4% range, indicating room for operational improvement.
Technical Analysis
The stock has been showing a positive trend with quarterly revenue and earnings growth supporting bullish momentum.
Recent trading activity shows strong volume spikes and price support near 310–345 INR levels, indicating good buyer interest at current valuation zones.
Momentum indicators and technical signals (such as MACD) reflect positive momentum and suggest a likelihood of continued upward movement in the near term.
Technical resistance levels have been tested, and breakout potential exists if these levels are decisively breached, providing a possible upside trigger.
Summary
Ramco Industries Limited presents a compelling case for investment based on solid fundamental performance improvements, positive cash flows, low leverage, and favorable technical indicators. While some fundamental metrics like ROE could improve, the company’s earnings growth and prudent financial management reduce downside risk. The stock’s current technical setup supports a potential upward price movement, making it an attractive position for investors seeking growth with moderate risk exposure.

WABAG Price ActionVA Tech Wabag Limited (WABAG) is trading at approximately ₹1,523 as of today, showing a slight positive movement with prices fluctuating between ₹1,502 and ₹1,527. The stock has a market capitalization nearing ₹9,477 crore and is positioned within a yearly price range of ₹1,109 to ₹1,944.
The company demonstrates robust financial health with an earnings per share of about ₹48.5 and a price-to-earnings ratio near 31.4, reflecting reasonable valuations considering its sector and growth potential. The stock price is closely aligned with its 50-day and 200-day moving averages, indicating a steady trend with balanced momentum.
Trading volumes are moderate with consistent investor interest, supported by continued investments in water infrastructure solutions and sustainable technologies. Overall, the outlook for WABAG remains positive, backed by its stable financials, solid project pipeline, and positioning in the growing water management sector.
