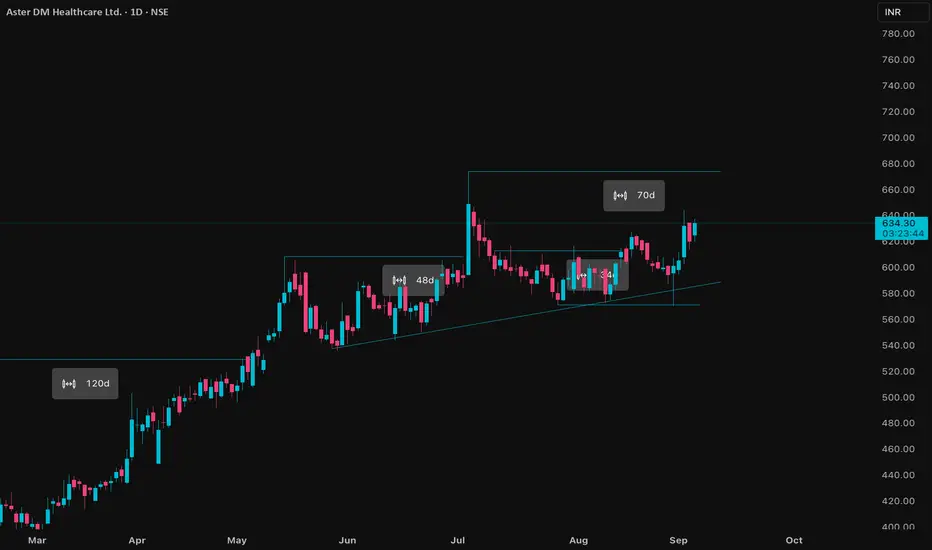
ASTERDM Price ActionAster DM Healthcare is trading around ₹632–₹634 as of September 4, 2025, and has shown solid resilience and upward movement over recent sessions. The company’s market capitalization stands at about ₹32,122 crore, and its current price-to-book ratio is roughly 9.4, reflecting growth expectations and sector strength.
Recent financial results highlight substantial improvement: Q1 FY26 revenue reached ₹1,078 crore, up 8% year-on-year, and consolidated net profit for the quarter is ₹85.52 crore, maintaining momentum following last year’s major gains from the strategic disposal of its Gulf business. The EBITDA margin for FY25 has strengthened, averaging 19.5%, due to increased patient volumes and operational efficiency. For the whole of FY25, revenue grew 12% to ₹4,138 crore, and net profit posted a strong jump to over ₹5,400 crore with strategic gains from the GCC business separation.
Balance sheet analysis shows rising book value and a stable asset base, indicating ongoing capital investment and sector expansion. Total expenses have grown moderately, while EBIT and PAT both reflect favorable YoY growth, with EBIT up 30% for the recent period. Trading volumes are steady, and the price action is currently above key moving averages, supporting a bullish technical outlook.
Aster DM Healthcare’s positive trend is backed by solid quarterly results, sector tailwinds, and strategic realignment of its international operations. Investors remain optimistic for further medium-term gains if the company sustains improved margins and expanding patient demographics.
Fundamental Analysis
Navin Fluorine: Supply Zone Breakout Sparks Rally🔍 Technical Analysis
Navin Fluorine Ltd has demonstrated an extraordinary long-term growth trajectory, showcasing a super bullish rally from below ₹100 levels to the current ₹5,000 zone - representing an exceptional 50x growth over the years.
The ₹4,700-₹5,000 zone has been acting as a formidable supply zone over the past year, creating multiple rejection points. However, the game-changing moment arrived with very strong positive Q1 FY26 results that provided the fundamental catalyst needed for a decisive breakout.
With this confirmation, the stock successfully broke above the supply zone and surged to ₹5,444 before pulling back to current levels of ₹4,843. The key now is whether the previous supply zone transforms into a demand zone with bullish candlestick pattern confirmations.
Entry Strategy: Enter on any dips toward ₹4,700-₹4,800 range, ensuring the old supply zone acts as new demand zone.
🎯 Targets:
Target 1: ₹5,500
Target 2: ₹6,000
Target 3: ₹6,500
🚫 Stop Losses:
Critical Support: ₹4,700-₹5,000 (previous supply zone, now key demand zone)
If stock doesn't sustain above this zone, no more expectations on this stock.
💰 Q1 FY26 Financial Highlights (vs Q4 FY25 & Q1 FY25)
Total Income: ₹725 Cr (↑ +3% QoQ from ₹701 Cr; ↑ +38% YoY from ₹524 Cr)
Total Expenses: ₹519 Cr (↓ -1% QoQ from ₹522 Cr; ↑ +23% YoY from ₹423 Cr)
Operating Profit: ₹207 Cr (↑ +16% QoQ from ₹179 Cr; ↑ +107% YoY from ₹100 Cr)
Profit Before Tax: ₹155 Cr (↑ +22% QoQ from ₹127 Cr; ↑ +128% YoY from ₹68 Cr)
Profit After Tax: ₹117 Cr (↑ +23% QoQ from ₹95 Cr; ↑ +129% YoY from ₹51 Cr)
Diluted EPS: ₹23.62 (↑ +23% QoQ from ₹19.15; ↑ +129% YoY from ₹10.32)
🧠 Fundamental Highlights
Navin Fluorine delivered spectacular Q1 FY26 performance with PAT soaring 129% YoY to ₹117 crore, driven by robust revenue growth of 38.5% to ₹725.40 crore. The company is recognized among the fastest-growing specialty chemical stocks with impressive financial metrics.
Market cap stands at ₹24,011 crore (up 42.1% in 1 year) with promoter holding at 27.1%. The stock is trading above all major moving averages (5-day, 20-day, 50-day, 100-day, 200-day), indicating robust upward trend momentum.
Financial strength is evident with 3-year average ROE of 16.7% and RoCE of 19.8%, while revenue grew at CAGR of 18.8% and net profit at 31.6% over the past three years. The company maintains healthy debt-to-equity ratio of 0.56.
The global fluorochemicals industry is expected to grow to $29.61 billion by 2027 at CAGR of 5.06%, driven by surging demand from semiconductors, batteries, and electronic components. Specialty chemicals segment is projected to grow at 12% CAGR between 2020-2025.
Stock has outperformed its sector and reached new 52-week highs, with consistent gains demonstrating strong investor confidence in the specialty chemicals leader's growth prospects.
✅ Conclusion
Navin Fluorine's exceptional 129% YoY PAT surge and successful breakout above ₹5,000 supply zone creates compelling technical and fundamental convergence. The 50x long-term growth story, combined with 42.1% annual market cap increase and industry-leading ROE of 16.7%, validates the breakout thesis. Current consolidation near ₹4,843 offers attractive entry for targeting ₹6,500 levels. Critical support at ₹4,700-₹5,000 zone must hold for sustained bullish trajectory in the specialty chemicals space.

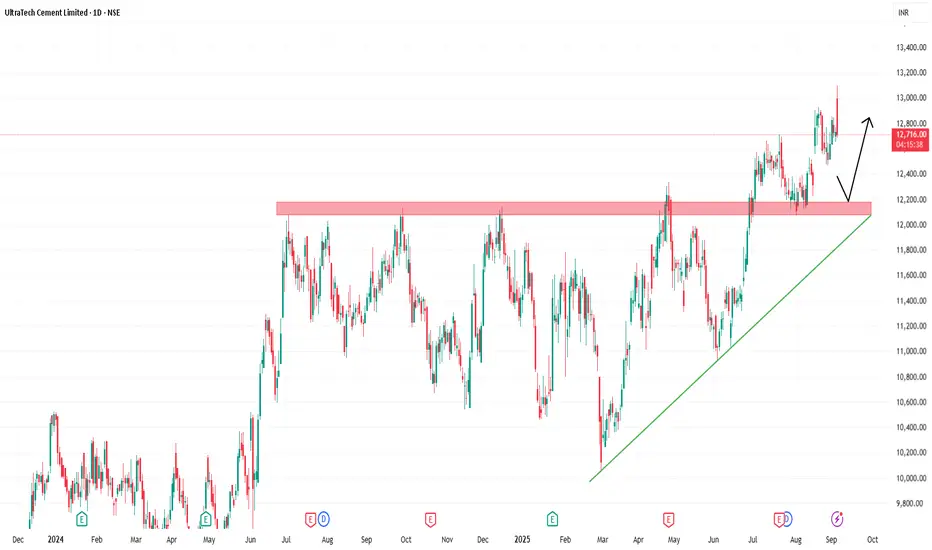
UltraTech: Two-Decade Bull Rally Reaches New Summit🔍 Technical Analysis
UltraTech Cement presents one of the most spectacular long-term growth stories in Indian equity markets. Having observed this stock for two decades, the journey from ₹250 levels to ₹12,000 represents a phenomenal 48x growth over 20 years - a testament to consistent value creation.
The ₹12,000 level acted as formidable resistance from July 2024 to July 2025, creating a year-long consolidation phase. This resistance was finally breached in July 2025, coinciding with confirmation of positive YoY quarterly results that provided the fundamental catalyst needed for the breakout.
Currently trading at ₹12,700, the stock has successfully broken above the psychological ₹12,000 barrier. This breakout, supported by strong fundamental performance, opens up the path for the next leg of the bull rally.
Entry Strategy: Enter on any dips toward ₹12,200-₹12,300 range, ensuring the ₹12,000 level holds as new support.
🎯 Targets:
Target 1: ₹13,000
Target 2: ₹13,500
Target 3: ₹14,000
🚫 Stop Losses:
Critical Support: ₹12,000 (previous resistance, now key support)
If the market doesn't sustain above ₹12,000 level, no more expectations on this stock.
💰 Q1 FY26 Financial Highlights (vs Q4 FY25 & Q1 FY25)
Total Income: ₹21,275 Cr (↓ -8% QoQ from ₹23,063 Cr; ↑ +13% YoY from ₹18,819 Cr)
Total Expenses: ₹16,869 Cr (↓ -9% QoQ from ₹18,456 Cr; ↑ +7% YoY from ₹15,801 Cr)
Operating Profit: ₹4,406 Cr (↓ -4% QoQ from ₹4,608 Cr; ↑ +46% YoY from ₹3,017 Cr)
Profit Before Tax: ₹3,008 Cr (↓ -3% QoQ from ₹3,101 Cr; ↑ +62% YoY from ₹1,857 Cr)
Profit After Tax: ₹2,221 Cr (↓ -10% QoQ from ₹2,475 Cr; ↑ +49% YoY from ₹1,493 Cr)
Diluted EPS: ₹75.54 (↓ -10% QoQ from ₹84.23; ↑ +46% YoY from ₹51.78)
🧠 Fundamental Highlights
UltraTech Cement delivered exceptional Q1 FY26 performance with consolidated net profit surging 49% YoY to ₹2,221 crore, driven by strong volume growth of 9.7% YoY to 36.83 million tonnes. Income rose 13% with EBITDA per MT increasing ₹337.
Market cap stands at ₹3,75,630 crore (up 11.1% in 1 year) with stable promoter holding at 59.2%. The company increased grey cement capacity by 3.5 MTPA in Q1 FY26, bringing total capacity to 192.26 MTPA.
UltraTech has allocated ₹10,000 crore capex for FY26 to bolster capacity and energy efficiency initiatives. Company achieved over 1 GW renewable power installations milestone and expects 7-8% sustainable volume growth.
UltraTech is on track to become world's top cement seller outside China with operational footprint of 34 integrated units, 30 grinding units, and 9 bulk terminals across India. In FY25 alone, the company added 42.6 MTPA capacity, accounting for 55% of the entire sector's expansion.
Strategic positioning includes targeting 209.3 MTPA output by FY27 and maintaining strong operational metrics with focus on sustainability through renewable energy integration.
✅ Conclusion
UltraTech's remarkable 20-year bull run from ₹250 to ₹12,700, combined with 49% YoY PAT growth and successful ₹12,000 resistance breakout, validates the long-term growth thesis. The 192.26 MTPA capacity milestone, ₹10,000 crore FY26 capex, and 1 GW renewable energy achievement position the company as industry leader. Technical breakout toward ₹14,000 appears feasible provided ₹12,000 support holds. Strong fundamentals justify premium valuation in cement sector leadership.
USD/CAD(20250905)Today's AnalysisMarket News:
① Waller: I believe we should cut interest rates at the next meeting. Multiple rate cuts are possible in the future, but the exact pace depends on the data.
② Musallem: Current interest rates are appropriate, but there are risks in the job market.
③ Bostic: Concerned about inflation, I still believe one rate cut this year is appropriate.
④ The Federal Reserve will hold a payments innovation conference on October 21st, which will discuss stablecoins, artificial intelligence, and tokenization.
⑤ Fed Governor nominee Milan: If confirmed, I will maintain the independence of the FOMC.
⑥ Kashkari: There is room for a modest rate cut.
⑦ The Federal Reserve Beige Book: Economic activity is roughly flat, with businesses and households feeling the impact of tariffs.
Technical Analysis:
Today's Buy/Sell Levels:
1.3791
Support and Resistance Levels:
1.3824
1.3812
1.3804
1.3778
1.3770
1.3757
Trading Strategy:
If the price breaks above 1.3804, consider entering a buy position, with the first target price at 1.3824.
If the price breaks below 1.3791, consider entering a sell position, with the first target price at 1.3778

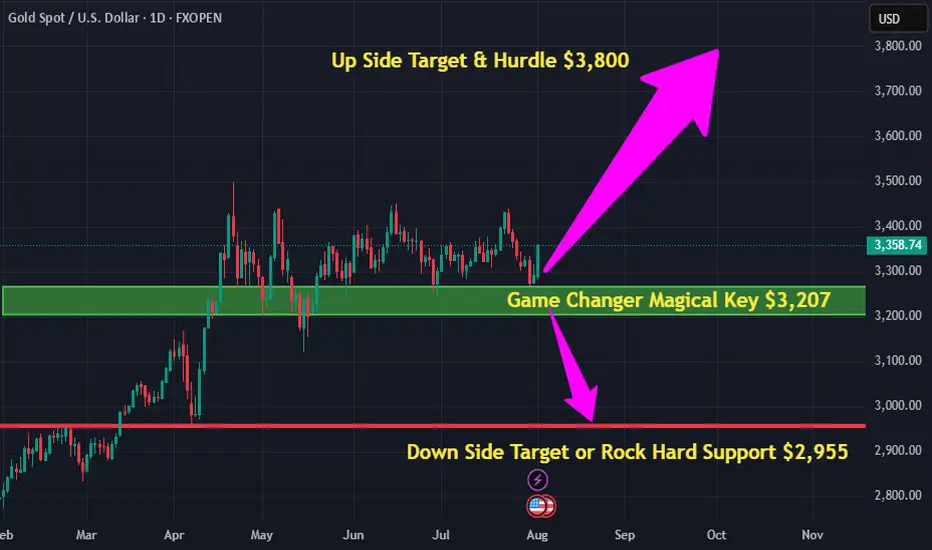
Gold Smashes Records: Trade the Fed Drama & Rate Cut Hype!Fundamental Analysis: Why Gold Keeps Breaking Records! 🌟
New Peaks: Spot gold hit a record $3,527.5/oz on September 2, with analysts predicting a climb to $3,600-$3,900 this year, potentially surpassing $4,000 by 2026 if economic and geopolitical uncertainty persists. Reuters polls show 2025 average price forecasts rising from $2,756/oz (January) to $3,220/oz (July). 📈
Fed Rate Cut Buzz: Fed Chair Jerome Powell acknowledged rising job market risks, boosting bets for a September rate cut. “A weakening USD, fueled by rate cut expectations, investor aversion to US assets, and tariff-related economic uncertainty, supports gold,” says Ricardo Evangelista from ActivTrades. Gold thrives in low-rate environments! 🏦
USD Weakness: The USD has lost nearly 11% since Trump’s return to the White House in January 2025, making gold more attractive to foreign currency holders. 📉
Fed Drama: Trump’s criticism of Powell and attempts to oust Fed Governor Lisa Cook have raised fears about Fed independence, driving safe-haven gold demand. “Speculative bullishness stems from potential Fed interference and concerns over the USD’s safe status,” notes Carsten Menke from Julius Baer. ⚖️🇺🇸
Other Drivers: Middle East tensions, Russia-Ukraine conflict, and central bank buying (e.g., China’s PBOC added gold for the 9th consecutive month in July 2025). The World Gold Council (WGC) reports central banks plan to increase gold reserves while reducing USD holdings. “Rising gold prices and central bank accumulation are boosting gold’s share in reserves,” says Michael Hsueh from Deutsche Bank. Gold ETFs like SPDR Gold Trust saw holdings rise 12% YTD to 977.68 tons, the highest since August 2022.
Technical Analysis: Bullish Surge Continues, Prioritize BUY but Watch for Pullbacks! 📉
Gold keeps setting new highs, breaking through the round 3,500 level, dipping briefly to 3,469, then surging to 3,54x—near the Fibonacci extension 0.618. No clear reversal signals yet, so prioritize BUY if gold retraces to 3,52x or 3,51x. Bulls remain in control!
Key Resistance: 3,554 - 3,564 - 3,574
Key Support: 3,521 - 3,508 - 3,450 - 3,475
Trading Opportunities:
Sell Scalp : 3,543 - 3,545
SL: 3,549
TP: 3,540 - 3,535 - 3,530
Sell Zone : 3,571 - 3,573
SL: 3,581
TP: 3,563 - 3,553 - 3,543 - 3,523
Buy Scalp: 3,510 - 3,508
SL: 3,504
TP: 3,513 - 3,518 - 3,528
Buy Zone: 3,475 - 3,473
SL: 3,465
TP: 3,483 - 3,493 - 3,503 - 3,513 - Open
#Gold #XAUUSD #Fed #Trump #TradingView #MarketUpdate #Forex #Investing #TechnicalAnalysis #GoldTrading #Finance #Crypto

India 10-Year Yields and Rupee – A Long-Term SetupThe Bond Yield Story
India’s 10-year government bond yield has been moving inside a long contracting triangle for more than 20 years.
The highs are getting lower.
The lows are getting higher.
Yields are now sitting near the middle, around 6.5%.
This triangle will not last forever. When it breaks, the move can be strong and last for years.
If yields break down: Bond prices go up, borrowing gets cheaper.
If yields break up: Borrowing costs rise, pressure builds on companies and the government.
The Rupee Story
The USD/INR chart shows a very clear uptrend since 2011 .
Every dip has made a higher low.
The line of support is still holding.
Today the rupee is near ₹88 per USD .
This means the rupee has been slowly losing value for many years.
Weak rupee: Imports (oil, gold, electronics) become costlier → inflation risk.
But: Exporters like IT and pharma get some advantage.
Fiscal Pressure
As per a Reuters update on TradingView’s news feed, the GST Council has approved tax cuts on many consumer goods starting September 22, 2025 .
This could boost consumption.
But it may also lead to a large revenue shortfall for the government.
Implication for markets:
Bond yields: More government borrowing could push yields higher.
Rupee: Fiscal stress may keep INR weak against USD.
(source : in.tradingview.com
)
Big Picture
Bond yields are stuck inside a long contracting triangle – a breakout is coming.
The rupee has been in a steady downtrend – the pressure is clear.
Fiscal moves like GST tax cuts add extra risk , tilting towards higher yields and weaker INR.
In short: The charts show yields coiling and rupee sliding . Fundamentals only add more weight to this setup.
Disclaimer: This analysis is for educational purposes only and does not constitute investment advice. Please do your own research (DYOR) before making any trading decisions.

Ola Electric Mobility Ltd.Ola Electric Mobility Ltd.
Price Information
52 Week High (18-Sep-2024) 123.90
52 Week Low (14-Jul-2025) 39.60
Upper Band 74.35
Lower Band 49.56
Price Band (%) 20
Daily Volatility 3.60
Annualised Volatility 68.78
Tick Size 0.01
Securities Information
Status Listed
Trading Status Active
Date of Listing 09-Aug-2024
Adjusted P/E NA
Symbol P/E NA
Index NIFTY MIDCAP 150
Basic Industry 2/3 Wheelers.

HDFC BULLISHAMD phase completed AND manipulation phase completed. its time for price distribution
1ST TARGET PRICE = 1013
2ND TARGET EXPECTING = 1130

Option Trading Bull Call Spread (Controlled Bullish Strategy)
Best for: Beginners expecting moderate rise in stock.
Market Outlook: Moderately bullish.
How it works:
Buy a lower strike call.
Sell a higher strike call.
Example:
Nifty at 22,000.
Buy 22,000 call at ₹150.
Sell 22,200 call at ₹80.
Net cost = ₹70.
If Nifty rises to 22,200, max profit = ₹130 (₹200 – ₹70).
Max loss = ₹70 (if Nifty stays below 22,000).
✅ Pros: Limited risk, limited reward.
❌ Cons: Not suitable if stock rises sharply.
Bear Put Spread (Controlled Bearish Strategy)
Best for: Beginners expecting moderate fall in stock.
Market Outlook: Moderately bearish.
How it works:
Buy a higher strike put.
Sell a lower strike put.
Example:
Nifty at 22,000.
Buy 22,000 put at ₹160.
Sell 21,800 put at ₹90.
Net cost = ₹70.
If Nifty falls to 21,800, max profit = ₹130.
Max loss = ₹70.
✅ Pros: Controlled loss, cheaper than naked put.
❌ Cons: Profit capped.

Zuari at supportZuari is the holding company of Mangalore Chemicals, which will soon be merged with Paradeep. As can be seen from the chart, it closed just above the support. Nevertheless, it continues to trade above key moving averages. This week's fall was on low volumes.
Given solid fundamentals of the underlying companies, Zuari holds good value. Expecting current support to hold and an up move thereafter, given the expectations of good 1 - 2 upcoming quarters.

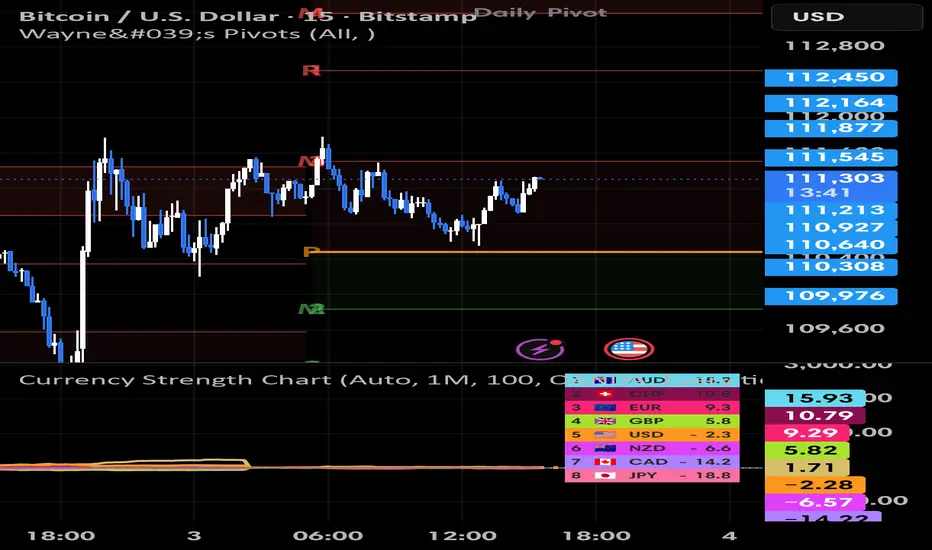
Bitcoin bullish breakout possible Bitcoin currently trading at 111250 and trying to test resistance at 111800 level If Bitcoin breaks resistance level then a target of 112450 can be achieved.Similarly if it goes down it can test 109700 level currently if dollar goes bearish today and tomorrow a bullish breakout possible.
Usdjpy in the crosshairUsdjpy currently trading at 148.692.It just made a new high now it's coming down.The question is will dollar strength prevail today like yesterday or we will se fed rate cut expectations pull the dollar down.Now if usdjpy closes below 148.450 level and give a pullback a downside potaimcial 147.750 can be expected.

Volume Profile & Market Structure AnalysisIntroduction
In modern financial markets, traders and investors rely on both price and volume to make informed decisions. While traditional technical analysis focuses heavily on price charts, patterns, and indicators, volume profile analysis introduces a powerful dimension: it shows not just where price has moved, but also where the most significant trading activity has occurred.
Markets are not simply a story of price fluctuations — they are a narrative of participation, commitment, and liquidity. By studying how much volume has traded at each price level, traders gain insights into which levels matter most to participants. This is where the volume profile becomes a key tool.
Coupled with market structure analysis — which identifies trends, ranges, supply-demand zones, and institutional footprints — traders can develop a deeper understanding of the underlying mechanics that drive market movement.
This guide explores the concepts of volume profile and market structure in detail, blending theory with practical application.
1. Understanding Volume in Trading
Volume represents the number of contracts, shares, or lots traded during a specific period.
High volume = Strong participation, more conviction.
Low volume = Weak participation, possible indecision.
Price movement alone can be deceptive. A rally with low volume may simply be speculative or driven by a few participants. Conversely, a rally with high volume suggests genuine market consensus and institutional interest.
Thus, when price is studied together with volume, we see where money is flowing in and out of the market.
2. What is Volume Profile?
Volume Profile is a charting tool that displays trading activity over a chosen time period at specified price levels. Unlike the typical volume indicator shown below price bars (which measures activity over time), volume profile shows how much volume was transacted at each price level.
It usually appears on the side of the chart as a histogram.
Key elements:
Point of Control (POC):
The price level with the highest traded volume. It’s often seen as the market’s “fair value.”
Value Area (VA):
The range where around 70% of trading activity occurred.
Value Area High (VAH): Top of the value range.
Value Area Low (VAL): Bottom of the value range.
High Volume Nodes (HVN):
Price zones where large amounts of trading took place — representing strong support/resistance.
Low Volume Nodes (LVN):
Price levels with little trading — often act as rejection zones where price moves quickly through.
In essence, volume profile reveals where participants are most interested in trading.
3. Why Volume Profile Matters
Identifies strong support/resistance: Prices with high volume tend to act as magnets.
Reveals institutional activity: Large players accumulate or distribute around high-volume zones.
Helps detect breakouts/fakeouts: If price moves away from a value area with volume, it’s often more sustainable.
Guides risk management: Stop-loss and target levels can be aligned with volume nodes.
For example, if the POC is at 15,000 in Nifty futures, traders know this is a strong pivot point. If price is above POC, bias is bullish; if below, bearish.
4. Building Blocks of Market Structure
While volume profile explains where participants are most active, market structure explains how the market moves.
Market structure refers to the repetitive patterns of price behavior, shaped by supply and demand imbalances.
a) Phases of Market Structure
Accumulation: Institutions build positions after a downtrend. Volume increases slowly.
Markup: Price trends upward, breaking resistance levels.
Distribution: Institutions unload holdings to late buyers at higher prices.
Markdown: Market declines as selling pressure outweighs demand.
b) Market Structure Basics
Higher Highs (HH) & Higher Lows (HL): Uptrend.
Lower Highs (LH) & Lower Lows (LL): Downtrend.
Equal Highs/Lows: Range or consolidation.
Traders map these swings to understand whether the market is bullish, bearish, or neutral.
5. Integrating Volume Profile with Market Structure
When combined, these two frameworks become powerful:
Trend confirmation: In an uptrend, high-volume nodes forming higher also confirm strong institutional support.
Range identification: A wide value area often signals consolidation.
Breakout validation: If price breaks above value area with high volume, chances of continuation are strong.
Liquidity hunts: Price may dip into low-volume nodes to trap traders before reversing.
Example: If Bank Nifty is making higher highs but each move is supported by rising POC levels, it confirms strength in the trend.
6. Practical Applications for Traders
a) Day Trading with Volume Profile
Identify intraday POC and VAH/VAL.
Trade rejections from value extremes (fade strategy).
Trade breakouts above VAH or below VAL with volume confirmation.
b) Swing Trading
Use weekly/monthly volume profiles.
Enter near HVNs (support zones) and exit near opposing HVNs.
Align swing trades with broader market structure (trend direction).
c) Position Trading
Focus on long-term volume profiles (quarterly/yearly).
Look for accumulation/distribution footprints of institutions.
Hold positions around POC shifts (where market’s fair value is migrating).
7. Volume Profile Strategies
Strategy 1: Value Area Rejection
If price moves above VAH but volume doesn’t confirm, expect a return back inside the value area.
Works best in range-bound markets.
Strategy 2: Value Area Breakout
If price breaks VAH/VAL with strong volume, trade in the breakout direction.
Works best in trending markets.
Strategy 3: POC Reversal
When price revisits the POC after a strong move, watch for reversal or continuation signals.
Strategy 4: Low-Volume Node Play
Price tends to move quickly across LVNs since there’s little resistance there.
8. Market Structure Strategies
Strategy 1: BOS (Break of Structure)
When price breaks a previous swing high in an uptrend → confirms continuation.
Strategy 2: CHoCH (Change of Character)
When price shifts from making HH/HL to LH/LL → signals reversal.
Strategy 3: Liquidity Grab
Market often sweeps previous highs/lows to trigger stop-losses before moving in the real direction.
Strategy 4: Supply/Demand Zones
Identify areas of sharp moves with high volume → strong institutional orders likely exist there.
9. Case Study Example (Nifty Futures)
Imagine Nifty is trading around 19,800.
Daily volume profile shows POC at 19,750.
VAH = 19,820, VAL = 19,700.
Scenario:
Price breaks above VAH with strong volume → continuation likely.
If it rejects above 19,820 and comes back inside → fade trade down to POC.
Market structure shows HH/HL → aligns with breakout trades.
Thus, both tools together offer context + execution clarity.
10. Psychological Edge of Volume Profile & Market Structure
Traders feel more confident when trades are backed by objective volume data rather than just subjective chart patterns.
Understanding market structure helps avoid emotional decisions by providing a map of price behavior.
Together, they reduce overtrading and improve patience by waiting for high-probability zones.
Conclusion
Volume Profile and Market Structure are two complementary tools that transform how traders view the market.
Volume Profile shows the hidden story of participation, liquidity, and fair value.
Market Structure provides the roadmap of how price evolves over time.
Together, they:
Identify high-probability trading zones.
Reveal institutional footprints.
Help traders avoid emotional decisions.
However, success lies not in the tools alone but in how consistently and patiently traders apply them with risk management. Over time, these methods can provide a decisive edge in understanding and navigating financial markets.
VINCOFE Price ActionAs of September 3, 2025, Vincofe Limited (Vintage Coffee and Beverages) is trading near ₹149, showing resilience and stable upward movement after reaching a 52-week high of ₹159.70 and bouncing from its yearly low of ₹75. The stock has delivered a 26% gain in the last month, though it has experienced weekly volatility averaging 5.3%, which is in line with industry norms.
Financially, Vincofe reported operating revenue of ₹308.52 crore for FY 2025, up 135% year-on-year, with profit after tax of ₹40.15 crore. Its EBITDA margin stands at 18.54%, reflecting efficient cost management, and net profit margin is significant for its sector. The company maintains a strong ROE at 17.28% and ROCE at 16.88%, demonstrating effective capital utilization. The price-to-earnings ratio (TTM) is 44.75, slightly below sector average, and the price-to-book ratio is high at 6.07, suggesting premium market expectations.
On the balance sheet side, Vincofe’s debt-to-equity ratio is 0.11, indicating low leverage and greater financial stability. Shareholding patterns show promoters hold 38.68%, with FII and DII gradually increasing their stakes—positive signals for institutional confidence.
Technically, the share is trading above its short- and long-term moving averages, retaining momentum; however, some consolidation and profit-taking are likely near resistance zones. The dividend yield is modest at 0.07%, as the company focuses capital on growth. Overall, Vincofe continues to demonstrate strong growth and solid fundamentals, supported by active investor interest and prudent financial management.

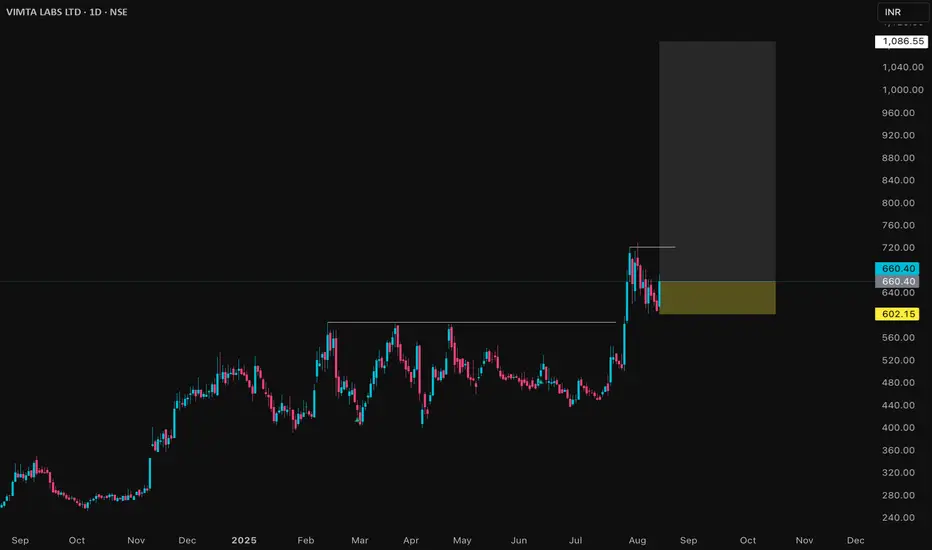
VIMTALABS Price Action## Vimta Labs Ltd – Price Analysis (August 2025)
### Price & Market Metrics
- Current share price is around ₹646–₹659 as of August 13, 2025.
- Market capitalization is approximately ₹2,900 crore.
- The 52-week price range is ₹241.30 (low) to ₹728.95 (high).
- The all-time high was ₹728.95 recorded in early August 2025.
- Recent price movement shows a strong rebound with gains around 6-7.5% over the past day.
### Returns & Volatility
- Over the last 1 year, the stock has surged by approximately 150-160%.
- The 6-month growth pace is about 14-16%.
- Weekly price moves have shown notable volatility, with recent declines around 7.5% in a short time frame.
- The stock exhibits moderate volatility consistent with strong recent price momentum.
### Valuation
- Price/Earnings (P/E) ratio is around 38.
- Price/Book (P/B) ratio is low, roughly 0.14 based on some sources, though others note around 3.6, indicating possible variation in book value interpretation.
- Dividend yield data is not prominent, indicating limited or no regular payout.
### Business & Fundamentals
- Vimta Labs is in the testing, inspection, and certification sector focused on quality control and laboratory testing services.
- The company benefits from growth in industrial and infrastructure sectors fueling demand for quality and compliance services.
- Recent market action indicates investor interest fueled by strong earnings growth expectations.
### Technical & Sentiment Overview
- The stock hit a fresh 52-week high recently but has shown some corrective pullbacks.
- Volume remains healthy reflecting active trading interest.
- The stock price is trading well above average levels, supported by positive market sentiment and sector tailwinds.
***
### Summary
Vimta Labs Ltd has exhibited a strong price rally in the past year with over 150% gains, reaching new highs in early August 2025. The current valuation by P/E stands elevated at about 38, reflecting growth optimism. The share price volatility is moderate but notable due to recent sharp moves. Market capitalization is close to ₹2,900 crore, with the stock trading near its peak levels. Investors should consider the premium valuation against ongoing growth prospects and sector dynamics, while monitoring for potential short-term price fluctuations or corrections.
Overall, Vimta Labs appears to be a growth-oriented stock with robust recent performance, but with valuation levels demanding careful risk assessment for new investors.
Godrej Consumer ProductsDate 03.09.2025
Godrej Consumer
Timeframe : Day Chart
Product Portfolio
(1) GoodKnight- Mosquito Repellent Brand
(2) Darling - Hair Extensions Business
(3) No. 1 - Soap Brand
(4) HIT - Pests killing products
(5) Cinthol - Premium personal care products
(6) Expert - Hair Color Brand
(7) Mitu - Babycare products
(8) Stella - Air freshener products
(9) MR magic - Liquid hand wash
(10) Aer -Air freshener products
Note* These top 10 brands contribute 70% of revenue
Geographical Wise Revenue Split
(1) India : 59.5%
(2) Africa, USA and Middle East : 25.5%
(3) Indonesia : 13%
(4) Latin America and SAARC : 2%
High Margin in Indian Markets
(1) Company earns 25-30% margins in India
(2) Company earns 10-15% margins in other geographies
Segmental Revenue Breakup
(1) Personal Care- 26%
(2) Home Care- 41%
(3) Hair care - 33%
Manufacturing Facilities
(1) India
(2) Africa
(3) Indonesia
(4) Latin America
(5) USA
Some Key Valuations
(1) Stock PE 68
(2) ROE 15%
(3) ROCE 19%
(4) OPM 20%
(5) Sales Growth 5%
(6) Profit Growth 8%
Regards,
Ankur

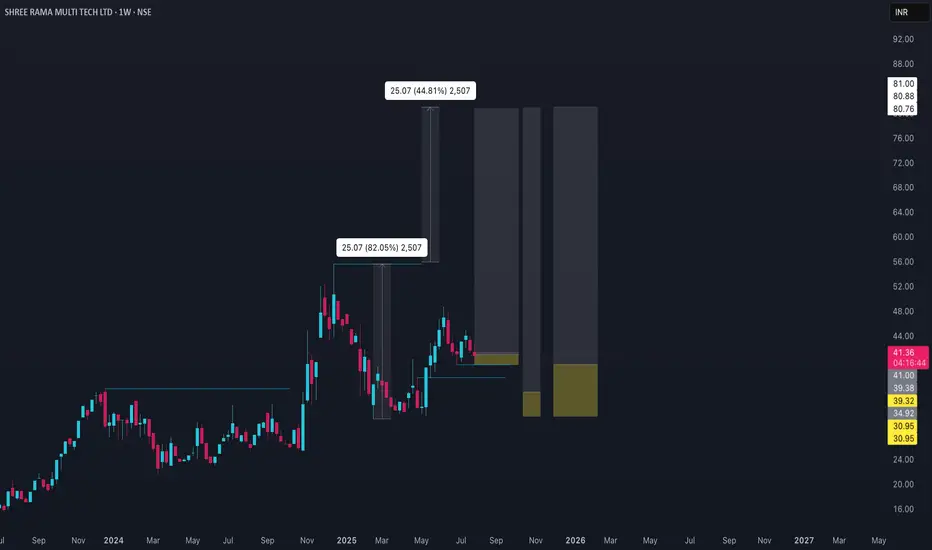
SHREERAMA Price ActionShree Rama Multi-Tech Ltd is currently trading around ₹41 as of late July to early August 2025. In the recent period, the stock has moved within a narrow range of ₹40.50–₹42.95, reflecting relatively low volatility. The short-term price trend appears positive, with upside targets ranging from ₹41.60 to ₹47.58 for the near-to-mid term. On the downside, support levels are seen near ₹40.06 and, more distantly, at ₹31.79 and below.
Fundamentally, the company has posted strong year-on-year sales growth, with March 2025 quarterly net sales up nearly 27% compared to the previous year. This operational momentum may be contributing to the positive sentiment around the stock, even as it consolidates near current levels. However, price targets over the next several months suggest modest gains rather than rapid appreciation, with resistance likely to emerge in the ₹44–₹48 range.
In summary, Shree Rama Multi-Tech Ltd offers a stable price trajectory with moderate upside potential. The outlook is supported by improved sales but tempered by significant resistance after the recent rally. The stock seems suitable for investors seeking gradual gains within the packaging sector, though the pace of growth may remain measured near term.
Liquidty is not so great yet, but stock is strong and trend is clearly up, now only thing is to find a right entry to catch our part of profit.
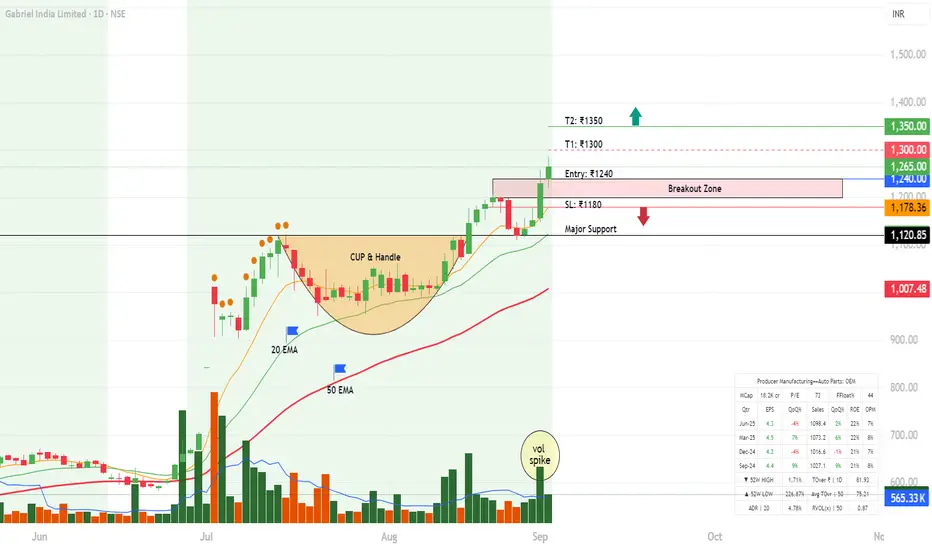
Gabriel India Ltd | Textbook Cup & Handle Breakout | Swing TradeGabriel India has formed a classic Cup & Handle pattern on the daily timeframe and given a decisive breakout above ₹1200 with strong volumes.
This indicates institutional accumulation and signals the start of a potential bullish leg.
Technical Analysis
Pattern: Cup & Handle → bullish continuation
Breakout Zone: ₹1200–1240 (now acting as strong support)
Current Price: ₹1265 (close as of 02 Sep 2025)
Volume: Noticeable spike, validating breakout strength
EMA Setup: Price trending above 20EMA (₹1178) & 50EMA (₹1123) → trend intact
Fundamental Key Area
Sector: Auto Ancillary (OEM supplier – suspension systems)
Market Cap: ~₹18,200 Cr (Mid-cap)
P/E: ~73 → premium valuation, market pricing in growth
Recent EPS: ₹4.3 (Jun-25) → steady growth
Sales Growth: +22% YoY (Jun-25) → consistent performance
Operating Margin: ~8% → stable margins for auto sector
Trade Plan
Entry Zone: ₹1240–1265 (CMP or on dips)
Stop-Loss: ₹1180 (below handle support & 20EMA)
Targets:-
T1: ₹1300 (Partial booking) (expected timeline 1-2 weeks)
T2: ₹1350 (Extended move) (expected timeline 2-3 weeks)
RR ≈ 1:1.8 → Favourable setup
Note: This analysis is shared purely for educational and informational purposes based on chart patterns and publicly available data. It should not be considered as investment advice. Please do your own research or consult a financial advisor before making trading decisions.
Garuda Construction – Cup & Handle Breakout | Swing Trade PlanGaruda Construction has given a textbook Cup & Handle breakout backed by strong volume and solid fundamentals.
Technical Analysis
A Cup & Handle pattern has formed with a neckline breakout above ₹200.
Stock closed strongly at ₹216.33 (+9.66%) with massive volume (7.5M vs 3.1M avg) - confirms institutional buying.
Price is trading above 20 EMA (₹200) and 50 EMA (₹188) → strong uptrend.
Weekly timeframe also shows a fresh breakout, adding higher timeframe confluence.
Structure remains bullish as long as it holds above ₹200 demand zone.
Fundamental key area
Construction & Engineering segment seeing strong order inflows, aiding medium-term growth. Strong QoQ Growth: Latest quarter (Jun-25) revenue jumped 55% to ₹125 Cr.
ROE ~29%, OPM ~29% → excellent efficiency.
Balance Sheet: Debt levels appear very low, improving stability.
Valuation: Mid-cap with growth momentum, attractive vs large-cap peers.
Swing Trade Plan
Entry Zone: ₹212–216
Stop Loss: ₹198 (below neckline + demand zone)
Targets:
T1: ₹225 (early booking)
T2: ₹240 (swing continuation)
T3: ₹260 (Cup & Handle measured move)
Risk–Reward: Up to 1:2.4
Note: This is an educational swing trade analysis based on price action + fundamentals. Not financial advice — do your own due diligence before trading.

Fundamentals Don’t Make You Rich Fast They Make You Rich ForeverHello Traders!
Most new investors want quick returns. They search for shortcuts, tips, and hot stocks to double their money overnight. But the reality is, wealth built on shortcuts usually disappears just as fast.
Fundamentals may feel boring because they don’t promise overnight success. But in the long run, they are the only reason you can create wealth that lasts. Let’s break this down.
1. Fundamentals Build Strong Foundations
A stock backed by consistent earnings, low debt, and strong management may not give you 50% returns in a week.
But over 5–10 years, such companies quietly multiply your money with stability.
2. Quick Gains Fade, Fundamental Gains Stay
A stock bought on hype can double quickly, but the same hype can collapse just as fast.
On the other hand, companies with strong fundamentals recover even after market crashes, because the business itself is valuable.
3. Time Works With Fundamentals
The longer you stay invested in a fundamentally strong company, the more compounding works in your favor.
Markets reward patience, fundamentals give you the confidence to hold.
Rahul’s Tip:
Don’t confuse speed with success.
The goal is not to get rich fast, but to stay rich forever. Fundamentals may be slow, but they are steady, and steady wins in wealth creation.
Conclusion:
Fast money comes and goes, but fundamental investing creates permanent wealth.
If you want to stop chasing quick profits and build a portfolio that lasts, start focusing on the strength of the business, not the speed of price moves.
If this post gave you clarity, like it, share your thoughts in the comments, and follow for more simple and practical investing wisdom!
SHAILY Price Action## SHAILY ENGINEERING PLASTICS – Price Analysis (August 2025)
### Price & Market Metrics
- Current share price: ₹1,853.70.
- Market capitalization: ₹8,078.9 crore.
- 52-week range: ₹871.10 (low) – ₹2,073.80 (high).
- All-time high: ₹2,073.80.
- Recent performance: Up 5.4% in the last week and 9% over the last month.
### Returns & Volatility
- 1-year return: Around 84%–92%.
- 3-year return: ~355%.
- Price shows notable daily volatility, sometimes over 5%.
### Financial Performance
- Quarterly revenue (Q1 FY2026): ₹2.49 billion, up 39% year-on-year.
- Quarterly net income: ₹411.2 million, up 136% year-on-year.
- EPS for the latest quarter: ₹8.95 (grew from ₹3.80 a year ago).
- Profit margin: 17%, higher than last year’s 9.7%.
- Annual revenue growth for FY2025: 21.34% (above 3-year average growth rate of ~10.9%).
- Return on Equity for FY2025: 14.29% (above 5-year average of 10.4%).
- Debt-to-equity ratio: ~0.47 (low leverage).
### Valuation
- P/E ratio: About 69 (well above sector levels).
- P/B ratio: About 14.7.
- P/S ratio: 9.44.
- Estimated intrinsic value: ₹364.95 per share — indicating it trades at a premium of over 380%.
### Business & Growth Notes
- Strong revenue and profit growth driven by higher volumes and better sales efficiency.
- Profitability well above sector average; ROE outperforming historical norms.
- Low debt levels; no pledged promoter holding.
- Dividend details not specified — focus appears to be on reinvestment.
### Summary
SHAILY ENGINEERING PLASTICS has delivered strong growth in sales and earnings with significant margin expansion and improved returns. However, the stock is priced at a very high valuation compared to intrinsic estimates and sector benchmarks. While short-term momentum is positive, the high premium suggests potential valuation risks if growth slows.

PCR Trading Strategy Options Strategies (Beginner to Advanced)
Options allow many strategies:
Beginner:
Buying Calls & Puts – Simple directional trades.
Intermediate:
Covered Call – Sell call against owned stock.
Protective Put – Buy put to protect long positions.
Advanced:
Straddle – Buy call + put (expect volatility).
Strangle – Similar, but with different strikes.
Iron Condor – Profits from sideways markets.
Butterfly Spread – Low-risk range-bound strategy.
Options in the Indian Market
Traded mainly on NSE (National Stock Exchange).
Popular instruments: Nifty, Bank Nifty, FinNifty, and top stocks.
Expiry cycles: Weekly (Thursday) and Monthly.
Lot sizes fixed by SEBI (e.g., Nifty lot = 25).
India is one of the world’s largest options markets today.

XAU/USD Magical Level for Trading: $400 Up or Down?XAU/USD (Gold) Magic Level for Trading: Can It Move $400 Up or Down till September 2025? - By Neal Bhai, India