Index Rebalancing Impact1. Why Index Rebalancing Happens
Indices are meant to represent a particular segment of the market. Over time, however:
Some companies grow while others shrink.
Market capitalizations change.
New leaders emerge in sectors.
Corporate actions (mergers, delistings, bankruptcies) occur.
Market liquidity and trading patterns evolve.
To maintain accuracy and credibility, index providers periodically evaluate components based on criteria such as:
Free-float market capitalization
Liquidity (trading volumes and turnover)
Sector representation
Corporate governance and regulatory compliance
Financial performance
Rebalancing ensures that the index remains aligned with the current structure and performance of the market.
2. How Rebalancing Works
The rebalancing process typically includes:
a. Announcement Phase
Index providers (NSE Indices, MSCI, FTSE Russell, S&P Dow Jones) release the final list of changes ahead of implementation, typically 2–4 weeks in advance. This gives institutional investors time to prepare.
b. Execution Day
On the official rebalancing date—often coinciding with the end of a quarter—index funds and ETFs must:
Buy stocks that are being added.
Sell stocks that are being removed.
Adjust weightings for stocks that remain but whose weight has changed.
This creates heightened trading activity, especially in the closing session (closing auction window).
c. Post-Rebalance Adjustment
Stocks may continue to adjust over the next few sessions as traders reposition and arbitrage strategies unwind.
3. Impact of Index Rebalancing
A. Price Impact on Stocks Being Added
When a stock is added to a major index:
Index funds buy the stock, leading to strong demand.
Prices often surge in the short term (known as the index inclusion effect).
Liquidity improves due to higher institutional participation.
Valuations may rise as more ETFs and passive funds accumulate holdings.
This effect is especially pronounced in indices with large passive following such as Nifty 50, S&P 500, or MSCI Emerging Markets.
However, this rise may be temporary—after the initial bounce, prices may stabilize or even decline as speculative traders exit.
B. Price Impact on Stocks Being Removed
Stocks removed from the index face:
Forced selling by index funds.
Immediate drop in price due to excess supply.
Reduced liquidity as passive funds exit.
Potential long-term decline in visibility and analyst coverage.
This is called the index deletion effect and can significantly hurt sentiment.
C. Impact on Index Levels
Rebalancing can change:
Sector weights (e.g., financials vs. IT)
Market-cap distribution
Risk and volatility characteristics
If high-weight stocks are added or removed, the impact on the overall index value can be sizeable.
D. Impact on Trading Volumes and Liquidity
Rebalancing typically results in:
Surge in trading volumes, especially in the last hour.
Increased delivery-based buying from funds.
Temporary widening of spreads due to volatility.
Short-term liquidity mismatches, particularly in mid-cap or small-cap rebalancing.
Index rebalancing days are often among the highest volume days of the year.
E. Impact on ETFs and Passive Funds
Passive funds must replicate the index exactly. Rebalancing forces:
High turnover in ETF portfolios.
Transaction costs, which may be passed on to investors.
Tracking error risks if markets are too volatile on rebalancing day.
This mechanical trading adds to price distortions.
F. Impact on Derivatives Markets
Index rebalancing impacts:
Nifty Futures and options due to hedging adjustments.
Volatility around expiry, especially if rebalancing coincides with derivatives expiry.
Straddle and strangle traders who position based on anticipated price swings.
Quant traders and arbitrage desks particularly exploit these windows.
G. Impact on Market Sentiment
Inclusion in a major index is often seen as:
A sign of strong fundamentals.
Higher institutional confidence.
Better corporate governance.
Removal, on the other hand:
Signals deterioration.
May reduce analyst and investor focus.
4. Who Benefits from Index Rebalancing?
i. Short-Term Traders
They profit from:
Price surges in stocks being added.
Price drops in stocks being removed.
Volatility spikes on execution day.
High-frequency traders (HFTs) and algorithmic funds dominate this space.
ii. Arbitrageurs
They exploit price inefficiencies created by:
Temporary demand-supply imbalance.
Tracking errors in ETFs.
Lag between announcement and execution.
iii. Corporates
Being added to an index increases visibility and prestige, potentially lowering cost of capital.
5. Risks and Challenges of Index Rebalancing
a. Excess Volatility
Prices swing sharply on announcement day and execution day, often unrelated to fundamentals.
b. Temporary Distortions
Stocks may become:
Overvalued after inclusion.
Undervalued after exclusion.
These distortions eventually normalize but create risk for traders.
c. Market Manipulation or Speculation
Some traders attempt to anticipate rebalancing outcomes, leading to front-running—buying in advance of the official announcement.
d. Overdependence on Indexing
As passive investing grows, mechanical buying/selling can destabilize markets during rebalances.
6. Global vs. Local Impacts
MSCI Rebalancing: impacts global flows in emerging markets including India.
Nifty/Sensex Rebalancing: impacts domestic flows.
Sectoral Index Rebalancing: affects specific industries.
Global indices often cause bigger price swings due to foreign fund flows.
Conclusion
Index rebalancing is a critical process in ensuring that stock market indices remain accurate and relevant. While it may seem purely technical, its impact is widespread—from stock price movements and liquidity changes to investor sentiment and fund flows. For traders, rebalancing events offer opportunities to capitalize on predictable demand patterns, but they also come with significant volatility-related risks. For long-term investors, while the day-to-day swings may not matter much, understanding how rebalancing works can help explain sudden price movements and shifts in market dynamics.
Overall, index rebalancing reinforces the efficiency and representativeness of financial markets, but it also introduces short-term inefficiencies that active participants can exploit.
Fundamental Analysis

BTC vs DXY – Critical Support Retest as Dollar StrengthensBitcoin is currently testing a key weekly support zone while the U.S. Dollar Index (DXY) continues to show strength. This is a classic inverse-correlation moment in the market.
🔹 BTC Analysis
Price has pulled back into a major support zone highlighted on the chart.
The ascending long-term trendline has also been touched.
This zone is a crucial decision area:
Hold → potential continuation toward 100k–120k
Break → deeper drop toward the red support zone below (70k–75k)
The market is reacting sharply here, indicating large-player interest.
🔹 DXY Analysis
The Dollar Index is showing renewed bullish momentum.
Price is moving up from its recent lows and pressing into a resistance/liquidity zone.
Historically, a rising dollar puts pressure on Bitcoin and risk assets.
🔹 Correlation Outlook
If DXY continues upward → BTC may struggle or retrace deeper.
If DXY gets rejected at resistance → BTC may bounce strongly from current support.
🔹 My Outlook
At the moment, BTC is at a make-or-break level.
I'm watching:
Support around the trendline
Reaction to the red zone below
DXY’s continuation or rejection at resistance
A confirmed bounce from here could send BTC toward new highs, but a break below this support would open the door for a larger correction.
Let the price action decide — this zone is where big moves begin.

Bitcoin is in a clean daily downtrend right nowBitcoin is in a clean daily downtrend right now – every bounce is just providing fuel for the next leg until the structure says otherwise.
Good evening traders, Brian here with a higher-timeframe look at BTCUSD.
Fundamental analysis
Bitcoin has been under sustained pressure even as some funds continue to accumulate spot positions. A few key points:
Macro uncertainty and tighter dollar liquidity are weighing on high-beta assets. While gold has held up relatively well, the performance gap between BTC and XAU has been widening in recent weeks, highlighting a clear risk-off tone towards crypto.
On-chain and fund flows suggest that a number of crypto investors are actually de-risking and pulling capital out, which reduces market depth and makes downside moves more violent when liquidity is thin.
Narrative is still mixed: long-term holders and some institutions are happy to buy lower, but in the short term the order flow is dominated by forced selling, deleveraging and risk reduction.
Bottom line: the macro backdrop does not yet justify an aggressive “buy the dip” approach on BTC. Trend-following shorts remain safer than trying to call the bottom.
Technical analysis
Daily structure is clearly bearish:
We have a confirmed market structure shift on the left of the chart, with the prior higher-low support broken and a series of decisive lower lows since then.
The main bullish trendline from earlier in the year has given way, and price is now travelling within a steep descending leg.
BTC recently tagged the 1.618 Fibonacci extension of the last major swing, aligning with a prior liquidity pocket. That produced a sharp intraday bounce, but so far it looks like a reaction inside a downtrend, not a full reversal.
Around 75.4k we have an important daily support zone. If this level is broken and accepted below, it opens the door to a deeper flush towards the next large support band lower on the chart.
Overhead, there is a clean imbalance/FVG and prior distribution area around 108k, with an intermediate resistance block around 96–97k and a nearer supply zone around 88k. These are prime locations to look for fresh shorts if price retraces.
For now my bias is simple: look to sell rallies into premium levels; any longs are tactical, short-term trades off key support only.
Key levels
Resistance / short zones:
88,000 – first reaction zone, “pay attention to the reaction”
96,500–97,200 – main short entry area for medium-term positions
108,000 – higher FVG / major daily supply
Support / long-only intraday zones:
75,400 – key support + 1.618 Fib/liquidity zone
74,000–72,000 – deeper support if 75.4k fails
Trade scenarios (for reference, not financial advice)
1. Short the first meaningful pullback – 88k area
Entry: 88,000
Stop: 90,000 (above local structure)
Targets: 82,000 → 78,000 → 75,500
Idea: treat 88k as the first supply zone in a downtrend. If price bounces from current levels and stalls here, I’m looking for rejection (wick rejections, failed break, or a clear shift in intraday structure) to join the trend. Once price moves in favour, I would look to pull the stop to breakeven and let the position run.
2. Core swing short – 96.5k–97.2k zone
Entry: 96,500–97,200
Stop: 99,000
Targets: 88,000 → 82,000 → 75,500
This is my preferred “medium-term” sell area. It aligns with a more significant daily supply block and offers better risk–reward if the larger bearish leg continues. Any squeeze into this region after a series of lower lows is, in my view, a controlled opportunity to reload shorts.
3. Tactical long only at deep support
Entry: 75,400–74,800
Stop: 73,800
Targets: 82,000 → 88,000
Here I would only consider a short-term long if we see a clean liquidity sweep into the 1.618 extension and strong rejection (long lower wicks, aggressive buy-back). The idea is simply to trade the bounce back into resistance, not to fight the higher-timeframe downtrend.
If BTC loses 75.4k and starts closing below it on the daily, I would become much more cautious on any long exposure and focus almost entirely on short setups towards the lower “important support” zone on the chart.
Trade with the trend, respect your risk, and don’t get trapped trying to be a hero at the bottom of a falling market.
If this BTC breakdown adds value to your plan, make sure you follow Brian for more daily BTC and gold analysis, and share your own view in the comments so we can compare scenarios.

BNB/USDT – Bullish Reversal Idea | Demand Zone Reaction📌 Overview
BNB is currently trading at a major higher-timeframe demand zone, showing early signs of accumulation after a sharp sell-off. Price has tapped the demand area multiple times and is holding without breaking structure to the downside.
This setup is based on a potential short-term reversal or a relief bounce.
📍 Analysis
🔹 Demand Zone
Price is reacting from a clean demand zone created by previous strong bullish displacement.
Multiple wicks show buyers defending this level.
🔹 Market Structure
Prior strong downtrend
Price now consolidating at support
Lower timeframe shows slowing bearish momentum
🔹 Entry Logic
A long entry is placed at the reaction zone, anticipating a bounce toward the nearest inefficiency / supply zone above.
🎯 Trade Setup
🟩 Long Position Idea
Entry: At demand zone
Stop-Loss: Below the liquidity wick / zone low
Take-Profit: Previous structure high or the first major supply zone above
This gives a clean R:R setup (as shown in chart).
⚠️ Risk Management
Only risk what you can afford to lose
If the zone breaks cleanly, setup is invalid
Wait for candle confirmation if you want safer entry
📌 Final Thoughts
BNB is at a critical make-or-break level. If buyers hold this zone, a strong bounce is likely. If not, expect continuation lower.
Publishing this to track market reaction and trade execution.

LiamTrading – XAUUSD H1 | Gold breaks bullish structure...LiamTrading – XAUUSD H1 | Gold breaks bullish structure, short-term downside takes control
Gold has dropped sharply by more than $20 in a short time, losing over 1% on the day and moving close to the lower 4,030 area. The previous bullish structure has officially been broken, 4040 failed to hold, and today’s focus continues to be selling with the trend until the 4000–398x support zone shows clear reactions.
Macro Analysis
Gold prices declined as expectations for a December rate cut weakened: JPMorgan no longer forecasts a Fed rate cut in December, opposite to their earlier 25 bps cut scenario.
Some institutions still believe rising unemployment and weaker economic data may force the Fed to cut 25 bps at the upcoming meeting.
The market is currently pricing the probability of a December rate cut at nearly “50–50,” creating strong uncertainty and putting short-term pressure on gold, even though the metal still benefits in the long term if the rate-cut cycle begins.
Technical Analysis H1 – Bearish structure, price channel, and support zones
After breaking below 4040, price formed a series of Lower Highs – Lower Lows, confirming a Dow-theory bearish structure on H1.
A falling channel is forming; the channel’s upper boundary aligns with the short-term resistance zone at 4050–4060.
4000 zone: a key psychological support. If broken decisively, the medium-term structure may shift into a deeper corrective phase.
Buy Zone 3987–3989
Strong support confluence + Fibonacci extensions (1.618/2.272) of the current bearish swing
Optimal area for catching a corrective bounce if clear reversal signals appear
Key Resistance Levels Today
4052–4054: retest of former support + upper boundary of falling channel → ideal area for a pullback-sell setup.
Trading Scenarios Today (LiamTrading)
Scenario 1 – SELL with the prevailing downtrend (priority)
Entry: 4052–4054
SL: 4060
TP: 4030 → 4015 → 3990
Logic: Price retraces to resistance + channel top, suitable for trend-continuation selling. Prefer setups where M15 shows rejection candles (pin bar/bearish engulfing) around 405x.
Scenario 2 – BUY at strong support 398x (counter-trend bounce)
Entry: 3987–3989
SL: 3980
TP: 3999 → 4014 → 4040 → 4080
Logic: 398x is a high-confluence support zone; trigger only when clear price reaction appears (long lower wicks or reversal patterns on M15–H1).
This is counter-trend, so use smaller position sizes and take partial profits.
Risk Notes & Invalidation
H1 closes above 4060: short-term bearish structure weakens → pause all sell setups and reassess.
H1 closes below 3980: buy zone fails → downside could extend further; only sell setups preferred.
Always keep risk per trade at 0.5–1%, and once reaching +1R, move SL to break-even.
Are you leaning towards continuing to sell with the trend, or waiting to buy the dip at 398x?
Follow LiamTrading on TradingView for daily XAUUSD updates

XAUUSD–FRIDAY BEFORE PMI: MAINTAINING HEAD AND SHOULDERS PATTERN💛 XAUUSD – FRIDAY BEFORE PMI: MAINTAINING HEAD AND SHOULDERS PATTERN, WAITING TO BREAK RANGE 4132–3998 🎯
🌤 1. Overview
Hello everyone, it's Lana here again 💬
Today is the last Friday of the week, the market is waiting for PMI and preparing to enter a phase with a lot of important data in December.
Meanwhile, BTC has been rising faster than XAU in recent weeks, indicating that speculative money is leaning towards crypto, while gold is temporarily moving sideways accumulating.
The US Department of Labor will release the November employment report on December 16, which is 6 days after the December Fed meeting. In other words, the Fed is in a "blackout" state regarding labor data for nearly another month – this forces the market to price in advance, making gold's volatility range wide but lacking a clear trend.
💹 2. Technical Analysis – Range & Head and Shoulders Pattern
On the H3/H4 frame, gold is fluctuating within the large range of 4132 – 3998.
The price wave is gradually narrowing towards the end of the triangle, represented by:
Lower highs,
Higher lows,
→ When one of the two boundaries is broken, a new trend is likely to explode in the direction of the breakout.
The inverse Head – Shoulders – Head pattern has not been broken:
Left shoulder – Head – Right shoulder are all above the rising trendline.
For the final wave of the pattern to follow the rhythm, the price needs to confirm surpassing 4109:
When closing a candle above 4109, the short-term uptrend is confirmed,
At that point, gold can aim for higher liquidity areas such as 4132 → 4145 → 4200.
Conversely, if gold breaks 3998, this will be both:
breaking the range bottom,
and negating the Head and Shoulders pattern,
→ opening the possibility of a deeper decline to the 3960–3920 area.
🎯 3. Reference Trading Scenarios
💖 BUY Scenario – following the pattern & range bottom support
1️⃣ Buy at support 3998–4000
Entry: 3998–4000
SL: below 3990 (depending on risk management)
TP: 4025 → 4040 → 4078
2️⃣ Buy when confirmed above 4109
Condition: Price closes a candle above 4109, confirming the Head and Shoulders pattern is maintained.
Entry: around 4100–4105
SL: 4090
TP: 4132 → 4145 → 4200
💢 SELL Scenario – trading the upper boundary of the range
Sell: 4130–4132
SL: 4138
TP: 4110 → 4095 → 4070 → 4045
Selling should only be considered as scalping against resistance within the range, not the main trend if the Head and Shoulders pattern is still valid.
⚠️ 4. Notes & Risk Management
Range 4132–3998 is still controlling the market:
Above 4109 → prioritize Buy according to the short-term uptrend.
Below 3998 → consider shifting bias to Sell following the breakout.
PMI, Fed expectations, and upcoming employment data may trigger unexpected volatility, therefore:
🌷Gold is at the intersection of technical patterns and macro stories 💛
Be patient and wait for reactions at 3998 and 4109, as these are the two key points that determine whether we enter a new upward wave or a deeper decline.
💛 Like – 💬 Comment – 🔔 Follow LanaM2 to follow gold with me every day ✨

Daily Macro, Market Mood Swings, & the Stories Behind the NoiseThe Stale Jobs Report Nobody Asked For
The much-delayed US September jobs report finally arrived yesterday —only to reveal that its insights are about as fresh as leftovers forgotten in the office fridge. Not only are the numbers too “stale” to be useful, but even if we pretend they’re not, the report still refuses to shed meaningful light on where the labor market actually stands. In short: lots of data, very little enlightenment, and definitely no peace treaty for the Federal Reserve’s ongoing internal policy debate.
Shutdown Fog and the Market Mood Swing
Adding to the confusion, the BLS has now said the November NFP print won’t drop until after the December FOMC meeting. Combine that with a government-shutdown haze apparently scheduled to lift sometime in 2026, and markets did what markets do best—panic elegantly. US equities went from hopeful green to tragic red faster than you can say “data dependency.”
Fed Officials: United in Caution, Divided in Direction
With just weeks until the Fed’s final meeting of the year, policymakers are broadcasting a delightful mix of caution, hesitation, and the occasional rate-cut cheerleading. Goolsbee, Hammack, and Cook are all expressing varying shades of “let’s not rush this,” while Waller is enthusiastically waving the December-cut flag. The collective mood reinforces Powell’s recent reminder that a December cut is “not a foregone conclusion,” and judging by the chatter, the “no” camp seems to be gaining momentum.
The Dollar Puts on Its Superhero Cape
Meanwhile, the US Dollar is out here having a fantastic week. Fuelled by fading expectations of a December Fed rate cut—and boosted by a surprisingly strong September NFP reading showing 119K new jobs—the Greenback marched to six-month highs. The DXY even broke past the 100 mark, flexing its muscles despite falling Treasury yields
A Data-Packed Day Ahead
If all that wasn’t enough, today’s global data calendar is busier than a central banker at a press conference. We’ve got PMI prints from the Eurozone, UK, and US; UK retail sales; ECB President Lagarde holding court; and a parade of Fed speakers including Williams, Barr, Jefferson, and Logan. Throw in the U-Michigan Consumer Sentiment Index, and you’ve got a full economic buffet—with plenty of opportunities for markets to overreact yet again.

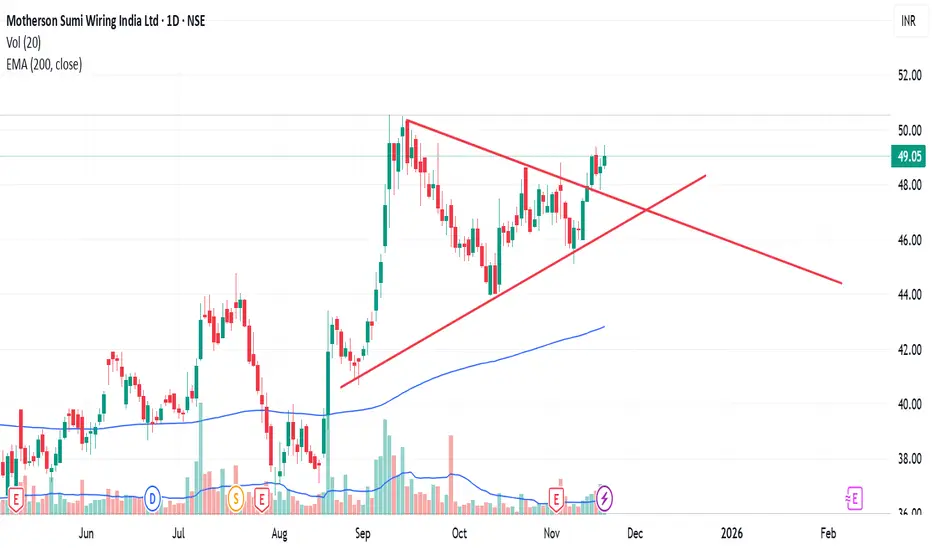
MSUMI Triangle BrekaoutMsumi recently brokeout of the symmetrical Triangle Pattern , while it has also tested the support again this is the start of new swing towards Upside.
PHOENIX LTDDISCLAIMER
it's just my technical view. I'M NOT A SEBI REGISTERED ANALYST. Before taking trade or Invest consult your financial advisor.
✅Here we provide TECHNICAL Levels and Charts.💯
✅This channel is for educational and self analysis purposes only!
Note :
DIGITAL TRADING FLOOR - Growing Online trading Community. We are providing market updates, recommendations and technical views are educational purposes only and it's taken from multiple sources that are not generated by our own. So before taking trading and investment kindly ensure your financial advisor.

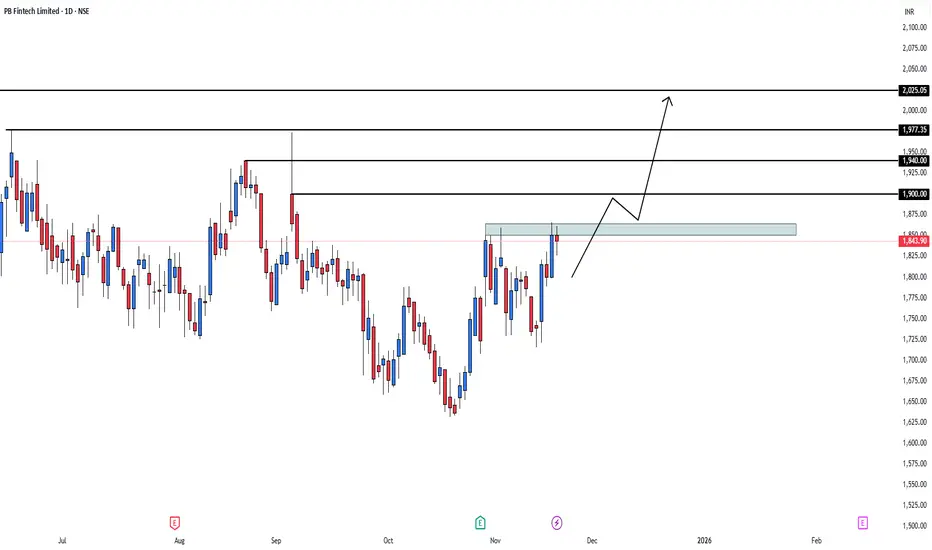
PB FINTECH DISCLAIMER
it's just my technical view. I'M NOT A SEBI REGISTERED ANALYST. Before taking trade or Invest consult your financial advisor.
✅Here we provide TECHNICAL Levels and Charts.💯
✅This channel is for educational and self analysis purposes only!
Note :
DIGITAL TRADING FLOOR - Growing Online trading Community. We are providing market updates, recommendations and technical views are educational purposes only and it's taken from multiple sources that are not generated by our own. So before taking trading and investment kindly ensure your financial advisor.
Part 1 Master Candle Stick Patterns Why Option Buyers Lose More Frequently
Option buyers lose mainly due to:
Time decay
Wrong direction
Lack of momentum
Low probability bets
Emotional trading
Most buyers attempt lottery-like trades in weekly expiries.
This is why professional traders prefer selling strategies.

Brian here with the gold outlook for November 20thGood morning everyone, Brian here with the gold outlook for November 20th. The ABC correction phase of gold is nearly complete, and the market is preparing to enter a new wave phase amidst a flurry of USD data today.
Fundamental Analysis
Today's focus remains on the US labor data: NFP (or revisions), Unemployment Rate, and Initial Jobless Claims.
If the data shows a cooling labor market, expectations for the Fed to soon pivot to a rate-cutting cycle will rise, weakening real yields, putting pressure on the USD, and supporting gold prices.
Conversely, "too good" data will strengthen the dollar, allowing for a short-term repricing move, potentially dragging gold down to lower liquidity zones before recovering.
US session liquidity may be thin before the news release, making it prone to spikes due to algorithms and large flows simultaneously adjusting positions.
Overall, the macro backdrop still favors "buying the dip" for gold, but you must accept strong volatility around news time.
Technical Analysis
On the chart, gold has completed an ABC corrective wave within a descending channel, part of a larger uptrend.
The current descending channel only serves as a corrective leg after the previous upward wave; prices are trading above the "mean" area of the bullish structure, indicating the larger market structure remains bullish.
Below is the liquidity zone / demand zone 4013–4015, coinciding with the previous low and the lower channel boundary – if there's another stop-hunt to this area, it is still considered an opportunity to join the upward move, as long as 4008 is not breached.
Above, the 4086–4100 cluster is the decision zone: breaking and holding above here will confirm exiting the corrective channel, triggering an impulsive leg towards resistances 4132–4146 and further to 4187.
In summary, the main bias remains bullish, prioritizing buy strategies at support zones or after breakout confirmation.
Key Price Levels
Resistance: 4086 – 4100 – 4110 – 4132 – 4146
Support: 4040 – 4030 – 4015
Trading Scenarios
Buy Scenario 1 – Continuation Breakout
Entry: 4086
SL: 4078
TP: 4100 – 4120 – 4140
Prioritize when price breaks up and retests 4086–4100 as a new support zone, confirming exit from the descending channel.
Buy Scenario 2 – Deep Liquidity Sweep
Entry: 4015–4013
SL: 4008
TP: 4030 – 4045 – 4070
Watch for strong price reactions at the demand zone, with pin bars or engulfing candles signaling order flow returning to buyers.
Sell Scenario – Sell Reaction at Strong Resistance
Entry: 4144–4146
SL: 4151
TP: 4132 – 4120 – 4100
Short-term sell strategy, leveraging the high supply zone if price rises straight up without sufficient accumulation.
The medium-term upside target if the bullish wave develops as expected remains the 4187 area.
What do you think of this scenario? Remember to follow Brian for daily gold insights and comment your views below to join the discussion.

LiamTrading – XAUUSD H1 | A bearish structure has formed...LiamTrading – XAUUSD H1 | A bearish structure has formed, waiting for confirmation during the European session
Overall, gold is in a corrective downtrend after the previous bullish move. On the H1 timeframe, a clear Dow bearish structure (lower highs, lower lows) has formed. However, the support zone around 4,030 and the lower Fibonacci cluster are still potential areas where buying pressure may appear. Today’s European session will be crucial to confirm whether price continues to drop deeper or bounces back, aligning with the inverse head-and-shoulders pattern developing on H4.
Macro – Short Fundamental Outlook
The minutes from the Fed’s October meeting revealed a strong internal division:
One group opposed rate cuts and wanted to maintain current levels.
The other group supported cutting rates and even suggested further reductions in December.
This lack of consensus shows high uncertainty in monetary policy, encouraging defensive flows to continue favouring gold. In the long run, gold only surges when confidence in the financial system weakens — a gold price peak is not a sign of prosperity but a warning signal.
Technical Analysis – H1 (trendline, Fibonacci, liquidity)
Price is trading below the short-term descending trendline, confirming that the bearish phase remains active.
The 4,082–4,090 zone is an important liquidity zone — repeatedly tested and now acting as near-term resistance.
The 4,029–4,031 cluster is a key support area:
Overlaps with technical support + Fibonacci retracement.
Beginning of the large FVG that extends down to 3,985 (Fibo 1.618 + psychological support).
Above current price, the 4,129–4,130 zone is strong resistance. If price breaks and holds above this area, the bearish Dow structure will weaken significantly.
Suggested Trading Scenarios
BUY Scenario – Buying at Support / Fibonacci
Logic: Price holds above the support–Fibonacci zone, showing bottom-fishing demand.
Entry BUY: 4,029–4,031
SL: 4,022
TP: 4,040 → 4,065 → 4,090 → 4,120
Only consider buying if price shows strong reaction at 4,029–4,031 (long wick rejection or clear reversal candle on M15–H1).
Cancel this BUY plan if H1 closes below 4,022.
SELL Scenario – Following the current bearish structure (preferred if trendline remains intact)
Logic: Price retraces to resistance + descending trendline and gets rejected.
Entry SELL: 4,098–4,100
SL: 4,105
TP: 4,088 → 4,070 → 4,035 → 4,000–3,985
Only sell if price touches 4,098–4,100 with clear rejection (bearish pin bar/engulfing).
If H1 closes above 4,105 and breaks the trendline strongly, stop all sell setups and reassess.
Key Levels for Scalping
4,082 – 4,060 – 3,985 – 4,129
These levels can be used for quick intraday trades, but reduce position size and take profit fast.
Important Notes
If price closes firmly above the descending trendline and holds above 4,090–4,100, bias will gradually shift toward BUY setups, as an inverse head-and-shoulders pattern is forming on H4.
If the 4,029–4,022 support breaks decisively, gold is likely to drop toward the FVG and Fibonacci 1.618 zone around 3,985.
What scenario are you leaning toward for gold today — a pullback for another sell, or holding the bottom for a rebound? Leave your view in the comments and follow LiamTrading for daily XAUUSD updates on TradingView.

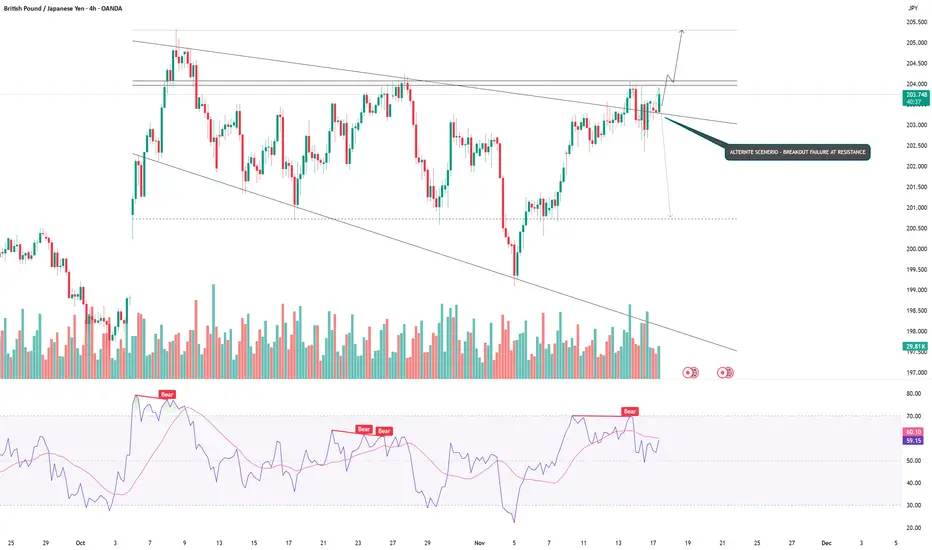
GBPJPY - BULLISH CONTINUATION OR REVERSAL?Symbol - GBPJPY
GBPJPY has broken the structure of the local downtrend amid persistent weakness in the Japanese yen. This shift opens the possibility for a continuation of the broader bullish trend.
The yen continues to depreciate, while the British pound maintains its upward trajectory. A breakout above local trend resistance is developing, reinforcing the overarching bullish market structure. The key support zone remains 203.50–203.26 Sustained consolidation above this zone would confirm buyer strength and could provide the foundation for further upside. If bulls successfully defend 203.50, an extension of the rally becomes increasingly likely.
Resistance levels: 204.06, 205.32
Support levels: 203.52, 203.26
A strong battle between buyers and sellers is unfolding around the 203.50 zone. Ongoing consolidation above 203.00 highlights the significance of this area. The current bias remains focused on the bulls, maintaining price action above 203.50 would support continued growth, while failure to hold this zone could lead to a corrective move back toward support for a retest.
XAUUSD – CLEAR INVERSE HEAD & SHOULDERS FORMATION, CONTINUE ...💛 XAUUSD – CLEAR INVERSE HEAD & SHOULDERS FORMATION, CONTINUE TO PRIORITISE BUY SETUPS 🎯
🌤 1. Overview – Today’s Market Picture
Hello everyone, Lana here again 💬
During the Asian session this morning, gold completed the right shoulder of a very clear Inverse Head & Shoulders pattern on the H3/H4 timeframe. Those who bought following the previous setup are now in a favourable position, and in my view, this is still a good time to hold Buy positions and prepare for additional entries once the market confirms the trend.
On the macro side, according to the CME FedWatch tool, the probability of the Fed cutting rates by 25bp in December has dropped to around 30–33%, while the likelihood of keeping rates unchanged remains dominant.
This means the USD is not weak enough to push gold sharply higher, but also not strong enough to suppress it—creating a volatile range-bound environment, which is ideal for technical-pattern trading.
💹 2. Technical Analysis – Inverse Head & Shoulders & Market Structure
The Inverse Head & Shoulders pattern has formed quite cleanly:
Left shoulder → Head → Right shoulder, all supported by the long-term ascending trendline.
The demand zone around 4040–4050 is acting as a liquidity box supporting the entire structure.
The neckline is currently around 4089–4090:
Once price breaks above and closes above 4089, we can consider a confirmed bullish trend.
After the breakout, gold may extend toward 4145 → 4200, which aligns with higher liquidity zones + upper FVGs.
Zone 4130–4132:
A major liquidity cluster—where many take-profit orders & short-term sell orders may appear.
If this zone is broken decisively, price may accelerate quickly toward 4200.
Zone 4040:
This is both the bottom of the pattern and a key support.
The bullish structure fails if gold closes below 4040 on H4, which would invalidate the Inverse H&S pattern.
Overall, price is currently compressing right below the neckline, and just one strong breakout could trigger the next bullish wave.
🎯 3. Reference Trading Plan (For Study Purposes Only)
💖 Primary BUY Scenario – Following the Pattern
1️⃣ Buy on retracement to support
Entry: 4060–4063
SL: 4055
TP: 4088 → 4108 → 4130 → 4143 → 4200
2️⃣ Buy the neckline breakout
Condition: Price breaks the descending trendline & neckline, and closes above 4089.
Entry: around 4089–4092
SL: 4080
TP: 4132 → 4145 → 4200
💢 Notes on SELL Setups
Selling now is counter-trend against the pattern and not the priority.
Consider only short-term sells if:
Price reacts strongly at 4132–4145, and
Clear bearish signals appear on M15–M30 (pin bar, bearish engulfing, rising sell volume).
⚠️ 4. Fundamental Factors to Watch
High probability that the Fed keeps rates unchanged → market may stay flat before data releases, then spike in volatility.
Gold remains sensitive to data: employment, inflation, and speeches from Fed officials.
🌷 In summary
The Inverse Head & Shoulders on XAUUSD supports the bullish scenario as long as price stays above 4040 💛
Strategy:
Prioritise Buy setups: first at 4060–4063, then on the breakout above 4089.
Watch the 4132–4145 zone closely—if broken, the move toward 4200 becomes highly probable.
If you found this analysis helpful, don’t forget to 💛 Like – 💬 Comment – 🔔 Follow LanaM2 for daily gold updates!

LONG EURUSDas i am looking for short covering, i am expecting to bounce from this levels
ENTRY - 1.14945
SL- 1.14845
TP- 1.15400

Premier Polyfilm Ltd – Inverted Hammer Reversal at Key SupportStrong Bullish Candle After Multi-Month Downtrend
Premier Polyfilm has printed a bullish Inverted Hammer at a major support zone after a prolonged decline — a classic early reversal signal on the weekly timeframe. The stock has been falling consistently for months, and this week’s sharp +12% bounce shows strong buying interest returning near the demand zone of ₹34–₹36.
Price is now closing above the minor resistance zone (₹40–₹43). If sustained, the stock may attempt a short-term trend reversal.
RSI also shows a bullish uptick from oversold territory, supporting the possibility of a relief rally.
🎯 Key Technical Levels
CMP: ₹43.00 (+12.33%)
Immediate Resistance: ₹49–₹52
Major Resistance Zone: ₹73–₹80
Support Zone: ₹34–₹36
Major Support: ₹30
Swing SL: Close below ₹35 (weekly basis)
📈 Technical View
A clean Inverted Hammer candle formed exactly at support → early reversal signal.
RSI bouncing sharply from oversold (14–20 range).
Price reclaiming the small demand zone around ₹40–₹43.
Trend is still down, but first signs of exhaustion are visible.
Sustaining above ₹43 could lead to a move toward the 20-week EMA and the ₹49–₹52 area.
🧠 View
Premier Polyfilm has shown its first strong bullish candle after several months of selling pressure. The combination of Inverted Hammer + support + RSI reversal makes this an early-stage reversal watch. A weekly close above ₹43 strengthens the case for upside toward ₹49–₹52, and potentially ₹70+ on a medium-term basis.

GOLD 4H | Bearish Retracement Into FVG • MSS → BOS 📌 Pair: XAUUSD (Gold)
⏱ Timeframe: 4H
📉 Bias: Bearish until premium FVG mitigation
The market created a clear MSS (Market Structure Shift) on the higher time frame.
Followed by multiple BOS confirming bearish continuation.
Price is currently trading below the major swing high → showing bearish orderflow.
Gold is showing a perfect ICT SMC bearish retracement after BOS + MSS.
Price is expected to continue lower as long as it stays below the FVG premium zone.
This idea is based on pure SMC + ICT concepts (BOS, MSS, FVG, BB, Premium/Discount zones).👉 Sky Eagle Trader
Get:
✔ Live XAUUSD analysis
✔ ICT + SMC concepts
✔ Entry, SL, TP updates
✔ Daily market outlook
✔ Professional charts & explanations

Daily Macro, Market Mood Swings, & the Stories Behind the NoiseNvidia: The Market’s Emergency Generator
Nvidia didn’t just beat expectations—it blew past them like a power surge through an already overloaded grid. The post-market 5% jump wasn’t enough to revisit October highs, but it was enough to jolt the entire AI complex back to life. More importantly, it single-handedly revived hopes of a December melt-up. When the biggest weight in the S&P 500 delivers, the whole market exhales.
Fed: The Decider-In-Chief
Whether this relief rally becomes a full Santa run now rests squarely with the Federal Reserve. Markets want a clean 25bp cut; futures, however, are quickly losing faith. The October minutes leaned hawkish, with officials openly mulling rates on hold through end-2025. Inflation is sticky, data is messy, and the FOMC is split between “trust the lagging indicators” and “avoid repeating the 1970s.” Cozy.
Dollar Dynamics & Data Fog
The dollar index climbed above 100.1—its highest in nearly two weeks—as traders dialed back December rate-cut expectations. Markets now assign only ~34% odds to a 25bps cut. The confusion deepened when the BLS confirmed the October jobs report won’t be published, since household data can’t be retro-collected. The missing report will be folded into November’s release, adding one more blindfold to the Fed’s labor-market assessment.
Global Moves: Yen Wobbles, JGBs Rebel, Europe Steadies
The dollar strengthened against the yen, pushing the Japanese currency to a 10-month low and prompting Finance Minister Katayama to announce that Tokyo is monitoring markets with “a high sense of urgency”—which is bureaucratic for “this is not fine.” Meanwhile, Japanese bond yields broke every rule in the stimulus textbook, with the 40-year hitting a record and the 30-year touching 3.334%.
In India, benchmark equities reversed early losses as foreign inflows and a bounce in IT helped restore calm.
Across Europe, the Eurozone headline CPI held steady at 2.1%, while UK CPI eased to 3.6%, matching expectations and giving central bankers one less thing to stress about.
Ahead Today: The Data Lineup
A busy U.S. docket awaits:
• September non-farm payrolls & unemployment
• October industrial production
• Initial jobless claims
• Existing home sales

LiamTrading – XAUUSD H1 | Gold Holds 0.618, Bullish Scenario...💛 LiamTrading – XAUUSD H1 | Gold Holds 0.618, Bullish Scenario Preferred for Wednesday 🎯
Gold continues to recover after the previous decline and is currently sitting right at the 0.618 Fibonacci level on the H1 timeframe — indicating buyers still have the upper hand. Price is also holding above the rising trendline and the thick Volume Profile area around 407x, so for today’s session, I continue to prioritise BUY setups in line with the trend.
📰 Macro – News Context
After the U.S. government reopened, the market is preparing for a series of economic data today and tomorrow → both USD and Gold may experience strong volatility.
President Trump attacked Fed Chair Powell, calling him “stupid and incompetent,” saying he once wanted to fire him immediately but was stopped by advisors.
👉 Because of this, market sentiment is very sensitive: if data leans towards a rate-cut scenario, Gold could gain additional support.
📊 Technical – H1 with Fibonacci, Trendline & Volume Profile
Fibonacci 0.618: Price is holding at the 0.618 level of the latest downswing; if this level holds, the natural target will be the upper FVG + resistance zone 4120–4150.
H1 Uptrend Line: The trendline from the recent low is supporting price very well; each retest generates a bullish reaction → an ideal area to wait for BUY entries.
Volume Profile & Liquidity:
The 4075–4080 zone is Buy Liquidity — thick volume, lots of order flow → suitable as an entry point if price retests.
VAL ~4040 and the Support + FVG area around 4020 are the next defence zones if the market sweeps deeper.
Upside liquidity:
Past H1 FVG remains unfilled up to at least 4150, so if the bullish scenario plays out, Gold can easily extend into this zone.
🎯 Trading Scenarios (LiamTrading)
1️⃣ Primary Setup – BUY with Trend
Entry: 4078–4080 (trendline retest + strong volume cluster)
SL: 4073
TP: 4094 → 4120 → 4140 → 4175
💡 Notes:
Wait for a clean M5–M15 bullish reaction (long lower wick, pin bar, or bullish engulfing) around 4078–4080 before entering.
Once price moves ~1R in profit, move SL to breakeven for account protection.
2️⃣ Short-term Scalping Zones
Support – quick buys: 4048–4023 (VAL + lower FVG zone).
Resistance – quick sells: 4121–4151 (FVG + upper liquidity zone).
These are only for scalping, so:
Enter on smaller timeframes (M5–M15).
Take profits quickly, avoid holding through major news.
✅ Summary
Short-term trend: Bullish bias as long as price holds above the H1 trendline and the 0.618 zone.
Main plan: Wait for BUY at 4078–4080, targeting 4120 → 4140 → 4175.
So, what do you think — will Gold push straight to 4150, or will it sweep down toward 404x first?
👉 Share your view in the comments & Follow LiamTrading to get daily XAUUSD plans on TradingView.

silver spot r mcx silver crucial update blw silver spot stya abv 52.45$ in mcx 159300 if sustain abv than nxt rally till 53--53.25$ in mcx 160260---161+++++ yesss some dwn correction may be expect 51.85$ near in mcx157800--158000 near---now let see chart structure or sustain or not!!!

