KESERPE - A Perfect Cup & Handle FormationThe chart shows Cup & Handle Formation & it's executed with high volume is a key note.
stock's current high is about 70 almost. right now trading at 32 rs.
balance sheet has been improved (YoY PROFIT GROWTH & EPS BOTH INCREASED ALMOST 3X).
i feels it can be multibagger.
you can check shareholdings. Fiis & diis are entered this quarter.
one of the ace public investor (Setu securities) entered before some quarters.
for me it's looking good & can give a epic Rally if sustains above Cup & handle.
check yourself before doing anything.
Fundamental Analysis

BTC Update 15th august BTC recovers the inefficiency left on10th July, bouncing on the support level at 111K and returning on the last target, in the red zone.
From a technical point, this is could be forecast following the empty zone, as the wick on July 14th, which underlines a POL (point of liquidity), also supported by the heatmap liquidation.
Fundamentally, this new sphere of positivity and institutional adoption is helping BTC's rally to conclude this cycle with the utter targets.
The grow in the past cycle is been sustained- less hyped than the previous two. Both due to the high currency price of the Big coin, which makes difficult have a high percentage changes in short time, and due the consistent consolidation of the VIX index. At the same time, the entrance of new institutional players, as side general traders, investors and big whales, has stabilized a bit the market in terms of entrance and exit, make it more forecastable and stable.
New targets in the next post.
Thanks for reading,
M

Gokul Agro Resources LtdDate 14.08.2025
Gokul Agro
Timeframe : Day Chart
About
(1) Company is in manufacturing and processing of various kinds of Edible, Non-Edible oils and meals
(2) Its edible oil portfolio includes brands like Vitalife, Mahek & Zaika. Vanaspati portfolio includes brands like Richfield & Puffpride
Business Segments
(1) Edible Oils & By-Products 90%
(2) Non-Edible Oils & By-Products 10%
Exports
(1) Exports contributed to ~7% of revenue over 36 countries
(2) France, Singapore, the USA, Germany, Japan, the Netherlands, Belgium, the UK, China, South Korea, and others
Clientele
(1) Parle Biscuits, ITC, Britannia, Sunraja Oil, Balaji Wafers, etc
(2) The top 5 clients contribute to 20-25% of the overall revenue
Distribution Network
The company has a network of over 700 dealers and distributors across 20 states
Valuations
(1)Market Cap = ₹ 4,492 Cr
(2) Stock P/E = 20.2
(3) Book Value = 5X
(4) ROCE = 34.5 %
(5) ROE = 26.5
(6) Sales growth is 17.0% of last 10 years
Shareholding Pattern
(1) Promoter = 73.67%
(2) FII = 1.44%
(3) DII = 0.01%
(4) Public = 24.87%
Regards,
Ankur

Breakout & Breakdown Strategies in Trading1. Introduction
Trading is not just about buying low and selling high—it’s about identifying when the market is ready to move decisively in a particular direction. Among the most powerful price action-based methods, Breakout and Breakdown strategies have earned their place as timeless tools in a trader’s arsenal.
Breakout: When the price pushes above a significant resistance level or price consolidation zone, signaling potential bullish momentum.
Breakdown: When the price falls below a significant support level or consolidation zone, signaling potential bearish momentum.
The reason these strategies are so popular is simple: when price escapes a strong level, it often triggers a wave of orders—both from new traders entering the market and from existing traders closing losing positions. This can create explosive moves.
2. Understanding Market Structure
Before diving into strategies, it’s important to understand how the market’s “architecture” works.
2.1 Support and Resistance
Support is a price level where buying interest tends to emerge, preventing the price from falling further.
Resistance is a price level where selling pressure tends to emerge, preventing the price from rising further.
A breakout happens when resistance is breached, and a breakdown occurs when support is breached.
2.2 Consolidation Zones
Markets often move sideways before a breakout or breakdown. These “tight” ranges reflect indecision. The tighter the range, the stronger the potential move after the breakout.
2.3 Market Participants
Understanding who’s involved can help:
Retail traders often chase moves.
Institutions accumulate positions quietly during consolidation.
Algorithmic traders may trigger breakouts with large volume spikes.
3. Market Psychology Behind Breakouts & Breakdowns
Price movements are not just numbers; they reflect human emotions—fear, greed, and uncertainty.
3.1 Breakouts
Traders waiting for confirmation jump in as soon as resistance breaks.
Short sellers may cover their positions (buy to exit), adding buying pressure.
Momentum traders and algorithms pile on, accelerating the move.
3.2 Breakdowns
Long holders panic and sell when support breaks.
Short sellers initiate fresh positions.
Stop-loss orders below support get triggered, adding to the downward momentum.
3.3 False Breakouts/Breakdowns
Not every breakout is genuine—sometimes price quickly returns inside the range. This is often due to:
Low volume breakouts.
Manipulative “stop-hunting” by large players.
News events reversing sentiment.
4. Types of Breakout & Breakdown Setups
4.1 Horizontal Level Breakouts
Price breaks a clearly defined horizontal resistance or support.
Works best when levels are tested multiple times before the break.
4.2 Trendline Breakouts
A downward sloping trendline break signals bullish potential.
An upward sloping trendline break signals bearish potential.
4.3 Chart Pattern Breakouts
Ascending Triangle → Breaks upward most often.
Descending Triangle → Breaks downward most often.
Flags/Pennants → Continuation patterns after a sharp move.
Head and Shoulders → Breakdown after neckline breach.
4.4 Range Breakouts
Price has been moving sideways; breaking the range signals a new directional trend.
4.5 Volatility Breakouts
Using Bollinger Bands or ATR to identify when volatility expansion may trigger breakouts.
5. Technical Tools for Breakout & Breakdown Trading
5.1 Volume Analysis
Genuine breakouts usually have above-average volume.
A price breakout without volume can be a trap.
5.2 Moving Averages
Breakouts above the 50-day or 200-day MA often attract attention.
Crossovers can confirm breakouts.
5.3 Bollinger Bands
Breakout beyond the upper band often signals bullish continuation.
Breakdown beyond the lower band often signals bearish continuation.
5.4 Average True Range (ATR)
Helps set stop-losses based on market volatility.
Breakouts with ATR expansion are more reliable.
5.5 RSI & Momentum Indicators
RSI crossing above 50 during a breakout supports bullishness.
Divergences can warn against false moves.
6. Step-by-Step Breakout Trading Strategy
Let’s break down a long breakout strategy:
Identify Key Level
Mark strong resistance levels or consolidation highs.
Wait for Price to Approach
Avoid preemptively entering; wait until price tests the level.
Check Volume Confirmation
Look for higher-than-average volume during the breakout candle.
Entry Trigger
Enter after a candle closes above resistance, not just a wick.
Stop-Loss Placement
Place SL below the breakout candle’s low or below the last swing low.
Profit Targets
First target: Equal to range height.
Second target: Use trailing stop to capture more upside.
7. Step-by-Step Breakdown Trading Strategy
For a short breakdown strategy:
Identify Strong Support
Multiple touches strengthen the level.
Observe Price Action
Watch for compression near support.
Volume Confirmation
High volume on breakdown increases reliability.
Entry
Enter after candle closes below support.
Stop-Loss
Above the breakdown candle high or last swing high.
Profit Targets
First: Range height projection.
Second: Trail stop for extended moves.
8. Risk Management
Breakout and breakdown trading is high-reward but also high-risk without proper risk controls.
8.1 Position Sizing
Risk only 1–2% of capital per trade.
8.2 Avoid Overtrading
Not every breakout is worth trading—quality over quantity.
8.3 Stop-Loss Discipline
Never widen stops once placed.
8.4 Recognizing False Breakouts
No volume surge.
Price rejection at the breakout point.
Sudden reversal candles (shooting star, hammer).
9. Advanced Tips for Success
9.1 Multi-Timeframe Analysis
Confirm breakouts on higher timeframes for reliability.
9.2 Retest Entries
Instead of chasing the breakout, wait for price to retest the broken level and bounce.
9.3 Combine With Indicators
MACD crossovers, RSI breakouts, or Ichimoku Cloud confirmations can filter false signals.
9.4 Avoid News-Driven Breakouts
These are often short-lived spikes unless supported by strong fundamentals.
10. Real-World Example
Breakout Example
Stock consolidates between ₹950–₹1000 for weeks.
Volume surges as it closes at ₹1015.
Entry at ₹1015, SL at ₹990.
Price rallies to ₹1080 within days.
Breakdown Example
Nifty support at 19,800 tested thrice.
Price closes at 19,750 with high volume.
Short entry at 19,750, SL at 19,880.
Price drops to 19,500.
11. Pros and Cons
Pros:
Captures explosive moves early.
Works in all markets (stocks, forex, crypto).
High reward-to-risk potential.
Cons:
False breakouts can be frustrating.
Requires discipline to wait for confirmation.
Volatility can trigger stop-losses before the real move.
12. Summary Table: Breakout vs Breakdown
Feature Breakout (Long) Breakdown (Short)
Key Level Resistance Support
Volume Signal High volume on upward candle High volume on downward candle
Stop-Loss Below breakout candle low Above breakdown candle high
Target Range height or trend ride Range height or trend ride
13. Final Thoughts
Breakout and breakdown strategies work because they align with the natural order flow of the market—when key levels are breached, they often trigger a flood of buying or selling activity. However, success depends heavily on patience, confirmation, and risk management.
A trader who learns to differentiate between a true breakout and a false move has a powerful edge. By combining technical levels, volume analysis, and disciplined execution, breakout/breakdown trading can become a cornerstone strategy in any trading plan.
Building a Consistent Trading PlanIntroduction
Trading without a plan is like sailing without a compass — you may catch some winds, but without direction, you’ll eventually drift into trouble. A consistent trading plan is the blueprint that guides your decision-making, helps control your emotions, and allows you to measure performance objectively. It’s the difference between gambling and structured, calculated trading.
In this guide, we’ll explore how to build a complete trading plan from scratch, the core components every trader must include, the psychological discipline needed, and real-world implementation steps to maintain consistency.
1. Why a Trading Plan Matters
Before we start building, let’s understand the why.
Removes Emotional Decision-Making
Without a plan, traders tend to react impulsively to market moves, buying out of greed or selling out of fear. A trading plan gives a predefined set of rules, reducing emotional bias.
Creates Measurable Consistency
Consistency is key in trading. A trading plan ensures that every trade is based on the same logic, making it easier to identify strengths and weaknesses in your approach.
Improves Risk Management
It forces you to define how much you’re willing to lose per trade and per day/week/month, helping to protect your capital.
Enables Continuous Improvement
When you follow a documented plan, you can review your trades, find patterns in mistakes, and improve over time.
2. Foundations of a Trading Plan
A good trading plan rests on four pillars:
Clear goals – Defining what you want to achieve and in what timeframe.
Trading strategy – How you find, enter, and exit trades.
Risk management – Protecting capital and managing exposure.
Psychological discipline – Staying consistent under stress.
Step 1: Define Your Trading Goals
Your goals need to be Specific, Measurable, Achievable, Relevant, and Time-bound (SMART).
Example:
Earn 3% per month on average.
Limit monthly drawdown to 5%.
Execute no more than 20 trades per month.
Review performance weekly.
Long-term vs. Short-term goals:
Short-term: Develop discipline, avoid overtrading, stick to stop-loss rules.
Long-term: Build a track record, scale position sizes, move toward full-time trading.
Step 2: Choose Your Trading Style
Different trading styles require different plans. Choose the one that matches your time availability, personality, and capital.
Trading Style Holding Time Time Commitment Risk Profile Example Assets
Scalping Seconds–Minutes High High Forex, Index Futures
Day Trading Minutes–Hours High High Stocks, Commodities
Swing Trading Days–Weeks Medium Medium Equities, ETFs
Position Trading Weeks–Months Low Low Stocks, Bonds
Step 3: Select Your Market & Instruments
A trading plan should specify exactly what markets you trade to avoid distraction.
Example:
Markets: Nifty50, Bank Nifty, Gold, EUR/USD
Instruments: Futures, Options, Spot Market
Avoid spreading yourself too thin — mastering one market is more profitable than dabbling in many.
3. Core Components of a Trading Plan
Let’s break down exactly what to include in your plan.
A. Entry Criteria
Clearly define the conditions that must be met before you enter a trade.
Example (Technical-based Entry):
Price must be above the 50 EMA for long trades.
Entry trigger: Breakout of last swing high with above-average volume.
Confirmation: RSI above 50 but below overbought.
Example (Fundamental-based Entry):
Quarterly earnings growth > 20%.
Stock in strong sector outperforming the market.
Institutional buying trend confirmed.
Tip: Avoid vague signals like “when I feel it’s right” — your rules should be objective and back-testable.
B. Exit Criteria
Exits are more important than entries for profitability.
Two types of exits:
Stop Loss Exit – A predefined loss limit per trade.
Target Profit Exit – A predefined profit goal, or trailing stop for trend-following.
Example:
Stop Loss: 1.5% below entry.
Target: 3% above entry (2:1 reward-to-risk ratio).
Trailing Stop: Move stop to breakeven after 1% gain.
C. Risk Management Rules
Without risk control, even the best strategy will fail.
Key Rules:
Risk per trade: 1–2% of capital.
Max daily loss: 4% of capital.
Max open positions: 3 at a time.
Position sizing formula:
Position Size = (Account Size × Risk %) / Stop Loss (in price terms)
Example:
Account Size = ₹5,00,000
Risk per trade = 1% = ₹5,000
Stop loss distance = ₹10
Position size = 500 shares.
D. Money Management
Money management focuses on how profits are reinvested and how losses are recovered.
Approaches:
Fixed Fractional: Risk a fixed percentage of current equity.
Kelly Criterion: Optimize bet size based on historical win rate and payoff ratio.
Scaling In/Out: Increase size in winning trades, reduce exposure in losing trades.
E. Trade Management
Trade management deals with what you do after entering a trade.
Do you let profits run or take partial profits?
Do you move your stop loss after a certain gain?
Do you hedge positions?
A strong trading plan has exact decision points for trade management.
F. Trading Journal
A trading journal is non-negotiable. It records:
Date & time
Market & instrument
Entry & exit price
Stop loss & target
Trade rationale
Result (profit/loss)
Emotional state
Why it’s important: Reviewing past trades exposes patterns of mistakes and successes.
4. Psychological Discipline in Trading
A trading plan is useless if you don’t follow it.
Key Mental Challenges:
Fear of Missing Out (FOMO) – Chasing moves without confirmation.
Revenge Trading – Trying to recover losses quickly.
Overtrading – Taking too many trades without quality setups.
Loss Aversion – Cutting winners too early and letting losers run.
Solutions:
Pre-market checklist.
Daily routine.
Accountability partner or trading community.
Meditation or breathing exercises to reset focus.
5. Backtesting and Forward Testing
Before trading live, your plan must be tested.
Backtesting:
Test your strategy on at least 1–2 years of historical data.
Track win rate, average profit/loss, drawdowns.
Forward Testing (Paper Trading):
Execute trades in a simulated account.
Evaluate performance under current market conditions.
6. Building Your Trading Routine
Consistency comes from habits.
Pre-Market Routine:
Review overnight news.
Identify key support/resistance levels.
Prepare watchlist.
Plan possible entry/exit levels.
During Market Hours:
Follow plan strictly.
Avoid unplanned trades.
Post-Market Routine:
Review trades.
Update journal.
Analyze mistakes.
7. Continuous Improvement
The market evolves — so should your plan.
Monthly Review Checklist:
What rules did I break?
Which setups worked best?
Is my win rate improving?
Is my risk/reward ratio holding?
Quarterly Updates:
Adjust stop loss levels.
Modify position sizing.
Test new indicators or filters.
8. Common Mistakes to Avoid
Trading multiple strategies without mastery.
Ignoring risk rules after a streak of wins.
Changing strategies too often.
Not accounting for transaction costs and slippage.
9. Example of a Simple Trading Plan
Trading Style: Swing Trading
Market: Nifty50 stocks
Strategy: 50 EMA trend-follow with RSI confirmation
Entry Rules:
Price above 50 EMA.
RSI between 50–70.
Breakout of last 10-day high with volume spike.
Exit Rules:
Stop Loss: 2% below entry.
Target: 4% above entry or trailing stop.
Risk Management:
Risk per trade: 1% of account.
Max open positions: 4.
Routine:
Pre-market: Scan for setups.
Post-market: Journal trades, review performance.
Conclusion
A consistent trading plan is not a guarantee of profits — but it guarantees discipline, risk control, and structured decision-making, which are the foundations for profitability. The best traders are not those who predict the market perfectly, but those who manage their trades systematically over years.
Your plan should be written down, tested, followed, and reviewed regularly. The market will keep changing, but your disciplined approach will keep you in the game.

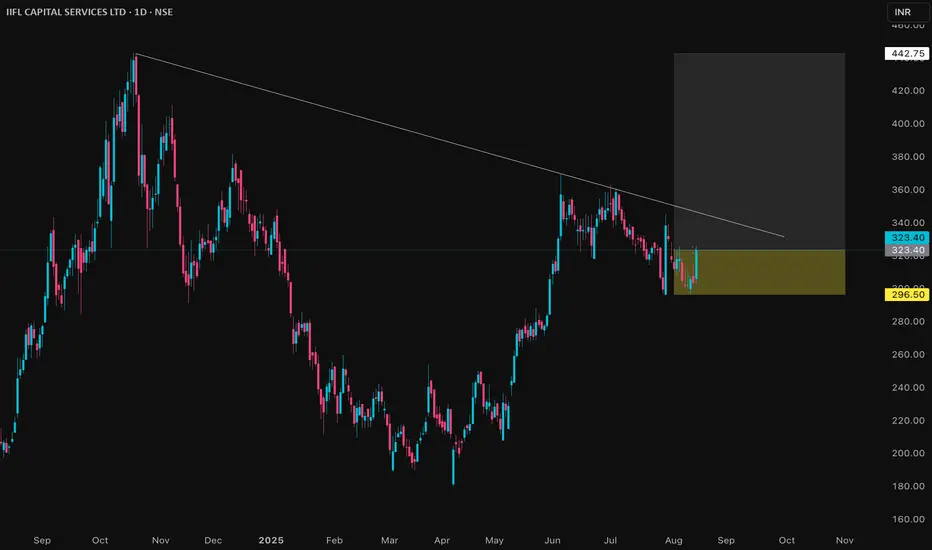
IIFLCAPS Price Action## IIFL Capital Services Ltd – Price Analysis (August 2025)
### Price & Market Metrics
- Current share price is approximately ₹323 as of August 13, 2025.
- Market capitalization is around ₹9,649 crore.
- 52-week price range is ₹170 (low) to ₹449 (high).
- All-time high was ₹449 on October 21, 2024.
- All-time low was ₹19.10 on October 15, 2019.
### Returns & Volatility
- Recent price movement shows some volatility, with the price trading mostly in the range of ₹300–₹330 over August 2025.
- The stock rebounded after hitting lows near ₹170 in April 2025.
- Trading volumes appear moderate with daily volumes in the range of 100,000 to 700,000 shares recently.
### Valuation & Financial Highlights (typical for financial services sector)
- Price/Earnings (P/E) ratio data was not specifically stated but likely moderate given sector norms.
- The company is part of the financial sector, focusing on capital markets and financial services.
### Qualitative Notes
- IIFL Capital has shown resilience after a significant dip in early 2025 and is maintaining a stable trading range.
- The company has a solid market capitalization reflecting its presence in the financial services industry.
- Volatility and price swings are typical of the capital markets sector, influenced by market conditions and investor sentiment.
### Summary
IIFL Capital shares are currently trading well below their all-time highs but have recovered from significant lows earlier in 2025. The stock displays moderate volatility consistent with the financial services sector and recently trades near ₹320. Market capitalization and trading volumes indicate solid investor interest. Valuation appears reasonable for its sector, but investors should watch for market volatility and financial sector dynamics in their decisions.
Motilal Oswal Financial Services LtdDate 13.08.2025
Motilal Oswal
Timeframe : Day Chart
MOFSL Group Services
(1) Capital markets
(2) Asset and Wealth Management
(3) Housing Finance
Revenue Split
(1) Capital Markets - 71% (54% rev earned from Brokerage)
(2) Asset & Wealth Management - 18%
(3) Housing Finance - 11%
Operational Metrics
(1) AUM Rs. 4,10,000 crs
(2) Lending Book Rs. 10,500 crs.
(3) Clients 60 crs.
Capital Markets
(1) Demat accounts increased over 3x from 47 mn to 130 mn
Asset & Wealth Management
(1) Wealth RMs increased from 123 to 221
(2) Company has a network spread 550+ cities and towns
(3) 2,500+ Business Locations operated by their Business Partners
Valuations
(1) Market Cap = ₹ 55,625 Cr.
(2) Stock P/E = 20.0
(3) Book Value = 5X
(4) ROCE = 18.7 %
(5) ROE = 25.2 %
(6) Median sales growth = 18.5% (last 10 years)
(7) Profit growth = 68.7% CAGR (last 5 years)
(8) Operating profit margin = 55%
Shareholding Pattern
(1) Promoters = 67.80%
(2) FIIs = 7.29%
(3) DIIs = 5.44%
(4) Public = 19.46%
Regards,
Ankur

BYD Company Limited (BYDDY) AnalysisCompany Overview:
BYD Company Limited OTC:BYDDY is a Chinese EV and battery manufacturing leader, investing CNY 100B to dominate the intelligent EV market with AI-driven systems and advanced driver assistance—offered at no extra cost to consumers.
Key Catalysts:
Product Expansion & Global Reach 🌍
2024 saw the launch of flagship EV models across multiple segments.
New market entries in Colombia and Oman are accelerating international sales.
Vertical Integration Advantage 🏭
BYD’s fully integrated supply chain covers everything from battery production to final assembly.
This enables cost control, rapid innovation, and resilience against supply chain disruptions.
AI & Smart Mobility Leadership 🤖
Intelligent vehicle systems enhance driving experience and safety.
Strategic investment positions BYD as a global disruptor in next-gen mobility.
Investment Outlook:
Bullish Case: We are bullish on BYDDY above $12.00–$13.00, supported by global expansion, vertical integration, and AI-driven innovation.
Upside Potential: Price target: $20.00–$22.00, reflecting market share gains and technological leadership.
📢 BYD—Driving the Future with AI, Global Reach, and Vertical Strength. #BYD #EVs #ElectricVehicles #AI #Batteries

How Promoter Holding Tells You the Real Story of a Company!Hello Traders!
When you invest in a company, you’re putting your money into the vision and decisions of its promoters.
One of the most powerful yet overlooked indicators of a company’s future is its promoter holding , the percentage of shares owned by the people who run the business.
Here’s why it matters and how to read it.
1. High Promoter Holding Shows Confidence
If promoters own a large portion of the company, it means they have a big personal stake in its success.
They win only when shareholders win, which often aligns their interests with yours.
2. Falling Promoter Holding Can Be a Red Flag
If promoters are consistently reducing their stake without clear reasons, it could mean they are losing confidence or need cash for other purposes.
This trend needs deeper investigation before you invest.
3. Pledged Shares Tell Another Story
Sometimes promoters pledge their shares to take loans.
If a large percentage of holdings is pledged, it’s a risk, because if the loan isn’t repaid, lenders can sell those shares, pushing the stock price down.
4. Stability Over Time is a Good Sign
A steady promoter holding over years shows trust in the business and signals that promoters are in it for the long run.
Rahul’s Tip:
Promoter holding should never be looked at in isolation.
Always check it alongside fundamentals, financial health, and industry outlook before making any decision.
Conclusion:
Promoter holding can reveal the real confidence level of the people behind the company.
When the promoters are heavily invested, and not pledging their shares, it’s usually a sign you’re looking at a solid long-term bet.
If this post gave you a new perspective, like it, drop your thoughts in the comments, and follow for more practical stock market insights!

GOLD SURGES AFTER CPI – TARGETING 337x BEFORE SELL-OFF? MMFLOW TECHNICAL OUTLOOK
📌 Market Overview
Following the CPI release, gold reacted with strong buying momentum (FOMO BUY), pushing prices swiftly from the 333x area up to 335x.
The main driver here is the BUY side taking advantage of remaining liquidity gaps above, aiming to break through the critical 3358 resistance – the first major barrier before reaching 337x, a key equilibrium zone that previously acted as a strong price-holding area for SELL orders.
Current structure indicates:
Short-term trend: Bullish, but approaching key distribution levels.
Liquidity Hunt: A decisive break above 3358 with strong volume could trigger a rapid move towards 337x, activating SELL volume from pending limit orders.
Macro context: No major news events today, with expected daily range ~35–40 points, increasing the chance of range-bound traps before a breakout.
🧐 Technical Outlook – MMFLOW View
Market Structure: Gold has formed a Higher Low around 333x and is now testing short-term resistance.
Key Levels & Liquidity Zones:
Liquidity BUY ZONE at 3338–3336 has reacted well, confirming BUYers are still defending this zone.
Supply Zone / CP Zone at 3375–3377 aligns with an H1 Order Block, holding a high concentration of pending SELL orders.
Volume Flow: Increasing volume as price approaches resistance suggests a potential “last push” before a reversal.
🎯 MMFLOW Trading Plan
🔹 BUY SCALP – Following the main trend
Entry: 3338 – 3336
SL: 3332
TP: 3342 – 3346 – 3350 – 3355 – 3360 – 3370 – 3380
🔹 SELL SCALP – At the distribution zone
Entry: 3375 – 3377
SL: 3382
TP: 3370 – 3365 – 3360 – 3355 – 3350 – 3340
📊 Key Technical Levels
Resistance: 3358 – 3365 – 3376
Support: 3342 – 3337 – 3330 – 3310
💡 MMFLOW Insight: With the current setup, the optimal strategy is to wait for a BUY opportunity near early support (334x) to ride the short-term bullish momentum, then watch for price reaction at 337x to catch potential SELL entries once top-side liquidity is swept.

HINDALCO Price Action ## HINDALCO Price Analysis (August 2025)
### Price & Market Metrics
- **Current share price:** ₹700.50 (NSE, as of August 13, 2025).
- **Market capitalization:** Approximately ₹1,574 billion (₹1.57 lakh crore).
- **52-week price range:** ₹546.45 (low) to ₹772.65 (high).
- **Day's trading range:** ₹670.95 to ₹704.95 on the latest session.
- **Price change:** Up about 5.01% from previous close.
### Returns & Volatility
- **1-week price change:** Approximate gain of 2.29%.
- **3-month price change:** About 10.36% gain.
- **6-month price change:** Around 16.27% gain.
- The stock shows moderate volatility consistent with general metals sector trends.
### Valuation Metrics
- **Price/Earnings (P/E) ratio:** Approximately 9.2, which is relatively attractive for the sector.
- **Earnings Per Share (EPS):** ₹76.11.
- **Price/Book (P/B) ratio:** Around 1.2.
- **Dividend yield:** Low, close to 0.7%.
### Financial & Business Highlights
- Hindalco has exhibited a strong revenue growth, with a recent annual revenue growth rate beating its past three-year CAGR.
- The company maintains control over its interest and employee expenses relative to operating revenues, with interest cost at about 1.43% of revenue.
- It operates in the metals and non-ferrous sector with a broadly positive market sentiment.
- The company recently held a board meeting focused on quarterly results, indicating active management and transparency.
### Technical & Sentiment Overview
- The recent price momentum is upward, with the stock closing near its higher range for the year.
- Volume traded is robust, reflecting active interest among investors.
- Technical charts indicate some bullish candle formations recently.
***
### Summary
Hindalco Industries is trading near ₹700, well within its 52-week range and showing resilient upward momentum backed by solid earnings and reasonable valuation multiples. The P/E ratio near 9.2 suggests the stock is relatively undervalued compared to many peers in the sector, supported by stable profitability and manageable expenses. Dividend yield is modest, reflecting a growth-oriented capital allocation approach.
The company’s strong operational performance, with revenue outpacing historical averages, combines with positive technical signals to offer confidence for investors. Moderate volatility and sector conditions should be considered, but overall the valuation appears attractive given Hindalco's bulk steel and aluminum markets exposure and growth trajectory.
Investors should watch for quarterly financial updates and sector dynamics for ongoing assessment.

SKIPPER Price Action## SKIPPER Price Analysis (August 2025)
### Price & Market Metrics
- Latest share price is approximately ₹538.75.
- Market capitalization stands around ₹6,074–6,085crore.
- The 52-week low is ₹341.55 (April 2025) and the high is ₹665.00 (December 2024).
- Recent price trend: Strong rebound from April lows, with current price near the top of the recent trading range.
- Day range on August 13: ₹505.10 – ₹538.20.
### Returns & Volatility
- 1-month gain: About 12%.
- 1-year return: Roughly 33–35%, outperforming broader indices and sector averages.
- 3-year return: Over 880%.
- Skipper often sees daily volatility in the 2–6% range, especially during August. Historically, Augusts show flat average returns but are characterized by abrupt price changes both upward and downward.
### Financial Performance
- Trailing 12-month EPS: ₹14.37.
- TTM net profit: About ₹158.9crore.
- Net sales for the last reported quarter (June 2025): ₹1,253.86crore, up 14.85% YoY.
- Consolidated net sales (March 2025): ₹1,287.75crore, up 11.64% YoY.
- Profit margin is moderate—company has low interest coverage and return on equity relative to valuation.
### Valuation
- P/E ratio: 35–37, well above sector average.
- P/B ratio: About 5.1.
- Dividend yield is very low, with most earnings retained.
- Book value per share: ₹105.69.
### Qualitative & Technical Notes
- The company’s growth is supported by solid export and infrastructure orders, but margins and returns remain modest compared to peers.
- Promoter holding is robust (around two-thirds of shares).
- Technical trend is positive, with outperformance versus sector and key moving averages, but sharp swings are common and corrections have occurred previously after strong rallies.
- Stock currently trades above estimated fair value and sector multiples.
***
### Summary
SKIPPER has rebounded powerfully from earlier lows and is now trading near multi-month highs, supported by strong sales growth and consistent profitability. However, the valuation has become elevated with respect to sector and intrinsic value metrics, while dividend yield remains nominal. Daily volatility and historical instability in August should be considered alongside strong long-term returns and positive business momentum—investors should be alert to potential price corrections or swings at these levels.

Bajaj Finance LtdDate 13.08.2025
Bajaj Finance
Timeframe : Weekly Chart
Key Metrics
(1) AUM: 416,661 Cr
(2) New Loan Booked: 43.42 Mn
(3) Customer Franchise: 101.82 Mn
(4) Cost of Fund: 7.97%
(5) Cost to Income: 33.2%
(6) ROA: 4.6%
(7) ROE: 19.2%
(8) Gross NPA: 0.96%
(9) Net NPA: 0.44%
(10) CRAR: 21.9%
AUM Mix FY25
(1) Urban: 43%
(2) Rural: 12%
(3) SME: 20%
(4) Commercial: 16%
(5) Mortgage: 9%
FY26 Guidance
(1) Customer franchise: 14-16 Mn
(2) AUM Growth: 24%-25%
(3) Credit Cost: 1.85%-1.95%
(4) ROA: 4.4%-4.6%
(5) ROE: 19%-20%
(6) GNPA: 1.2%-1.4%
(7) NNPA: 0.4%-0.5%
Business Wise AUM
(1) Bajaj Finance: 73%
(2) Bajaj Housing Finance: 27%
Pan India Presence
(1) 4,263 locations presence in India
(2) 2,681 rural locations
(3) 1,582 urban locations
(4) 2,32,200 active distribution network
Digital Channels
(1) Bajaj Finserve App
(2) Bajaj Finserve Website
(3) Payment
Valuations
(1) Market Cap = ₹ 5,29,333 Cr.
(2) Stock P/E = 30.4
(3) Book Value = 5.5X
(4) ROCE = 11.4 %
(5) ROE = 19.2 %
(6) Financing Margin = 34%
(7) Median sales growth = 30.9% (last 10 years)
Regards,
Ankur

Jammu and Kashmir Bank LtdDate 13.08.2025
Jammu and Kashmir Bank
Timeframe : Weekly Chart
Business Segments
(1) Retail Banking: 60%
(2) Treasury: 21%
(3) Corporate Banking: 19%
Key Ratios
Yield: 9.5%
CoF: 4.42%
NIM: 4%
CRAR: 15%
NIM: 3.90%
GNPA: 3.95%
NNPA: 0.85%
PCR: 90.54%
Branch Break-Up
(1) Rural: 54%
(2) Metro: 19%
(3) Semi-Urban: 16%
(4) Urban: 11%
Loan Book
Gross advances of the bank stood at Rs. 99,242 Cr
Gross Advance Mix
(1) Personal Finance: 39%
(2) Trade & Services: 21%
(3) Agriculture: 10%
(4) Financial Markets: 10%
(5) Manufacturing: 7%
(6) Others: 13%
Deposits
Bank has total deposits of Rs. 1,37,918 Cr
Deposits Mix
(1) Term Deposits: 51%
(2) CASA: 49%
Sponsored Regional Rural Bank (RRB)
(1) The bank sponsors J&K Grameen Bank and holds a stake of 35%.
(2) The operations of J&K Grameen Bank are carried out in 13 districts of the UT of J&K
(3) UT of Ladakh including Baramulla, Bandipora, Kupwara, Ganderbal, Srinagar Jammu
(4) It has 216 branches and 1,226 employees
Valuations
(1) Market Cap = ₹ 11,474 Cr.
(2) Stock P/E = 5.27
(3) Book Value = 0.81X
(4) ROCE = 6.15 %
(5) ROE =15.8 %
(6) EPS = 19
(7) Financial Margin = 12%
Regards,
Ankur

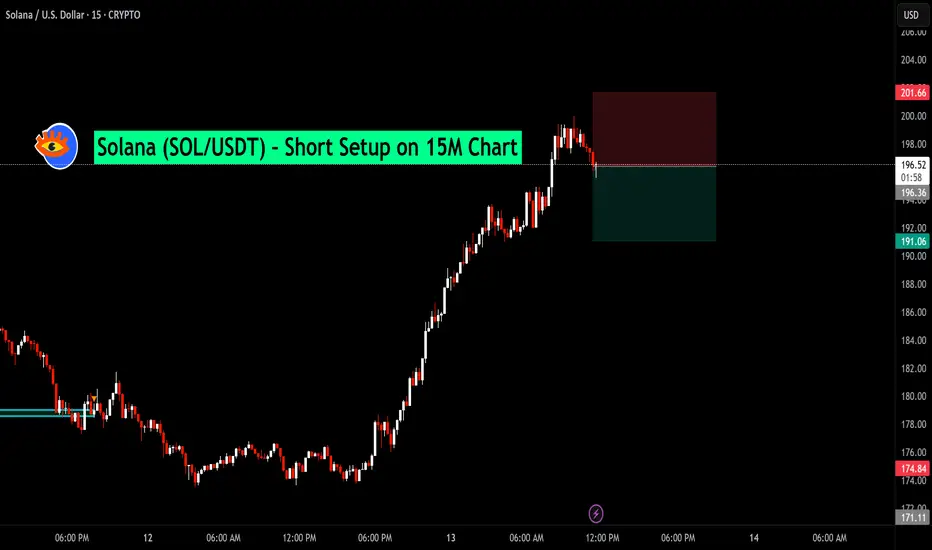
Solana (SOL/USDT) – Short Setup on 15M ChartAfter an extended bullish run, Solana is showing early signs of exhaustion near the $196–$197 zone. Price has failed to sustain above recent highs, forming a potential short-term reversal pattern.
📉 Trade Idea:
Entry: $196.40
Stop Loss: $201.66 (Above recent swing high)
Target: $191.06 (Support zone from prior consolidation)
This setup aims to capture a pullback move following a strong rally, with a favorable risk-to-reward ratio.
USDCAD LongPrice broke out of a consolidation zone on the daily timeframe and retested and rejected the consolidation zone. On the 1hour timeframe, price created an orderblock. Price then had a break of structure and also created a FVG. Price retested the orderblock and the FVG. I entered long with the stoploss at 1.37680 and the Takeprofit at 1.37990.

Paytm ready for flyPaytm’s stock looks attractive for the short term due to its breakout above major resistance levels shown in the chart. The price is now above prominent moving averages (EMA 44, 100, 200), indicating bullish momentum. The pattern also suggests a strong upward trend with higher lows and accelerating volume, signaling continued buying interest and potential for further gains.
This analysis is for informational purposes only and should not be considered a recommendation to buy or sell any securities.

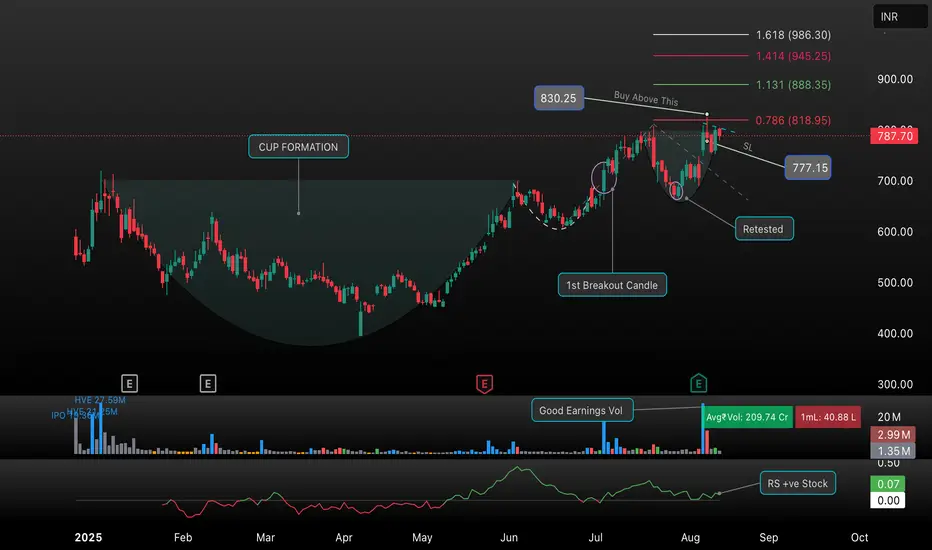
TransRail: Cup & Handle Breakout Setup | Key Levels & TargetsTransRail has recently formed a textbook cup and handle pattern, signaling a potential bullish breakout. The stock showed strong momentum after retesting the breakout zone and is currently consolidating near key resistance.
Key Points:
• Cup Formation: Evident over the past months, indicating accumulation.
• Breakout Levels: First breakout candle confirmed; price now approaching resistance at ₹830.25.
• Buy Trigger: Entry above ₹830.25 for bullish confirmation.
• Fibonacci Targets: Next potential targets at ₹888.35 (1.13 Fib), ₹945.25 (1.41 Fib), and ₹986.30 (1.618 Fib).
• Stop Loss: Maintain SL at ₹777.15 to manage risk.
• Volume: Strong earnings volume supports the setup.
Watch for sustained volume and a decisive move above resistance for confirmation. Add TransRail to your watchlist for a potential swing trade opportunity!
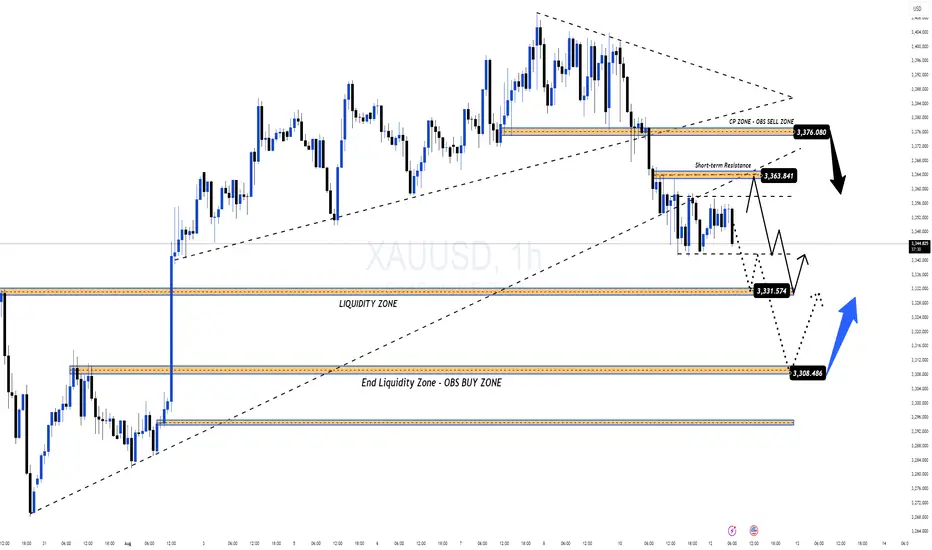
PROACHING LIQUIDITY ZONE – WAITING FOR CPI TO DECIDE NEXT MOVE📌 MARKET RECAP
Gold kicked off the week with a sharp $50 drop, breaking through key trendlines and nearby support zones.
The selling pressure came from:
Profit-taking after the recent strong rally.
USD strength expectations ahead of CPI data (forecast ~0.1% better than the previous reading).
Geopolitical factor: Ukraine–Russia ceasefire talks moving towards a conclusion, fueling risk-off sentiment.
🧐 WHAT’S NEXT?
If CPI beats expectations → USD strengthens → Gold could drop further into the Liquidity Zone 333x – 330x.
If CPI disappoints → USD weakens → Gold may quickly bounce back toward key level 337x (previous breakdown zone) for a retest before deciding direction.
🎯 MMFLOW GAME PLAN
1️⃣ BUY SCALP
📌 Entry: 3331 – 3329
📌 SL: 3325
📌 TP: 3335 – 3340 – 3345 – 3350 – 3360 – 3370 – 3380
2️⃣ BUY ZONE
📌 Entry: 3310 – 3308
📌 SL: 3304
📌 TP: 3314 – 3318 – 3322 – 3326 – 3330 – 3335 – 3340 – 3350 – 3360 – ???
3️⃣ SELL SCALP
📌 Entry: 3363 – 3365
📌 SL: 3370
📌 TP: 3360 – 3356 – 3352 – 3348 – 3344 – 3340
4️⃣ SELL ZONE
📌 Entry: 3376 – 3378
📌 SL: 3382
📌 TP: 3372 – 3368 – 3364 – 3360 – 3355 – 3350 – 3340
⚠️ RISK NOTE
CPI is the market’s dice roll – even a small deviation could trigger massive stop hunts.
Always watch the KeyLevels marked on the chart before entering trades.
How to Use Quarterly Results for Investment Decisions!Hello Traders!
Every three months, listed companies announce their quarterly results.
While many traders react instantly to the numbers, smart investors know how to read them in context before making a move.
Here’s how you can use quarterly results to make better investment decisions.
1. Compare With Previous Quarters
Don’t just look at the latest figures in isolation.
Compare revenue, profit, and margins with the last 3–4 quarters to see if the business is improving or declining.
2. Check Year-on-Year Growth
Seasonal factors can distort quarter-to-quarter results.
That’s why comparing the same quarter of the previous year (YoY) gives a clearer picture of long-term growth trends.
3. Watch for Margin Changes
Rising sales with falling margins can mean rising costs or pricing pressure.
Stable or improving margins show operational efficiency and pricing power.
4. Look Beyond Profits
Also track debt levels, cash flow, and promoter commentary in the results report.
Sometimes profits rise due to one-time gains, which don’t indicate real growth.
5. See Market Reaction – But Think Independently
Stock prices may jump or fall sharply after results.
Don’t follow the herd; understand the data yourself before taking a position.
Rahul’s Tip:
Quarterly results are snapshots, not the full movie.
Use them as a check-in point to confirm if your investment thesis still holds.
Conclusion:
Quarterly results can be a powerful tool if you know what to look for.
By focusing on growth trends, margins, and underlying financial health, you can make smarter investment decisions and avoid knee-jerk reactions.
If this helped you, like the post, share your thoughts in the comments, and follow for more practical stock market insights!
Part 12 Trading Master ClassCommon Mistakes to Avoid
Holding OTM options too close to expiry hoping for a miracle.
Selling naked calls without understanding unlimited risk.
Over-leveraging with too many contracts.
Ignoring commissions and slippage.
Not adjusting positions when market changes.
Practical Tips for Success
Backtest strategies on historical data.
Start with paper trading before using real money.
Track your trades in a journal.
Combine technical analysis with options knowledge.
Trade liquid options with tight bid-ask spreads.

Part 2 Ride The Big MovesAdvanced Options Strategies
Butterfly Spread
When to Use: Expect stock to stay near a specific price.
How It Works: Buy 1 ITM option, sell 2 ATM options, buy 1 OTM option.
Risk: Limited.
Reward: Highest if stock ends at middle strike.
Example: Stock ₹100, buy call ₹95, sell 2 calls ₹100, buy call ₹105.
Calendar Spread
When to Use: Expect low short-term volatility but possible long-term move.
How It Works: Sell short-term option, buy long-term option at same strike.
Risk: Limited to net premium.
Reward: Comes from time decay of short option.
Ratio Spread
When to Use: Expect limited move in one direction.
How It Works: Buy 1 option, sell multiple options at different strikes.
Risk: Unlimited on one side if not hedged.
Diagonal Spread
When to Use: Expect gradual move over time.
How It Works: Buy long-term option at one strike, sell short-term option at different strike.

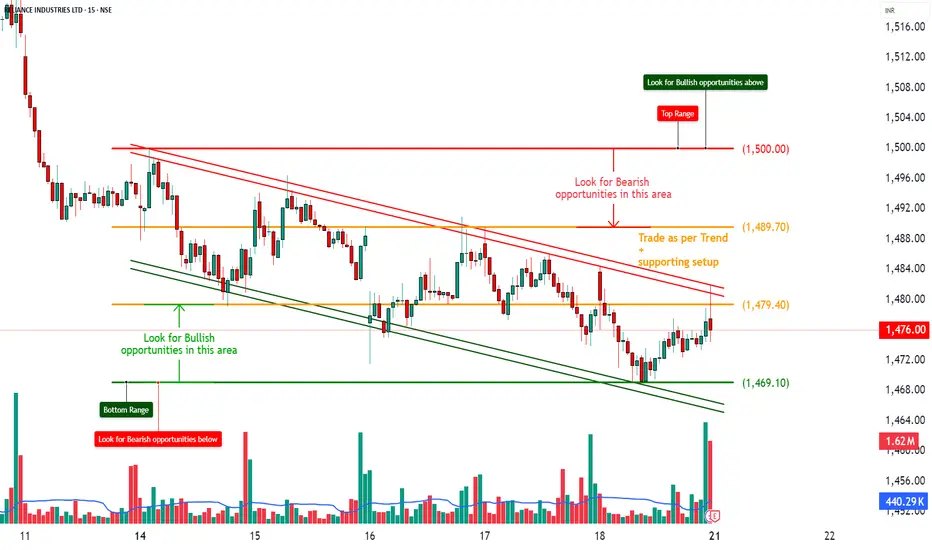
RELIANCE – Positive Outlook Post Q1 Results with Bullish OI________________________________________________________________________________📈 RELIANCE – Positive Outlook Post Q1 Results with Bullish OI Confirmation
📅 Setup Date: 17.07.2025 | ⏱ Timeframe: Daily
📍 Strategy: Post-Earnings Momentum Setup with Defined Risk
________________________________________________________________________________
🔍 Overall View
Spot Price: ₹1476
Q1 Result Update: Profit ↑12% YoY, beat estimates — strong earnings trigger
Trend: Bullish Reversal – Price holding above 1470 with fresh long build-up in CEs
Volatility: IV ~23–27%, stable to slightly rising → good for directional plays
Ideal Strategy Mix: Bullish directional spreads or high delta long CE
________________________________________________________________________________
1️⃣ Bullish Trade
Best CE: Buy 1480 CE @ ₹25.15
Why:
• Long Build-Up (+60.38% OI) with price ↑3.5% — strong institutional buying
• At-the-money with delta 0.50 → responsive to price movement
• High OI (27.5 lakh) with active volumes confirms smart money activity
• Matches post-result momentum — ideal CE for breakout strategy
________________________________________________________________________________
2️⃣ Bearish Trade (Contrarian)
Best PE: Sell 1450 PE @ ₹10.75
Why:
• Short Covering seen (-5.57% OI) → downside hedge positions getting closed
• Price ↑3.3% and IV stable (22.36%) → premium erosion favorable
• Spot is comfortably above ₹1450, providing buffer
• Rests below key support zone post-result → limited downside expectation
________________________________________________________________________________
3️⃣ Strategy Trade (As per trend + OI data)
Strategy: Bull Call Spread → Buy 1480 CE / Sell 1520 CE
→ ₹25.15 / ₹8.85
Net Debit: ₹16.30
Max Profit: ₹40 – ₹16.30 = ₹23.70
Max Loss: ₹16.30
Risk:Reward: ≈ 1 : 1.45 ✅
Lot Size: 500
Total Risk: ₹8,150
Max Profit: ₹11,850
📊 Breakeven Point: ₹1496.30
📉 Exit If: Spot closes below ₹1465 (invalidates CE strength and post-result optimism)
________________________________________________________________________________
Why:
• Strong Q1 numbers + fresh long build-up on 1480 CE and 1470 CE
• 1520 CE also active but minor short covering = good candidate to sell
• IVs are moderate, giving clean pricing for spreads
• Defined risk, R:R > 1:1, and positive delta makes this strategy safer
________________________________________________________________________________
📘 My Trading Setup Rules
Avoid Gap Plays
→ Check pre-open price action to avoid trades influenced by gap-ups/gap-downs.
Breakout Entry Only
→ Enter trades only if price breaks previous day’s High (for bullish trades) or Low (for bearish trades).
Watch Volume for Confirmation
→ Monitor volume closely. No volume = No trade.
Enter on Strong Candle + Volume
→ Execute the trade only if a strong candle appears with increasing volume in the direction of the trade.
Defined Risk:Reward Only
→ Take trades only if R:R is favourable (ideally ≥ 1:2).
Premium Disclaimer
→ Option premiums shown are based on EOD prices — real-time premiums may vary during execution.
Time Frame Preference
→ Trade with your preferred time frame — this strategy works across intraday or positional setups.
________________________________________________________________________________
⚠ Disclaimer (Please Read):
• These Trades are shared for educational purposes only and is not investment advice.
• I am not a SEBI-registered advisor.
• The information provided here is based on personal market observation.
• No buy/sell recommendations are being made.
• Please do your own research or consult a registered financial advisor before making any trading decisions.
• Trading involves risk. Always use proper risk management.
I am not responsible for trading decisions based on this post.
________________________________________________________________________________