Graphite India LtdDate 12.08.2025
Graphite India
Timeframe : Day Chart
Business Segments
(1) Graphite & Carbon Segment 86% -
Production of graphite electrodes, other miscellaneous carbon, graphite products, calcined petroleum coke, carbon paste, and impervious graphite equipment and spares.
(2) Other Segments 14% -
Segment produces glass-reinforced plastic pipes, high-speed steel, and alloy steel.
Geographical Split
(1) India: 64%
(2) ROW: 36%
Manufacturing Facilities
(1) Durgapur - India
(2) Nashik - India
(3) Nurnberg - Germany
Valuations :
(1) Market Cap = ₹ 10,257 Cr
(2) Stock P/E = 28
(3) Book Value = 1.75X
(4) ROCE = 10.1 %
(5) ROE = 7.93 %
(6) OPM = 10%
Sale of Land
The company sold its land at Whitefield, Bengaluru for Rs. 986 Cr to 2 WOS of Tata Realty and Infrastructure Ltd.
It used a part of the proceeds to repay debt, which is reduced to 177 Crs in FY24/25 from 432 Crs in FY22
Regards,
Ankur
Fundamental Analysis

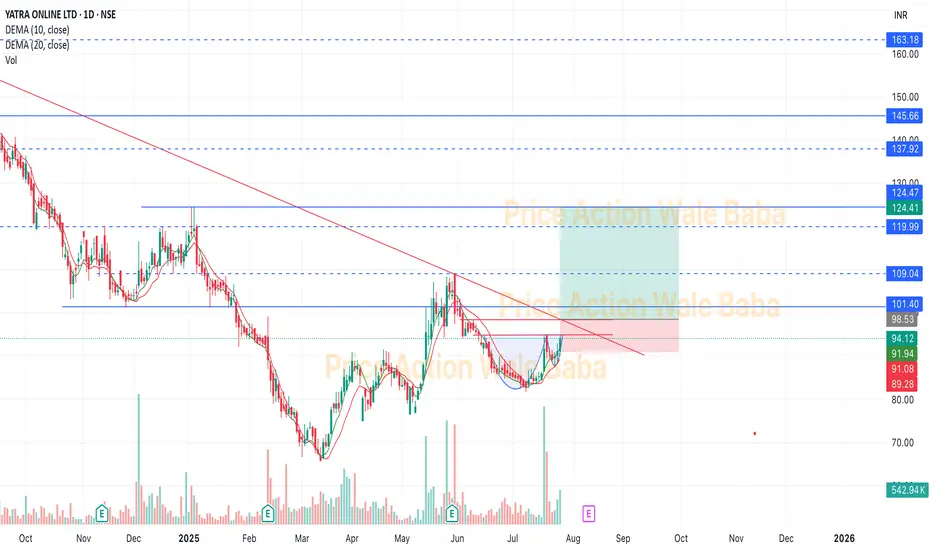
Yatra Online LtdYatra Online Ltd
a) YOL deals in the entire value chain of travel and hospitality, covering B2C and B2B segments.
b) It is the largest Corporate travel services provider, and one of the largest OTAs with ~80,000 domestic hotels and homestays contracted in ~1497 cities.
c) It provides a Real-time and Integrated SaaS Tech Platform which is accessible through the desktop & Mobile apps.
d) The company has a customer base of over 1,300 large corporates with addressable employee base of 9+ million employees.
Service:
The company is one of India’s leading online travel platforms, offering comprehensive corporate travel services to over 850 corporate clients. It facilitates bookings for domestic and international flights, hotels, holiday packages, buses, trains, cabs, homestays, cruises, and local activities. With a network of approximately 108,000 hotels and homestays across 1,500 Indian cities and access to around 2 million hotels globally, it stands as the largest domestic hotel platform in India.
Market Cap: ₹ 1,477 Cr.
Promoter holding: 64.5 %
FII holding: 2.82 %
DII holding: 19.1 %
Public holding: 13.6 %
Debt: ₹ 78.4 Cr.
Debt 3Years back: ₹ 62.8 Cr.
Looks good to buy on every deep, once breakout come it will give good movement.
Option Chain Terms1. Introduction: What is an Option Chain?
An Option Chain (also called an options matrix) is like a detailed menu for all the available Call and Put options of a particular underlying asset (such as a stock, index, or commodity) for different strike prices and expiry dates.
If you’re a trader, the option chain is where you see all the numbers that decide your trading choices — prices, volumes, open interest, and Greeks.
Think of it as the cockpit of an airplane — lots of data, but if you know what each dial means, you can navigate smoothly.
Example:
If you open the NSE India website and look at the NIFTY Option Chain, you’ll see something like:
Strike Price CALL LTP CALL OI PUT LTP PUT OI
19500 ₹250 1,20,000 ₹15 80,000
19600 ₹180 95,000 ₹25 90,000
This is a simplified snapshot — in reality, there are more columns like bid-ask prices, implied volatility, and Greeks.
2. Core Sections of an Option Chain
An option chain is split into two halves:
Left Side: Call options (bullish contracts)
Right Side: Put options (bearish contracts)
Middle: Strike Prices (common to both)
Here’s how the layout looks visually:
markdown
Copy
Edit
CALL DATA | STRIKE PRICE | PUT DATA
-----------------------------------------------
OI Chg OI LTP IV | 19500 | IV LTP Chg OI OI
OI Chg OI LTP IV | 19600 | IV LTP Chg OI OI
3. Option Chain Key Terms
Let’s go deep into each term one by one.
3.1 Strike Price
The predetermined price at which you can buy (Call) or sell (Put) the underlying asset if you exercise the option.
Every expiry has multiple strike prices — some above the current market price, some below.
Example:
If NIFTY is at 19,500:
19,500 Strike → ATM (At The Money)
19,600 Strike → OTM (Out of The Money) Call, ITM (In The Money) Put
19,400 Strike → ITM Call, OTM Put
3.2 Expiry Date
The last trading day for the option. After this date, the contract expires worthless if not exercised.
In India:
Index options (like NIFTY, BANKNIFTY) → Weekly expiries + Monthly expiries
Stock options → Monthly expiries
3.3 Call Option (CE)
Gives you the right (not obligation) to buy the underlying at the strike price.
Traders buy calls when they expect the price to rise.
3.4 Put Option (PE)
Gives you the right (not obligation) to sell the underlying at the strike price.
Traders buy puts when they expect the price to fall.
3.5 LTP (Last Traded Price)
The most recent price at which the option contract traded.
Reflects the current market value of that option.
3.6 Bid Price & Ask Price
Bid Price: Maximum price buyers are willing to pay.
Ask Price: Minimum price sellers are willing to accept.
The gap between them is called the Bid-Ask Spread.
3.7 Bid Quantity & Ask Quantity
Bid Quantity: Number of contracts buyers want to purchase at the bid price.
Ask Quantity: Number of contracts sellers are offering at the ask price.
3.8 Volume
Total number of contracts traded during the current trading session.
High volume indicates strong interest and liquidity.
3.9 Open Interest (OI)
Total number of outstanding contracts that haven’t been closed or squared off.
Shows market positioning:
High OI in calls → Bearish or range-bound expectation.
High OI in puts → Bullish or range-bound expectation.
3.10 Change in Open Interest (Chg OI)
How much OI has increased or decreased from the previous session.
Used to detect fresh positions or unwinding.
3.11 Implied Volatility (IV)
Market’s expectation of future volatility.
Higher IV → Option premiums become expensive.
Lower IV → Options are cheaper.
3.12 Greeks in the Option Chain
Greeks measure how sensitive the option price is to changes in market factors:
Delta → Price change sensitivity to the underlying asset.
Gamma → Rate of change of Delta.
Theta → Time decay rate of the option price.
Vega → Sensitivity to changes in volatility.
Rho → Sensitivity to interest rate changes.
3.13 ATM, ITM, and OTM
ATM (At The Money): Strike price is equal to the current price.
ITM (In The Money): Option has intrinsic value.
OTM (Out of The Money): Option has no intrinsic value (only time value).
3.14 Premium
The price you pay to buy an option.
Premium = Intrinsic Value + Time Value.
3.15 Break-Even Point
Price level at which your option trade starts becoming profitable.
3.16 PCR (Put-Call Ratio)
Formula: PCR = Put OI / Call OI
High PCR (>1) → Bullish sentiment.
Low PCR (<1) → Bearish sentiment.
4. How to Read the Option Chain
Reading an option chain is about spotting where traders are placing their bets.
Step-by-step:
Identify ATM Strike.
See highest OI in Calls and Puts — this shows resistance and support levels.
Look at Change in OI to spot fresh activity.
Check IV movement for volatility expectations.
Use Greeks for risk assessment.
Example Analysis:
NIFTY at 19,500
Highest Call OI: 19,800 (Resistance)
Highest Put OI: 19,400 (Support)
PCR = 1.2 → Mildly bullish
5. Practical Use Cases
Finding Support & Resistance:
Highest Put OI → Support
Highest Call OI → Resistance
Spotting Breakouts:
Sudden drop in Call OI at resistance → Possible breakout.
Volatility Trading:
High IV → Consider selling options.
Low IV → Consider buying options.
6. Advanced Option Chain Insights
Long Buildup: Price ↑, OI ↑ → Bullish.
Short Buildup: Price ↓, OI ↑ → Bearish.
Short Covering: Price ↑, OI ↓ → Bullish reversal.
Long Unwinding: Price ↓, OI ↓ → Bearish reversal.
7. Common Mistakes to Avoid
Ignoring IV before entering trades.
Reading OI without considering price movement.
Not adjusting for upcoming news or events.
Trading illiquid strikes with wide bid-ask spreads.
8. Conclusion
An option chain is not just a table of numbers — it’s a real-time X-ray of trader sentiment.
By understanding every term — from LTP to IV, from Delta to PCR — you can turn raw data into actionable insights.
Mastering the Art of Risk Management in Trading 1. Introduction: Why Risk Management is the Heart of Trading
Trading is not about making big profits quickly — it’s about staying in the game long enough to let your edge work for you.
Think of trading like a professional sport. Skill matters, but survival matters more. Even the world’s best traders lose trades; what separates them from amateurs is how they manage those losses.
In simple terms:
Good trading without risk management = gambling.
Average trading with strong risk management = long-term success.
Warren Buffett’s famous rules apply perfectly here:
Don’t lose money.
Never forget rule #1.
2. Core Principles of Risk Management
Before we go deep into strategies, let’s lock in the foundation.
2.1 Risk is Inevitable
Every trade carries risk. The goal is not to avoid it but to control its size and impact.
2.2 Asymmetry in Trading
A 50% loss requires a 100% gain to break even. This means avoiding large drawdowns is far more important than chasing big wins.
Loss % Required Gain to Recover
10% 11.1%
25% 33.3%
50% 100%
75% 300%
2.3 Risk per Trade
Most professional traders risk 0.5%–2% of their account per trade.
This ensures no single bad trade can destroy the account.
3. The Psychology of Risk
Risk management is not just math — it’s deeply psychological.
Loss Aversion Bias: Humans feel losses twice as strongly as gains. This can push traders into revenge trading.
Overconfidence Bias: Winning streaks can lead to oversized positions.
Fear of Missing Out (FOMO): Chasing trades without proper entry rules increases risk.
A great risk management system removes emotional decision-making by setting clear, mechanical rules.
4. Position Sizing: The Risk Control Lever
Position sizing determines how much capital to put into a trade. Even if your strategy is perfect, bad sizing can blow up your account.
4.1 Fixed Fractional Method
Risk a fixed % of capital per trade.
Example: If account = ₹10,00,000 and risk = 1% → Risk per trade = ₹10,000.
If Stop Loss = ₹50 away from entry, position size = ₹10,000 ÷ ₹50 = 200 shares.
4.2 Volatility-Based Position Sizing
Adjust position size according to the volatility of the asset (ATR – Average True Range).
If ATR = ₹25 and your risk budget = ₹5,000, position size = ₹5,000 ÷ ₹25 = 200 shares.
4.3 Kelly Criterion (Advanced)
Maximizes capital growth based on win rate & reward/risk ratio.
Formula: K% = W – (1 – W) / R
Where:
W = Win probability
R = Reward/Risk ratio
Caution: Kelly is aggressive; use fractional Kelly for real trading.
5. Stop Loss Strategies: Your Safety Net
A stop loss is not a sign of weakness — it’s a shield.
5.1 Fixed Stop Loss
Predefined point in price where you exit.
5.2 Volatility Stop Loss
Adjust stop distance using ATR to account for market noise.
5.3 Time-Based Stop
Exit after a fixed time if the trade hasn’t moved in your favor.
5.4 Trailing Stop
Moves with price in your favor to lock in profits.
Golden Rule: Place stops based on market structure, not emotions.
6. Reward-to-Risk Ratio (RRR)
The RRR tells you how much you stand to gain for every unit you risk.
Example:
Risk: ₹1000
Reward: ₹3000
RRR = 3:1 → Even a 40% win rate is profitable.
High RRR trades allow more losers than winners while staying profitable.
7. Diversification & Correlation Risk
7.1 Asset Diversification
Avoid putting all capital into one asset or sector.
7.2 Correlation Risk
If you buy Nifty futures and Bank Nifty futures, you’re effectively doubling your risk because they move together.
8. Risk Management for Different Trading Styles
8.1 Day Trading
Keep daily loss limits (e.g., 3% of capital).
Avoid revenge trading after a loss.
8.2 Swing Trading
Use wider stops to allow for multi-day fluctuations.
Position sizing becomes even more critical.
8.3 Options Trading
Risk can be higher due to leverage.
Always calculate max loss before entering.
9. Risk Management Tools
ATR Indicator – For volatility-based stops.
Position Size Calculators – To control exposure.
Heat Maps & Correlation Tools – To avoid overexposure.
Journaling Software – To track mistakes.
10. Risk-Adjusted Performance Metrics
Professional traders measure performance relative to risk taken.
Sharpe Ratio – Risk-adjusted returns.
Sortino Ratio – Focuses on downside volatility.
Max Drawdown – Largest account drop during a period.
11. Building a Personal Risk Management Plan
Your plan should cover:
Max % of capital risked per trade.
Max daily/weekly loss limit.
Position sizing rules.
Stop loss & target placement method.
Diversification guidelines.
Rules for scaling in/out.
Plan for handling drawdowns.
12. Advanced Concepts
12.1 Portfolio Heat
Sum of all open trade risks; keep it below a set % of account.
12.2 Value at Risk (VaR)
Estimates the max expected loss over a time frame.
12.3 Stress Testing
Simulate worst-case scenarios (e.g., gap downs, black swans).
Conclusion: Risk Management is Your Superpower
In trading, capital is ammunition. Risk management ensures you never run out of bullets before the big opportunities arrive.
Mastering it is not optional — it’s the difference between a short-lived hobby and a long-term career.
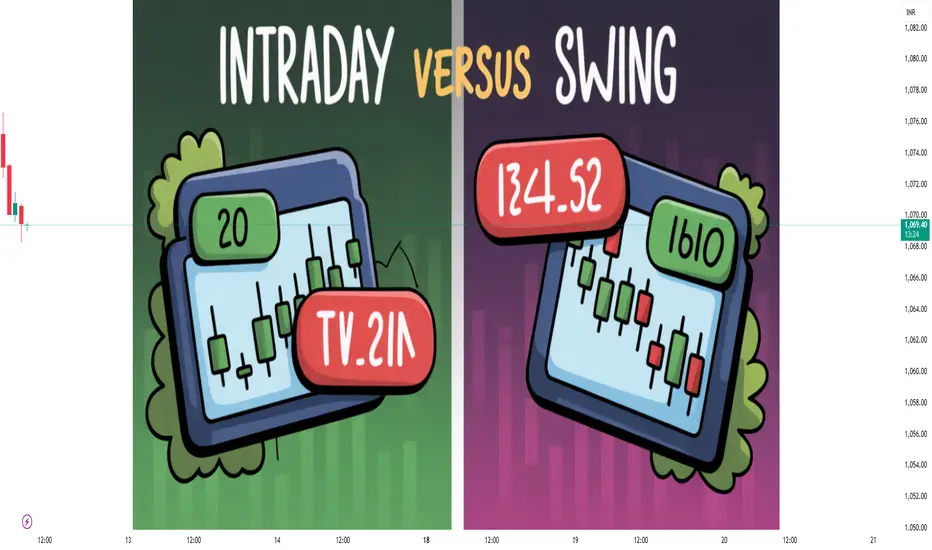
Intraday Trading vs Swing Trading1. Introduction to the Two Trading Styles
1.1 What is Intraday Trading?
Intraday trading, often called day trading, involves buying and selling a stock (or any tradable asset) within the same trading day.
The key points are:
Positions are never held overnight.
The goal is to capitalize on short-term price movements.
Traders often make multiple trades in a single day.
Requires continuous monitoring of charts and price action.
For example:
If the market opens at 9:15 AM and closes at 3:30 PM (in India), an intraday trader will enter and exit all trades during that time frame.
1.2 What is Swing Trading?
Swing trading focuses on capturing price swings that can last from a few days to several weeks.
The key points are:
Positions are held overnight and sometimes for weeks.
Aims to profit from medium-term trends.
Fewer trades compared to intraday trading.
Allows more flexibility — you don’t have to watch the screen all day.
For example:
A swing trader might buy a stock on Monday based on a bullish chart setup and hold it until the next Thursday when it hits their target.
2. Core Differences at a Glance
Aspect Intraday Trading Swing Trading
Holding Period Minutes to hours, same day only Days to weeks
Trading Frequency High (multiple trades/day) Low (few trades/week)
Capital Requirement Can be lower due to leverage (but higher risk) Moderate; less leverage
Market Monitoring Continuous, real-time Periodic (once/twice a day)
Stress Level High Moderate
Profit Potential Small profits per trade, cumulative gains Larger profits per trade
Risk Higher due to volatility & leverage Lower per trade but still significant
Technical Analysis Very short-term indicators Medium-term trends, chart patterns
Best for Quick decision-makers, active traders Patient traders, part-time market participants
3. Time Commitment and Lifestyle Fit
One of the biggest differences between the two is time commitment.
3.1 Intraday Trading Lifestyle
Requires full-time attention during market hours.
You need a dedicated trading setup with a fast internet connection, live charts, and possibly multiple monitors.
Ideal for those who enjoy fast decision-making and thrive under pressure.
No overnight market risk — but very sensitive to intraday volatility.
3.2 Swing Trading Lifestyle
Can be managed alongside a job or business.
You may only need to check charts once or twice daily.
Not as dependent on split-second execution.
Overnight gaps can cause gains or losses, but this is part of the strategy.
4. Analytical Approach and Tools
Both styles use technical analysis, but the indicators, timeframes, and patterns differ.
4.1 Intraday Trading Tools
Timeframes: 1-min, 5-min, 15-min, and 1-hour charts.
Indicators:
Moving Averages (5 EMA, 20 EMA)
VWAP (Volume Weighted Average Price)
RSI (Relative Strength Index)
MACD
Volume Profile
Strategies:
Breakout Trading
Scalping
Momentum Trading
Reversal Trading
Example:
An intraday trader may look for a breakout above a resistance level on a 5-minute chart and ride the move for 30 minutes.
4.2 Swing Trading Tools
Timeframes: 1-hour, daily, and weekly charts.
Indicators:
50-day and 200-day Moving Averages
RSI (14-period)
MACD (slower settings)
Fibonacci retracement
Strategies:
Trend-following
Pullback entries
Chart pattern breakouts (Cup & Handle, Flag, Head & Shoulders)
Example:
A swing trader might spot a bullish flag pattern on a daily chart and hold the stock for 7–10 days until the trend completes.
5. Risk and Money Management
Risk management is non-negotiable in both.
5.1 Intraday Trading Risk Profile
Typically risk 0.5%–1% of capital per trade.
Use of tight stop-losses (0.5%–2% price move).
Leverage can magnify profits — but also losses.
High risk of overtrading due to frequent opportunities.
5.2 Swing Trading Risk Profile
Typically risk 1%–3% of capital per trade.
Stop-losses are wider (5%–10%) due to longer holding periods.
Leverage is less common.
Lower chance of overtrading but more exposure to overnight news events.
6. Psychological Factors
The psychology of trading is often underestimated — but it’s the hidden battlefield.
6.1 Intraday Trading Mindset
Requires quick thinking and emotional control.
Must accept being wrong quickly and exit trades.
High adrenaline; mistakes can happen if overexcited.
Pressure is intense — small distractions can be costly.
6.2 Swing Trading Mindset
Requires patience and discipline.
Must tolerate overnight volatility.
Less pressure from immediate decision-making.
Risk of “holding and hoping” if the trade goes wrong.
7. Costs and Infrastructure
7.1 Intraday Trading Costs
Higher brokerage fees due to frequent trades.
Need a high-speed internet connection.
Possibly premium data feeds and charting software.
7.2 Swing Trading Costs
Lower brokerage costs (fewer trades).
Basic trading platforms are enough.
No need for ultra-fast execution speed.
8. Pros and Cons of Each Style
8.1 Intraday Trading Pros
Quick results — profit/loss is realized the same day.
No overnight risk.
Many opportunities daily.
Intraday Cons:
High stress and mental fatigue.
Requires constant attention.
Overtrading temptation.
8.2 Swing Trading Pros
Less time-intensive.
Larger moves per trade possible.
Easier for people with other commitments.
Swing Cons:
Overnight gaps can hurt.
Slower feedback loop.
Can miss fast intraday moves.
9. Which is More Profitable?
This is a trick question — profitability depends more on the trader’s skill, discipline, and consistency than the style itself.
Intraday traders often make many small profits; compounding them can lead to large gains, but losses can pile up fast.
Swing traders aim for fewer but larger profits, which can be less stressful but require more patience.
10. Deciding Which Style Suits You
Ask yourself:
Can you sit in front of a screen for hours without losing focus? (Yes → Intraday)
Do you prefer analyzing charts once a day? (Yes → Swing)
Are you comfortable with overnight risk? (Yes → Swing)
Do you want to avoid holding positions overnight? (Yes → Intraday)
Do you thrive under pressure? (Yes → Intraday)
Are you patient enough to wait days for a trade to work? (Yes → Swing)
Final Thoughts
There’s no universal “better” option between intraday trading and swing trading — only the option that’s better for you.
Both can be profitable if approached with:
Solid strategy
Risk management
Psychological discipline
Continuous learning
Whether you enjoy the fast-paced, high-energy environment of intraday trading or the patient, trend-focused approach of swing trading, the real key lies in execution and discipline.
BUY TODAY SELL TOMORROW for 5%DON’T HAVE TIME TO MANAGE YOUR TRADES?
- Take BTST trades at 3:25 pm every day
- Try to exit by taking 4-7% profit of each trade
- SL can also be maintained as closing below the low of the breakout candle
Now, why do I prefer BTST over swing trades? The primary reason is that I have observed that 90% of the stocks give most of the movement in just 1-2 days and the rest of the time they either consolidate or fall
Trendline Breakout in STARCEMENT
BUY TODAY SELL TOMORROW for 5%

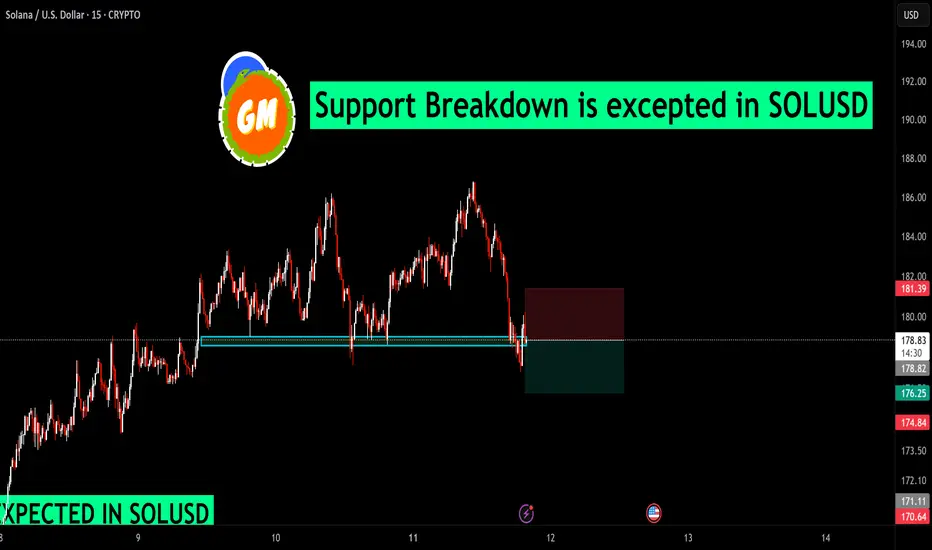
Support Breakdown is excepted in SOLUSDSOLUSD has breached a key support zone around the $178–$179 level, turning the area into potential resistance. Price action shows repeated rejections near this zone, followed by a decisive breakdown on strong bearish momentum.
If sellers maintain pressure below this level, further downside towards $175 and $171 could be on the cards. A sustained recovery back above $179 would be needed to invalidate the bearish outlook.
📉 Bias: Bearish below $179
🎯 Targets: $175 – $171
Buy GoldLet it go down and buy from there. Buy with small lot size and while managing your funds
Target 3351,3368,3375,3380,3390,3405,3430

Gold LongEntry- 3355-3352
SL- 3349
Target- 3368, 3370, 3375
Reason- Gold has broken out of a falling trendline in 1hr TF with a strong candle. News is also there that trump is not going to put tariff on gold bars.
Disclaimer- This is just for educational purposes please take advice before making any decision.
Jai Shree Ram.

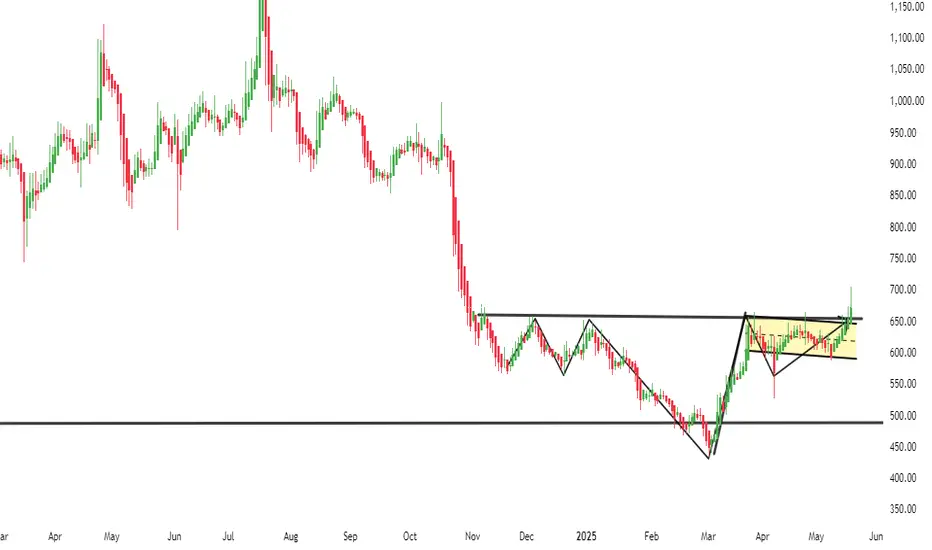
SUZLON swing tradeSuzlon Energy for Swing Trading (Initiating Tomorrow)
Current Status & Technical View:
* Suzlon is seen as being in a consolidation phase after a significant rally. This is viewed by some as a healthy base-building period before a potential upward move.
* It has shown a strong rally of 19% over the last three months, but has seen a slight pullback in the past month (down 4.7%) and week (down 4%).
* Technically, the stock is still viewed within a bullish medium-term setup, with key support noted near ₹61-₹62. The NSE shows the previous close at ₹64.21.
* Key resistance is identified around ₹68-₹70, and a decisive breakout above ₹68.30 could lead to targets of ₹73.50 and potentially ₹86.50.
* Crucially, Suzlon is scheduled to announce its Q1 results tomorrow, August 12th, 2025. This could be a significant catalyst for the stock price. Brokerages are expecting strong year-on-year growth in both PAT (55-58%) and revenue (around 60%).
Action Plan for Buying Tomorrow:
1. Monitor the Opening & Initial Price Action: The stock's reaction to the market opening and the release of Q1 results will be crucial.
* Strong Opening with Positive Results: If the Q1 results are positive and the stock opens strong, consider an entry around the current levels, or near the breakout level of ₹68-₹70 if it approaches that with good volume.
* Negative Reaction or Weak Opening: If the Q1 results are disappointing or the market reacts negatively, the stock could see a sharp decline. In such a scenario, it might be wiser to wait for the volatility to settle and for the stock to find support before considering an entry.
2. Entry Point:
* Conservative Entry: If the stock corrects after a potentially positive reaction to earnings, look for a bounce from support levels. The previous swing low at ₹59.80, which aligns with the 50-week EMA, could be a potential entry point if the stock finds strong support there.
* Breakout Entry: If the stock shows strong upward momentum and breaks above the ₹68-₹70 resistance zone with good volume, you could consider an entry on confirmation of the breakout.
3. Stop-Loss: To manage risk effectively, set a clear stop-loss order.
* Recommended Stop-Loss: Based on technical analysis, placing a stop-loss below ₹59.80 (the 50-week EMA) is a sound strategy to limit potential losses if the trade goes against you.
* Tighter Stop-Loss: If your risk appetite is lower, you could consider a tighter stop-loss near recent support levels, but ensure it's not too tight to get stopped out prematurely.
4. Selling Targets:
* Short-Term Targets: Target levels in the range of ₹74-₹80 in the near term.
* Medium-Term Target: An extended target of ₹86.50 is also suggested if the momentum continues.
5. Risk Management:
* Volatility: Be prepared for potential volatility tomorrow, especially around the Q1 earnings announcement.
* Don't Over-Leverage: Avoid over-leveraging your position, especially since Suzlon is considered a higher-beta stock.
* Market Sentiment: Keep an eye on the overall market sentiment, as it can influence the stock's performance.
I am not SEBI registered, please do your own research.

How to Read a Balance Sheet – Simple Breakdown for Traders!Hello Traders!
Most traders ignore the balance sheet because it looks “too accounting-heavy.”
But understanding just the basics can give you an edge, especially when you want to know if a company is financially healthy.
Today, let’s simplify the balance sheet so you can read it with confidence.
What is a Balance Sheet?
A balance sheet is a snapshot of a company’s financial position at a specific point in time.
It tells you what the company owns, what it owes, and what’s left for shareholders.
Three Main Sections You Must Know
Assets:
Everything the company owns that has value, cash, buildings, machinery, inventory, and money owed to it.
Assets show the company’s ability to generate future income.
Liabilities:
Everything the company owes to others, loans, unpaid bills, and other obligations.
High liabilities compared to assets can be a warning sign.
Shareholder’s Equity:
The value left for shareholders after liabilities are subtracted from assets.
It’s like the “net worth” of the company.
Key Ratios to Look At
Debt-to-Equity Ratio:
Shows how much of the company is funded by debt versus shareholder capital. Lower is generally better.
Current Ratio:
Compares current assets to current liabilities. If it’s above 1, the company can likely pay short-term debts.
Return on Equity (ROE):
Measures how efficiently management is using shareholder funds to generate profit.
Rahul’s Tip:
You don’t need to be an accountant to read a balance sheet.
Focus on big-picture numbers, assets, liabilities, and equity, and see if the business is stable, growing, and not overloaded with debt.
Conclusion:
A balance sheet tells you if the company can survive tough times and fund future growth.
Once you understand it, you’ll never look at a stock the same way again.
If this helped you, like the post, share your view in the comments, and follow for more practical investing insights!

CHENNAI PETRO-BLEND OF TECHNOFUNDABuy CHENNAI PETRO 680 TILL 610 FOR target of 740 and 850. Classic blend of fundamental a technical analysis. Bullish flag and inverse head & shoulder breakout happening at 630 levels.
Also available near P to B/V with dividend yield above 8%.
view invalid below 580.
Awaiting the BreakDown or a Snap Back to Resistance?XAUUSD – Game of Patience: Awaiting the BreakDown or a Snap Back to Resistance? | MMFlow Trading
1. Market Context
The week opened with a sharp sell-off in Gold — driven by profit-taking and stop-loss hunting on late-week FOMO BUY positions.
Buying momentum is fading, while sellers are lurking at the ascending channel’s support.
Price is currently reacting at KeyLevel 336x–337x, with H1 candles showing lower wicks → signs of indecision.
2. Technical Outlook
Overall structure: Still within an H1-H4 uptrend channel, but BUY momentum is weakening.
No clear SELL confirmation yet → need a BreakDown from the channel to confirm seller dominance.
Scenario 1: Break the channel → target 335x & 333x zones.
Scenario 2: No break → price may rebound to retest 339x – 340x – 342x resistance levels.
3. Fundamental & Macro View
This week brings major USD economic data: CPI & PPI.
Forecasts lean positive for USD, which could increase downward pressure on Gold.
However, expect false breakouts before/after news releases — risk management is key.
4. MMFlow Trading Plan
BUY SCALP
Entry: 3353 – 3351
SL: 3345
TP: 3358 – 3362 – 3366 – 3370 – 3375 – 3380
BUY ZONE
Entry: 3332 – 3330
SL: 3325
TP: 3336 – 3340 – 3345 – 3350 – 3360 – 3370 – 3380
SELL SCALP
Entry: 3394 – 3396
SL: 3400
TP: 3390 – 3385 – 3380 – 3370 – 3360
SELL ZONE
Entry: 3425 – 3427
SL: 3430
TP: 3420 – 3415 – 3410 – 3405 – 3400 – 3390 – 3380
5. Risk Management
Avoid FOMO — wait for clear candle confirmations before entering.
Reduce position size ahead of CPI/PPI events.
Focus on pre-defined key levels, avoid trading in noise zones.

Part11 Trading Master ClassRatio Spread
When to Use: Expect limited move in one direction.
How It Works: Buy 1 option, sell multiple options at different strikes.
Risk: Unlimited on one side if not hedged.
Diagonal Spread
When to Use: Expect gradual move over time.
How It Works: Buy long-term option at one strike, sell short-term option at different strike.
Risk Management in Options
Even though options can limit loss, traders often misuse them and blow accounts.
Key risk tips:
Never risk more than 2–3% of capital on one trade.
Understand implied volatility — high IV inflates premiums.
Avoid selling naked options without sufficient margin.
Always set stop-loss rules.

Part12 Trading Master ClassAdvanced Options Strategies
Butterfly Spread
When to Use: Expect stock to stay near a specific price.
How It Works: Buy 1 ITM option, sell 2 ATM options, buy 1 OTM option.
Risk: Limited.
Reward: Highest if stock ends at middle strike.
Example: Stock ₹100, buy call ₹95, sell 2 calls ₹100, buy call ₹105.
Calendar Spread
When to Use: Expect low short-term volatility but possible long-term move.
How It Works: Sell short-term option, buy long-term option at same strike.
Risk: Limited to net premium.
Reward: Comes from time decay of short option.

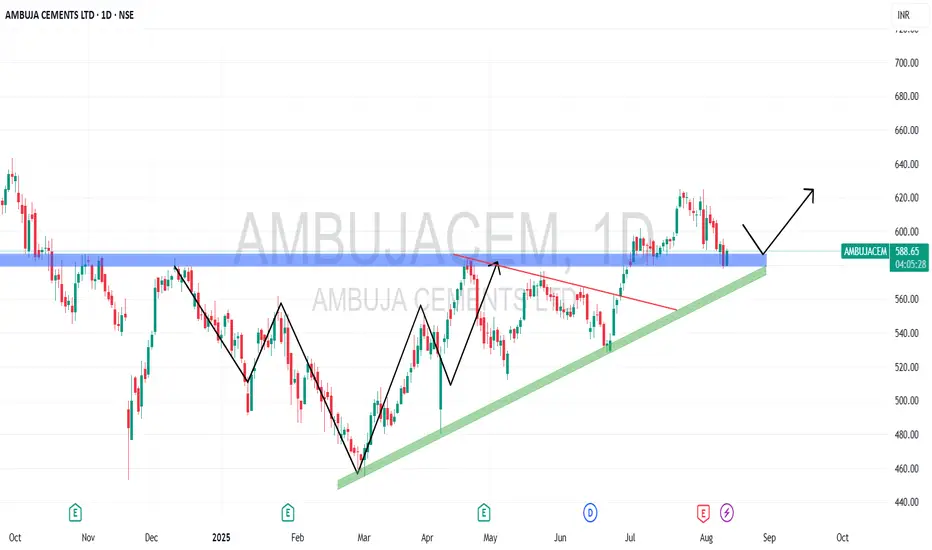
Ambuja Cements – Breakout on Record FY25 Performance📈Technical Analysis
Over the last decade, Ambuja steadily climbed from below ₹50 to peak around ₹700 by mid-2024, before slipping to ₹450.
Since then, it formed higher lows and faced resistance around ₹580. With strong FY25 results, it convincingly broke above ₹580, climbed to ₹620, and is now retesting that level.
If ₹580 holds as support with bullish candle confirmation, the next upside targets are:
🎯Target 1: ₹620
🎯Target 2: ₹650
🎯Target 3: ₹680–700
Stop Loss: Below ₹560. If it fails to act as support, the bullish thesis is negated.
💰FY25 Financial Highlights (vs FY24 & FY23)
Total Income: ₹35,045 Cr (↑ +6% vs ₹33,160 Cr; ↓ –10% vs ₹38,937 Cr)
Total Expenses: ₹29,074 Cr (↑ +9% vs ₹26,760 Cr; ↓ –14% vs ₹33,815 Cr)
Financing Profit: ₹5,971 Cr (↓ –7% vs ₹6,400 Cr; ↑ +17% vs ₹5,122 Cr)
Profit Before Tax: ₹5,922 Cr (↑ +0.4% vs ₹5,896 Cr; ↑ +59% vs ₹3,729 Cr)
Profit After Tax: ₹5,158 Cr (↑ +9% vs ₹4,735 Cr; ↑ +70% vs ₹3,024 Cr)
Diluted EPS: ₹16.92 (↑ from ₹16.26; ↑ from ₹13.01)
Key Takeaway: Ambuja delivered its highest-ever annual PAT of ₹5,158 Cr, complemented by record volumes (65.2 MT) and operational efficiencies. The company also crossed 100 MTPA cement capacity, establishing a strong foundation for future growth.
🧠Fundamental Analysis
Outstanding Q1 FY26 Performance
Ambuja delivered a substantial 24% YoY increase in net profit, posting ₹970 crore pushed by record quarterly sales and strong operational efficiency
Cost and Margin Improvements
EBITDA reached an all-time high of ₹1,961 crore with margins expanding to 19.1%, supported by better pricing and cost optimization
Bottom Line
Ambuja Cements has broken a long-term resistance level at ₹580, supported by stellar FY25 performance. A successful retest could propel the stock towards ₹700. Watch near-term support closely—break below ₹560 could derail the bullish setup.
Disclaimer: lnkd.in