Pressured Below 4050$ as Bears Target the 4,000$ Liquidity BreakGold continues to trade under heavy selling pressure, staying capped beneath 4,050$ and hovering just above the major liquidity floor at 4,000$.
With fading expectations for a December Fed cut and cautious global sentiment, buyers remain defensive while sellers maintain structural control.
📊 Technical Outlook (H1)
Price remains inside a tight 4,053$ → 4,000$ distribution zone, with the descending trendline keeping gold suppressed.
The POC around 4,053$ is acting as a firm ceiling; every retest so far has been rejected.
Fibonacci projections from the last drop highlight two major downside liquidity zones:
3,945$ → first liquidity cluster
3,876$ → deeper extension and key demand
Current structure resembles a bear flag, hinting that the market may be preparing for another downside expansion.
🎯 Key Scenarios
1️⃣ Bearish Breakdown (Primary Scenario)
If gold loses 4,000$, expect momentum to accelerate into:
3,945$
3,876$
This remains the most probable path while price holds below 4,053$.
2️⃣ Liquidity Sweep → Short-Covering Bounce
If price sweeps 3,945$ and forms bullish rejection wicks:
A relief bounce could develop back toward 4,000$,
Then 4,053$ (POC)
And possibly 4,098$ if buyers gain traction.
Still a corrective move unless bulls reclaim the upper structure.
❌ Invalidation (Bearish Bias Weakens)
H4 acceptance above 4,098$
→ would shift the narrative and force a reassessment of trend direction.
⚜️ MMFLOW TRADING Insight
Gold is still trading below value and below the trendline — this is not a bullish environment yet.
The market must either break 4,000$ or reclaim 4,053$–4,098$ before any stronger directional conviction returns.
“Let the market show its hand. In a downtrend, weak rallies are opportunities — not reversals.”
Fundamental Analysis

LiamTrading – XAUUSD H1 | Gold on a downward trend, hitting ...💛 LiamTrading – XAUUSD H1 | Gold on a downward trend, hitting strong support around 4005 🎯
Gold has plunged from its peak, currently “visiting” the 4005–3990 zone, where trendline + POC/OB + high liquidity converge. This is a zone where a technical rebound might occur, but the short-term trend remains bearish, so any BUY orders need to wait for clear confirmation.
🔍 Fundamental Analysis
Goldman Sachs forecasts that during 2025–2026, central banks will purchase an average of ~80 tons of gold per month, a significant driver that could push gold towards 4,900 USD/oz by the end of 2026.
This keeps the long-term trend of gold bullish, but in the short term, deep corrections like the current one are normal to “shake off” positions before big money returns.
📊 Technical Analysis
Current trend:
H1 is still in a short-term downtrend phase (lower high – lower low), with prices below the 4080–4100 resistance zone and below the nearest descending trendline.
Main support zones:
4005–3990: intersection of long-term rising trendline, POC – OB, old VAH/VAL zone → crucial support, potential for bottom-fishing buying force.
3975–3977: deeper support, coinciding with liquidity zone & recent low.
Key resistance zones:
4098–4100: confluence of resistance + trendline test → ideal zone to watch for SELL retracement.
Above is the cluster 4011 – 4053 – 4077 – 4098–4100 acting like “steps” for scalping orders.
Volume Profile:
Heavy trading volume around the 4000–4020 zone → prices tend to revisit this area multiple times before moving away.
🎯 Reference Trading Scenarios
SELL – following the downtrend (priority)
Entry: 4098–4100
SL: 4105
TP: 4082 → 4060 → 4035 → 4012
Price retraces to resistance + descending trendline.
Only trigger when M15–H1 shows clear rejection candles (pin bar/bearish engulfing) around 4098–4100.
BUY – catching the rebound at strong support
Entry: 3975–3977
SL: 3970
TP: 3995 → 4025 → 4050 → 4080
Confluence support zone at channel bottom + POC/OB + liquidity.
Only BUY when there is strong rejection or a clear reversal pattern (M15–H1).
⚠️ Price zones to watch for scalping
4011 – 4053 – 4077 – 3939
These zones are suitable for short scalps, prioritising the main trend (currently bearish), quick exits – do not hold positions too long.
🧠 Risks & Invalidations
H1 closes above 4105 → reduces SELL priority, wait for new structure.
H1 closes below 3970 → bad structure for BUY side, potential for further decline to lower zones.
Are you watching to BUY or SELL gold in this zone?
👉 Comment your perspective & Follow LiamTrading channel for daily XAUUSD plans.

LICI 1 Week View 🔢 Current status
The stock is currently trading around ₹ 911 on the NSE.
Day-range recently: approx ₹ 906.60 to ₹ 920.60.
52-week range: approx ₹ 715.30 to ₹ 1,007.80.
📉 Key levels to watch for the coming week
Support zone: Roughly around ₹ 895-₹ 900 — the recent trading floor is around that area.
Resistance zone: Near ₹ 920-₹ 930 — this is where the recent high end of the day‐ranges have been.
If price breaks above ~₹ 930 with strength, that could open a move toward ~₹ 950 in the short term (assuming favourable market context).
If price falls below ~₹ 895, risk of a slip toward ~₹ 880 or lower until a new base is found.
⚠️ What to Watch / Risks
The 1-week gain is modest; there’s no strong breakout yet.
If broader market or sector weakens (insurance/financials), LICI could get caught in the drift.
Watch news / earnings triggers that could suddenly shift sentiment.
📝 Disclaimer
This is not a recommendation to buy or sell. Viewing over just one week is very short‐term and subject to high uncertainty. Please consider your own risk profile and possibly consult a financial advisor.

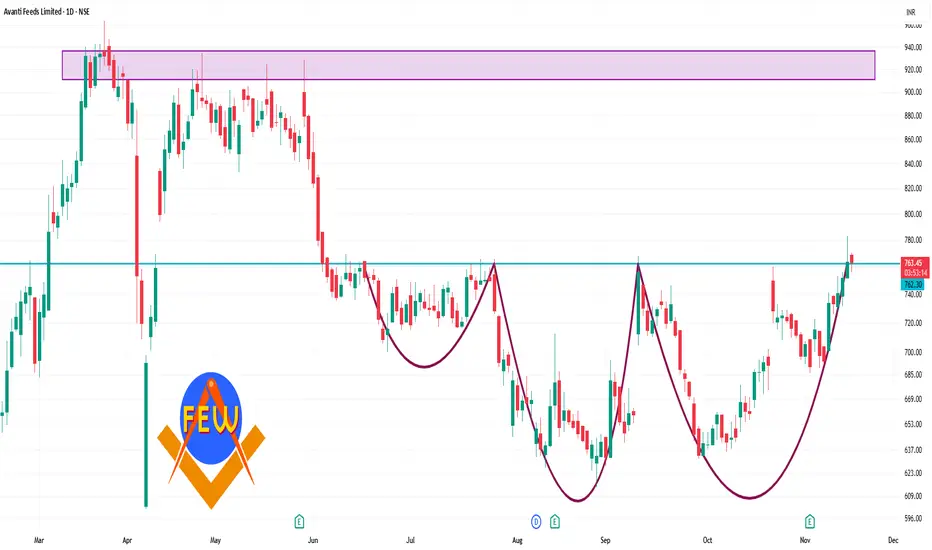
AVANTIFEED 1 Day Time Frame 🔍 Key Levels
Pivot (Daily): ~ ₹ 746.47
Resistance levels:
R1 ~ ₹ 761.48
R2 ~ ₹ 770.92
R3 ~ ₹ 785.93
Support levels:
S1 ~ ₹ 737.03
S2 ~ ₹ 722.02
S3 ~ ₹ 712.58
✅ Interpretation & Use
If price holds above ~₹ 746.47 and shows strength, the next meaningful resistance zone is ~ ₹ 761-771.
If price drops below the pivot, then supports around ~ ₹ 737, and further down ~ ₹ 722 or ~ ₹ 712 become relevant.
The momentum indicators (RSI ~67.6, MACD positive) suggest bullish bias but note: when RSI gets high → risk of pull-back increases.
Usdchf bearish sell
💧USD/CHF – Bearish Bias News Summary
📍SNB cut rates to 0%, signaling more easing ahead → CHF stays fundamentally strong.
📍UBS forecasts USD/CHF lower, expecting continued franc strength.
📍Weak U.S. data increases Fed cut expectations → pressure on USD.
📍Swiss sentiment weak, but SNB still ready to intervene if needed.
🔴🔴🔴Bias: Sell rallies toward premium zones.

XAUUSD – TWO MAIN SCENARIOS FOR THE DAY: MONITOR REACTION AT...💛 XAUUSD – TWO MAIN SCENARIOS FOR THE DAY: MONITOR REACTION AT TRENDLINE 🎯
🌤 1. Overview
Hello everyone 💬
Gold is currently waiting at the H4 trendline, indicating the market is lacking volume to decide the next direction.
Although the price is adjusting after the drop from the 4,400 USD zone, the larger trend is still supported by strong buying flows from central banks.
💹 Market Context
According to Goldman Sachs, the current decline is only temporary, as the demand for gold as a safe haven asset remains strong:
US bond yields are falling
USD is weakening
The US economy is under pressure from unemployment and inflation
In September alone, central banks purchased 64 tonnes of gold, and forecasts suggest that November may continue this strong accumulation trend.
💹 Technical Analysis
📉 If Gold breaks below the trendline → the market will trigger strong selling pressure, pulling back to the 395x zone, where there is low liquidity and important support.
📈 Conversely, if the price holds the trendline and volume pushes up, a short-term upward structure will form.
📌 The 4068 zone is a key level — if the price retests this area and falls back, Buy will only activate when it reaches 4034.
🎯 Reference Trading Scenarios
🔻 SELL – When breaking the trendline (priority if volume is strong)
Sell 4036–4038 │ SL: 4044
TP: 4010 → 3995 → 3970 → 3945
🔹 BUY – Strong support 395x
Buy 3952–3954 │ SL: 3957
TP: 3975 → 3995 → 4030
🔸 BUY maintaining trend (if price rebounds at 4068)
Buy at 4034 after confirmation signal
⚠️ Important Note
Volume is currently low, making the market prone to stop sweeps, so enter orders with small volume.
The larger trend is still supported by flows from central banks, but in the short term, Gold may fluctuate strongly around the trendline.
Prioritize trading based on price reactions at key zones rather than predicting direction in advance.
🌷Gold is in a sensitive phase at the H4 trendline 💛
If you find this useful, please 💛 Like – 💬 Comment – 🔔 Follow LanaM2 to receive daily gold analysis ✨

Marico: Post-Results Rally Tests Resistance ZoneTechnical Analysis
Marico Limited showcases an impressive wealth creation journey spanning two decades. The stock has delivered a super bullish rally from less than ₹12 to reaching ₹720 by 2024 - representing an extraordinary 60x growth over 20 years.
Since 2024, the ₹720-₹760 zone has acted as formidable resistance, tested multiple times without a decisive breakout. On November 14, 2025, the company announced its Q2 FY26 results. Responding to positive sales numbers showing 31% revenue growth, the stock shot up 2% and is now trading at ₹739.
Currently positioned near the upper end of the resistance zone, the stock is attempting another breakout. A decisive break above ₹760 with strong volume confirmation would signal the next major rally phase.
Entry Strategy: Wait for confirmed breakout above ₹760 with volume before initiating fresh positions.
Targets:
Target 1: ₹780
Target 2: ₹800
Target 3: ₹820
Risk Assessment:
No significant bullish expectations below the ₹720-₹760 resistance zone.
💰Q2 FY26 Financial Highlights (vs Q1 FY26 & Q2 FY25)
Total Income: ₹3,482 Cr (↑ +7% QoQ from ₹3,259 Cr; ↑ +31% YoY from ₹2,664 Cr)
Total Expenses: ₹2,922 Cr (↑ +12% QoQ from ₹2,604 Cr; ↑ +36% YoY from ₹2,142 Cr)
Operating Profit: ₹560 Cr (↓ -15% QoQ from ₹655 Cr; ↑ +7% YoY from ₹522 Cr)
Profit Before Tax: ₹550 Cr (↓ -16% QoQ from ₹656 Cr; ↓ -0.4% YoY from ₹552 Cr)
Profit After Tax: ₹432 Cr (↓ -16% QoQ from ₹513 Cr; ↓ -0.2% YoY from ₹433 Cr)
Diluted EPS: ₹3.24 (↓ -17% QoQ from ₹3.89; ↓ -0.9% YoY from ₹3.27)
Fundamental Highlights
Marico delivered stellar Q2 FY26 performance with consolidated revenue soaring 31% YoY to ₹3,482 crore - the highest growth in 17 quarters. The company achieved underlying volume growth of 7% in India business and robust 20% constant currency growth in international markets, despite margin pressures from input cost inflation.
India business revenue jumped 35% YoY to ₹2,667 crore, aided by strategic price hikes in core portfolios. Digital-first premium personal care portfolio (Beardo, Just Herbs, Plix) crossed ₹1,000 crore annualized run rate, while foods portfolio grew 12% crossing ₹1,100 crore ARR with Saffola Oats retaining number one position.
Despite input cost pressures causing 810 bps gross margin contraction, the company increased brand investments with A&P spend rising 19% to ₹345 crore. EBITDA grew 7% to ₹560 crore with margins at 16.1%. Over 95% of portfolio gained or sustained market share while 75% strengthened penetration.
International business recorded 20% CCG with Bangladesh up 22%, MENA 27%, and newer countries/exports surging 53%. Rural demand outpaced urban 2x, with CEO Saugata Gupta confirming company is "on track for full-year aspirations" targeting revenue growth in thirties and 18%+ EBITDA margins in H2.
Avendus retained Buy rating with ₹832 target (raised from ₹810), while Motilal Oswal maintained Buy at ₹825 target. The stock gained 15% YTD outperforming Nifty FMCG's 10%. GST rate rationalization expected to benefit nearly 30% of portfolio, with strategic focus on digital acceleration (20% sales target by FY27) and sustainability initiatives.
Conclusion
Marico's impressive 20-year journey from sub-₹12 to ₹720, backed by stellar Q2 FY26 showing highest revenue growth in 17 quarters at 31%, validates the FMCG leadership thesis despite flat PAT. Post-results 2% rally to ₹739 tests critical ₹720-₹760 resistance zone. Digital-first portfolio crossing ₹1,000 crore ARR, foods at ₹1,100 crore ARR, and 20% international CCG demonstrate diversified growth engines. Rural outpacing urban 2x and 95% portfolio gaining market share provide strong momentum. Breakout above ₹760 could trigger rally toward ₹820 levels with analyst targets at ₹825-₹832 supporting upside potential.
Disclaimer: aliceblueonline.com

Muthoot Finance: Record 10% Surge After Stellar Q2🔍Technical Analysis
Muthoot Finance Limited showcases one of the most impressive wealth creation stories spanning over a decade. The stock has delivered a super bullish rally from less than ₹100 to reaching ₹3,400 by November 13, 2025 - representing an extraordinary 34x growth in just over 10 years.
On the evening of November 13, 2025, the company announced its Q2 FY26 results which exceeded market expectations significantly. The market's immediate response was spectacular - the very next day on November 14, the stock shot up 10% and closed at ₹3,725, hitting an all-time high of ₹3,755 during intraday trading.
This powerful breakout from ₹3,400 to ₹3,725 demonstrates strong institutional and retail buying interest, fueled by robust fundamentals and exceptional financial performance. The stock has now entered uncharted territory with strong momentum.
Entry Strategy: Current levels offer opportunity with strong momentum. Consider accumulation on minor dips.
Targets:
Target 1: ₹3,800
Target 2: ₹3,900
Target 3: ₹4,000
Risk Assessment:
No expectations below ₹3,400 level, which now acts as strong support post-breakout.
💰Q2 FY26 Financial Highlights (vs Q1 FY26 & Q2 FY25)
Total Income: ₹7,283 Cr (↑ +13% QoQ from ₹6,450 Cr; ↑ +48% YoY from ₹4,929 Cr)
Total Expenses: ₹2,571 Cr (↑ +9% QoQ from ₹2,355 Cr; ↑ +42% YoY from ₹1,807 Cr)
Operating Profit: ₹3,232 Cr (↑ +22% QoQ from ₹2,654 Cr; ↑ +80% YoY from ₹1,798 Cr)
Profit Before Tax: ₹3,244 Cr (↑ +22% QoQ from ₹2,654 Cr; ↑ +80% YoY from ₹1,802 Cr)
Profit After Tax: ₹2,412 Cr (↑ +22% QoQ from ₹1,974 Cr; ↑ +83% YoY from ₹1,321 Cr)
Diluted EPS: ₹60.29 (↑ +20% QoQ from ₹50.22; ↑ +90% YoY from ₹31.67)
🧠Fundamental Highlights
Muthoot Finance delivered spectacular Q2 FY26 performance with standalone PAT surging 87% YoY to ₹2,345 crore and total income jumping 56.5% to ₹6,461 crore, driven by robust gold loan demand amid soaring gold prices. The company achieved highest-ever loan AUM of ₹1,47,673 crore (up 42% YoY) and gold loan AUM of ₹1,24,918 crore (up 45% YoY).
Net interest income (NII) rose impressive 58.5% YoY to ₹3,992 crore, driven by continued momentum in core gold loan segment and steady borrower activity. Net interest margin expanded significantly to 12.66% from 11.5% in Q2 FY25, indicating superior interest income growth and efficient capital deployment.
Gold loan AUM increased by ₹11,723 crore during Q2 FY26, registering 10% quarterly growth. Gold prices rallying over 40% in 2025 boosted customer confidence and loan demand. The board approved incremental fundraising up to ₹35,000 crore through NCDs and ₹500 crore equity infusion in subsidiary Muthoot Money Limited.
Asset quality showed remarkable improvement with Stage III loan assets declining to 2.25% from 4.3% YoY, while Stage II assets improved from ₹1,203 crore to ₹534 crore. Management upgraded AUM guidance to 30-35% growth, signaling high confidence in sustaining momentum through FY26.
Multiple brokerages turned bullish post-results: Nuvama raised target to ₹4,000 (from ₹2,993) maintaining Buy rating, Motilal Oswal increased target to ₹3,800 with Neutral rating, while Bernstein maintained Outperform at ₹3,400 citing 25% AUM CAGR potential over FY25-27E with 36% EPS CAGR and 24%+ ROE.
Conclusion
Muthoot Finance's remarkable decade-long journey from sub-₹100 to ₹3,755 all-time high, backed by exceptional Q2 FY26 showing 83% PAT growth and 48% revenue surge, validates the gold loan leadership thesis. Post-results 10% surge to ₹3,725 demonstrates strong market confidence. Highest-ever AUM at ₹1,47,673 crore, NIM expansion to 12.66%, and asset quality improvement with 2.25% Stage III loans showcase operational excellence. Management's upgraded 30-35% AUM guidance and brokerage targets at ₹3,800-₹4,000 support bullish outlook. Gold price tailwinds and digital transformation initiatives provide sustained growth visibility toward ₹4,000 target.
Disclaimer: aliceblueonline.com

Titan Company: Supply Zone Test After Strong Q2Technical Analysis
Titan Company Limited showcases one of India's most spectacular wealth creation stories spanning over two decades. The stock has delivered a super bullish rally from less than ₹2 to reaching ₹3,886 in January 2024 - representing an extraordinary 1,900x+ growth over 20+ years.
The ₹3,886 level established in January 2024 has acted as formidable resistance multiple times. During the resistance phase, the stock corrected to ₹2,925 before regaining momentum. With strong Q2 FY26 performance providing fundamental support, the stock has climbed back to ₹3,877 and is now facing the resistance zone again.
The critical supply zone of ₹3,800-₹3,900 is being tested once more. A decisive breakout above this zone with strong volume confirmation would signal the next major leg of the rally. Currently trading near this resistance, the stock awaits the catalyst for a breakout.
Entry Strategy: Wait for confirmed breakout above ₹3,900 with strong volume before initiating positions.
Targets:
Target 1: ₹4,000
Target 2: ₹4,100
Target 3: ₹4,200
Risk Assessment:
Not expecting significant bullish moves below the ₹3,800-₹3,900 supply zone.
Q2 FY26 Financial Highlights (vs Q1 FY26 & Q2 FY25)
Total Income: ₹18,725 Cr (↑ +13% QoQ from ₹16,523 Cr; ↑ +29% YoY from ₹14,534 Cr)
Total Expenses: ₹16,850 Cr (↑ +15% QoQ from ₹14,693 Cr; ↑ +27% YoY from ₹13,298 Cr)
Operating Profit: ₹1,875 Cr (↑ +2% QoQ from ₹1,830 Cr; ↑ +52% YoY from ₹1,236 Cr)
Profit Before Tax: ₹1,522 Cr (↑ +3% QoQ from ₹1,480 Cr; ↑ +61% YoY from ₹948 Cr)
Profit After Tax: ₹1,120 Cr (↑ +3% QoQ from ₹1,091 Cr; ↑ +59% YoY from ₹704 Cr)
Diluted EPS: ₹12.62 (↑ +3% QoQ from ₹12.29; ↑ +59% YoY from ₹7.93)
Fundamental Highlights
Titan Company delivered spectacular Q2 FY26 performance with consolidated PAT surging 59% YoY to ₹1,120 crore and revenue jumping 28.5% to ₹18,837 crore, driven by robust festive demand and strategic expansion. EBITDA rose 46.3% YoY to ₹1,987 crore with margins improving 209 bps to 12.1%.
Jewellery division remained the crown jewel with revenue growing 21% YoY to ₹14,092 crore. Domestic brands Tanishq, Mia, and Zoya grew 18% despite high gold prices, while CaratLane delivered exceptional 32% YoY growth. International jewellery business nearly doubled, surging 86% YoY to ₹561 crore, demonstrating successful global expansion.
The company expanded retail presence by adding 55 new stores in Q2, bringing total store count to 3,377 stores as of September 2025. Watches segment grew 12% with analogue watches up 17%, while emerging businesses including fragrances and bags surged 37% YoY.
Strategic initiatives included gold exchange campaigns, lower carat offerings, and retail expansion to combat high gold price challenges. Studded jewellery grew in mid-teens with double-digit like-for-like growth for both Tanishq and CaratLane, showing strength beyond store expansion.
Titan announced plans to acquire 67% stake in Dubai-based Damas Jewellery for international expansion across GCC countries. The company targets 40 new Tanishq store openings this year and maintains optimistic outlook for double-digit growth driven by festive momentum and premiumization strategy.
Conclusion
Titan's remarkable 20+ year journey from sub-₹2 to ₹3,886, backed by exceptional Q2 FY26 showing 59% PAT growth and 29% revenue surge, validates the premium valuation thesis. The critical ₹3,800-₹3,900 supply zone breakout with volume confirmation could trigger rally toward ₹4,200 levels. Jewellery division's 21% growth despite high gold prices, CaratLane's 32% surge, and 86% international business growth demonstrate operational excellence. Damas acquisition and 3,377 store network provide strong growth visibility. Stock trading at ₹3,877 awaits breakout catalyst for next leg upward.
Disclaimer: aliceblueonline.com

Tata Steel: Resistance Test Awaits Q2 CatalystTechnical Analysis
Tata Steel Limited has demonstrated a strong bullish rally spanning three decades, establishing itself as a blue-chip steel sector leader. Over the past year, the stock has been facing persistent resistance in the ₹184-₹187 zone, tested multiple times without a decisive breakout.
Currently trading at ₹181, the stock is positioned just below this critical resistance zone. Interestingly, while quarterly revenue shows a slight drop both QoQ and YoY, EPS has demonstrated positive growth - indicating improved profitability and operational efficiency despite revenue headwinds.
The Q2 FY26 results scheduled for announcement day after tomorrow (November 12, 2025) serve as a crucial catalyst. Positive results could provide the fundamental support needed to break through the stubborn ₹184-₹187 resistance zone and trigger the next leg of the rally.
Entry Strategy: Wait for Q2 results and breakout confirmation above ₹187 before initiating positions.
🎯Targets:
Target 1: ₹190
Target 2: ₹195
Target 3: ₹200
Risk Assessment:
If resistance is not taken out post Q2 results, no more expectations on this stock.
💰Q1 FY26 Financial Highlights (vs Q4 FY25 & Q1 FY25)
Total Income: ₹53,178 Cr (↓ -5% QoQ from ₹56,218 Cr; ↓ -3% YoY from ₹54,771 Cr)
Total Expenses: ₹45,751 Cr (↓ -8% QoQ from ₹49,659 Cr; ↓ -5% YoY from ₹48,077 Cr)
Operating Profit: ₹7,428 Cr (↑ +13% QoQ from ₹6,559 Cr; ↑ +11% YoY from ₹6,694 Cr)
Profit Before Tax: ₹3,067 Cr (↑ +39% QoQ from ₹2,200 Cr; ↑ +29% YoY from ₹2,377 Cr)
Profit After Tax: ₹2,007 Cr (↑ +67% QoQ from ₹1,201 Cr; ↑ +118% YoY from ₹919 Cr)
Diluted EPS: ₹1.66 (↑ +60% QoQ from ₹1.04; ↑ +116% YoY from ₹0.77)
🧠Fundamental Highlights
Tata Steel delivered exceptional Q1 FY26 performance with PAT surging 118% YoY to ₹2,007 crore despite 3% revenue decline, showcasing remarkable operational efficiency. The company reported strong Q2 FY26 operational data with crude steel production reaching 5.67 million tons (up 8% QoQ and 7% YoY).
Q2 FY26 domestic deliveries grew robustly by 20% QoQ and 7% YoY to 5.56 million tons, driven by normalized operations post G Blast Furnace relining at Jamshedpur. Branded Products & Retail vertical achieved best-ever quarterly volumes of approximately 1.9 million tons, demonstrating strong retail demand.
Market cap stands at ₹2,23,766 crore with the stock delivering impressive returns: up 5.8% in one month, 20% in three months, 30% in six months, and 34% YTD. The company reported 7.3% YoY increase in operating profit for Q1 FY26 with EBITDA of ₹74,560 crore.
European operations showed turnaround with Netherlands reporting 1.67 million tons production and 1.54 million tons deliveries. UK operations targeting Q4 FY26 breakeven with Electric Arc Furnace project construction underway at Port Talbot, representing £1.25 billion decarbonization initiative.
JP Morgan maintains overweight rating with ₹180 price target (17% upside potential), while other brokerages project revenue/EBITDA growth CAGR of 8%/26% over FY25-27E. Steel prices anticipated to have bottomed out with China's stimulus measures expected to benefit the sector.
Conclusion
Tata Steel's three-decade bull run approaching critical ₹184-₹187 resistance zone, backed by exceptional Q1 FY26 showing 118% PAT surge and 116% EPS growth despite revenue decline. Strong Q2 operational data with 8% production growth and 20% delivery increase provide positive momentum ahead of November 12 results announcement. UK breakeven target by Q4 FY26 and European turnaround add to growth visibility. Stock trading at attractive 7.2x FY26E EV/EBITDA with analyst targets of ₹180 suggest 17% upside potential upon resistance breakout.
Disclaimer: aliceblueonline.com

WILL GOLD CONTINUE TO DROP?1. Market Context Yesterday, gold was almost in accumulation throughout the Asian–European session and only broke out strongly in the latter half of the US session.
After breaking out of the accumulation zone, the price dropped sharply around 4006 – a crucial key level – and surged strongly from there.
However, statements from FED members remain hawkish, affirming the stance of keeping interest rates high for longer and not considering rate cuts yet.
This creates
-Downward pressure on gold
-Cash flow leaning towards USD
------>>Market sentiment prioritises SELL on price recovery
➡️ Conclusion: Today, the main scenario remains SELL following the trend, BUY is only a secondary strategy & short scalp when reaching strong support.
🎯2. Today's Trading Scenario
(SL: 10 points TP 10 points. RR ratio:1-2/1:3/1:5)
🔻 Main SELL (priority)
SELL Zones:
4050 – 4055
4075 – 4080
4105 – 4110
🟦 Secondary BUY
BUY Zones:
3996 – 3994
3965 – 3960
3935 – 3930
3895 – 3890

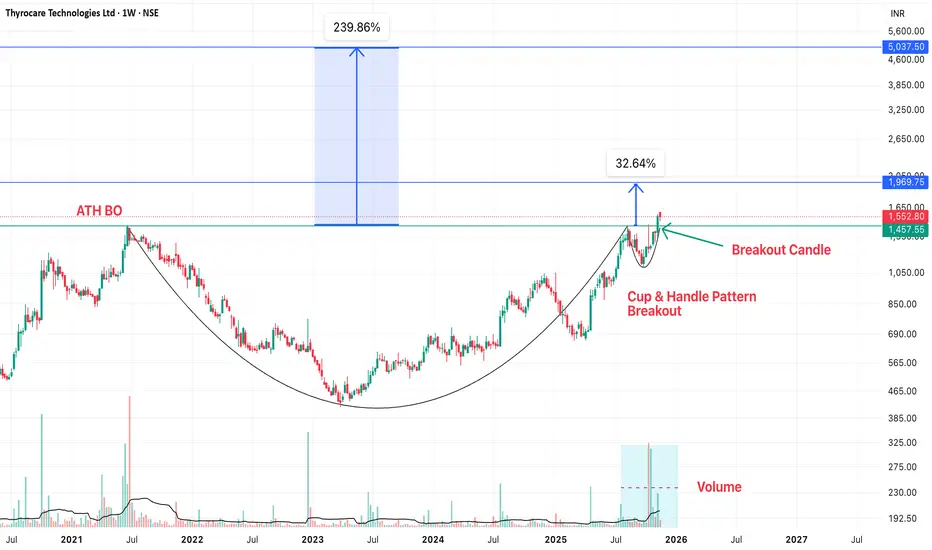
Thyrocare - Cup & Handle Breakout on Weekly Time FrameThyrocare has given a Cup & Handle Breakout on weekly time frame. Factors which will lead to 40%-200% return:
1. Cup & Handle breakout pattern
2. ATH Breakout
3. Volumes has picked up at Breakout
4. Fundamentally, super results in Q2 and best sales ever
Stock looks super fundamentally and technically. Must in your portfolio.
Keep following @Cleaneasycharts as we provide Right Stocks at Right Time at Right Price.
Cheers!!!
Triveni Turbine LtdDate 17.11.2025
Triveni Turbine
Timeframe : Day Chart
About
(1) Engaged in business of manufacturing and supply of power generating equipment and solutions
(2) Leading manufacturer of industrial steam turbines up to 100 MW
(3) Company has installed 6,000+ steam turbines across 80+ countries
Product Portfolio
(1) Industrial Steam Turbines
(2) Renewable Power Turbines
(3) Aftermarket Services
Market Position
(1) In the 30-100 MW market, Triveni is one of the top 3 solution providers
Revenue Bifurcation - Segment-wise
(1) Product Revenue: 66%
(2) Aftermarket Revenue: 34%
Geographical Revenue
(1) India - 53%
(2) Exports - 47%
Order Book
(1) As of 9M F-Y25, company has orders worth 1,800 Crs of which 65% of the orders are from the export market
Valuations
(1) Market Cap 17,075 Cr
(2) Stock Pe 50
(3) Roce 41%
(4) Roe 30%
(5) Book Value 13X
(6) Opm 22%
(7) PEG 1.17
(8) Promoter 55.84%
(9) Profit Growth (TTM) 9%
(10) Sales Growth 3.5% (YOY)
Regards,
Ankur Singh

Reading Fundamentals With TradingView – Reliance EditionWhen you look at a giant like Reliance, the price chart doesn’t tell the whole story.
But TradingView has a few simple fundamentals that help you understand what the company is actually doing behind the scenes.
You don’t need finance knowledge. Just a few basic ideas.
Below is a simple way to read each metric, and what Reliance’s chart is telling us right now.
1. Total Revenue — “How much money did the company make?”
What it means:
Revenue is the total money a company earns from all its businesses.
If it goes up → the company sold more.
If it goes down → business slowed.
Good side:
Growing revenue means customers are buying more.
It usually means demand is strong.
Bad side:
Falling revenue means something is not working — maybe prices dropped, or there was less demand.
What Reliance shows:
Reliance’s revenue jumps sharply in 2022 because oil prices were high and retail was growing fast.
In 2023 it dips — global petrochem prices cooled.
By 2024–25 it stabilizes again, showing that its telecom and retail arms are balancing out the ups and downs of the oil business.
2. Free Cash Flow — “How much cash is left after paying all bills?”
What it means:
If a company earns money but spends even more, free cash flow becomes negative.
If it earns more than it spends, free cash flow is positive.
Good side:
Positive FCF means the company can expand safely and pay debt.
Bad side:
Negative FCF means the company is spending heavily — sometimes for expansion, sometimes because of trouble.
What Reliance shows:
Reliance had deep negative FCF in 2021–23.
Not because it was in trouble — but because it was building things: Jio towers, fiber, retail stores, warehouses.
By 2024–25, FCF turns strong again.
That means: “Expansion phase slowing. Collection phase starting.”
3. Long-Term Debt — “How much money did the company borrow?”
What it means:
Companies borrow when they want to build something big.
Debt rising is not always bad — it depends on what they built.
Good side:
Debt used for growth is healthy.
If the company earns more than the interest it pays, it’s fine.
Bad side:
Debt becomes risky if profits fall or the company stops growing.
What Reliance shows:
Debt fell when Reliance sold stakes in Jio and Retail (Facebook, Google, etc.).
Then debt started rising again as new projects came in.
But margins and revenue stayed stable — so this is “growth borrowing,” not “trouble borrowing.”
4. Market Cap — “What is the company worth in the market?”
What it means:
This is simply the stock price × number of shares.
It shows what investors think the whole company is worth.
Good side:
Market cap rising usually means investors believe the company has a strong future.
Bad side:
If market cap falls even when revenue rises, investors are unsure or waiting.
What Reliance shows:
Market cap went sideways for a long period — not crashing, not flying.
This usually means investors are waiting for the next big chapter (like green energy or retail listing).
5. P/E Ratio — “How much are people willing to pay for ₹1 of profit?”
What it means:
A high P/E means investors expect big growth.
A low P/E means investors are cautious.
Good side:
High P/E = people believe in the company.
Bad side:
Too high P/E = expectations are unrealistic.
What Reliance shows:
P/E around 24 means Reliance is no longer being valued like an oil company.
Oil companies usually have single-digit P/E.
This P/E shows that the market sees Reliance as multiple businesses — telecom, retail, and energy — not just oil.
6. Operating Margin — “How much profit the company keeps after running the business?”
What it means:
This shows efficiency.
Higher margin = better.
Lower margin = costs are rising or competition is tough.
Good side:
Rising margins mean the business is getting stronger.
Bad side:
Falling margins mean costs are eating into profits.
What Reliance shows:
Margins stay around 11–12%.
That’s normal for Reliance because retail has lower margins, telecom has stable margins, and oil has volatile margins.
This mix keeps margins steady, not extreme.
7. ROCE — “Is the company using its money wisely?”
What it means:
ROCE tells you how well the company turns investments into profit.
Higher ROCE = efficient use of money.
Lower ROCE = new projects still warming up.
Good side:
Rising ROCE means the business is entering a stronger phase.
Bad side:
Falling ROCE may mean too much money is stuck in early-stage projects.
What Reliance shows:
ROCE around ~9–10% means Reliance is midway — not booming, not struggling.
As retail and Jio mature further, ROCE usually goes up.
Final thoughts
When you put all these together, Reliance becomes very easy to read:
Revenue shows the size of the engine
Free Cash Flow shows how much fuel is left
Debt shows how fast they’re expanding
Market cap shows what people believe
P/E shows expectations
Margins show efficiency
ROCE shows long-term strength
None of this is complicated.
TradingView already gives you everything — you just need to see each line for what it is.
Disclaimer
This analysis is for educational purposes only and does not constitute investment advice. Please do your own research (DYOR) before making any trading decisions.

Bullish sentiments on goldWe're in an uptrend so today we're trading from an h1 fvg targeting the opposite external liquidity....since London session we expect to see a continuation to the target.
XAU/USD TRADING PLAN 17/11/20251️⃣ CONTEXT
Last Friday saw a drop of ~200 points → confirming strong selling pressure.
No major news today, expected movement:
Wide sideways 4030–4120
Sell bias (priority to sell at high zones)
The major trend remains in a down channel, any rise is mainly for unloading.
2️⃣ GENERAL RULES
SL: 10 points for all trades
TP: 10 points for all trades
3️⃣ SELL ZONES (PRIMARY)
4120–4125
4146–4148
4160–4165
4182–4185
4210–4215 (strongest resistance of the day)
4️⃣ BUY ZONES (RETRACEMENT)
4056–4050
4033–4030
3996–3994
3966
3888
5️⃣ SUMMARY
Bias: Sideways → priority to Sell.
Sell at resistance zones, Buy at strong support zones.
SL/TP adjusted according to RR ratio 1:1, 1:2
Pay attention to appropriate volume

LiamTrading – XAUUSD H1 | Continue to watch for SELL at the ...LiamTrading – XAUUSD H1 | Continue to watch for SELL at the start of the week – wait for price to retrace to the trendline & resistance for a perfect entry
Gold is experiencing a sharp decline amidst global market liquidity pressures. The simultaneous drop in gold, stocks, and Bitcoin indicates that capital is being withdrawn from risky assets and even safe havens, similar to tense periods like the 2008 crisis or the early 2020 pandemic. Investors are selling profitable assets to cover losses elsewhere.
In the long run, gold usually recovers sooner, but in the short term, the downtrend still prevails.
On H1, the price is below the descending trendline, under the 4100 resistance, and is moving in a clear Lower High – Lower Low structure. This is a good signal to continue prioritising SELL orders retracing to resistance.
🔍 Technical Analysis (Trendline • S/R • Fibonacci • Liquidity)
The descending trendline is the biggest barrier; each time the price hits the trendline, it is strongly rejected.
Main Resistance:
4098–4100: resistance area + confluence with the trendline.
4120–4130: stronger area if the price retraces deeply (close to Fibo 0.382).
Target Support:
4065: intermediate support – where the price has bounced slightly several times before.
4040 – 4025: large liquidity area – confluence with the H1 FVG bottom.
3985–3995: the end zone of the down wave if the selling force expands.
Liquidity Zone:
Many liquidity sweep bottoms continuously → indicates that the selling force still prevails.
The lower FVG area (around 4025–4040) is highly likely to be filled within the week.
📉 Trading Scenario (prioritise SELL retracement)
Scenario – SELL retracement to trendline + resistance (priority)
Entry: 4098–4100
SL: 4106
TP: 4088 → 4065 → 4040 → 4025
💡 Suggestion: Wait for M5–M15 to form a rejection candle (pin bar / bearish engulfing) before executing the order.
When to BUY?
Only BUY if:
H1 closes above 4120, breaking the descending trendline → short-term trend phase change.
If this signal is not present → do not rush to buy against the trend.
⚠️ Important Note
The phenomenon of “selling everything to hold cash” may continue → gold may remain under pressure in the short term.
Which price range are you watching for today's session?
Comment below & Follow LiamTrading channel for the fastest updates!

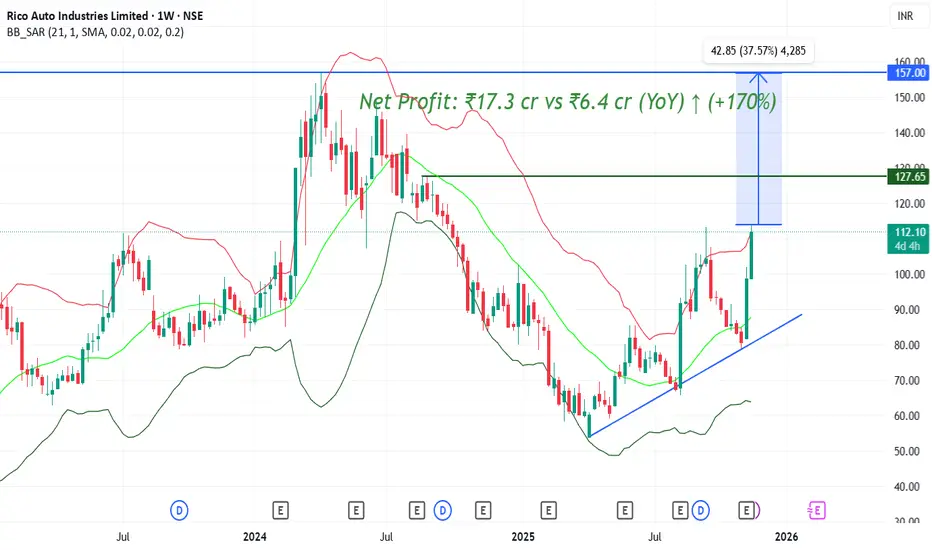
#RICOAUTO Expecting Big Result awesome expecting Big ..next level 127 after that long term 150+++
Net Profit: ₹17.3 cr vs ₹6.4 cr (YoY) ↑ (+170%)
Revenue: ₹627 cr vs ₹575 cr (YoY) ↑ (+9%)
Marico: Post-Results Rally Tests Resistance Zone🔍 Technical Analysis
Marico Limited showcases an impressive wealth creation journey spanning two decades. The stock has delivered a super bullish rally from less than ₹12 to reaching ₹720 by 2024 - representing an extraordinary 60x growth over 20 years.
Since 2024, the ₹720-₹760 zone has acted as formidable resistance, tested multiple times without a decisive breakout. On November 14, 2025, the company announced its Q2 FY26 results. Responding to positive sales numbers showing 31% revenue growth, the stock shot up 2% and is now trading at ₹739.
Currently positioned near the upper end of the resistance zone, the stock is attempting another breakout. A decisive break above ₹760 with strong volume confirmation would signal the next major rally phase.
Entry Strategy: Wait for confirmed breakout above ₹760 with volume before initiating fresh positions.
Targets:
Target 1: ₹780
Target 2: ₹800
Target 3: ₹820
Risk Assessment:
No significant bullish expectations below the ₹720-₹760 resistance zone.
💰 Q2 FY26 Financial Highlights (vs Q1 FY26 & Q2 FY25)
Total Income: ₹3,482 Cr (↑ +7% QoQ from ₹3,259 Cr; ↑ +31% YoY from ₹2,664 Cr)
Total Expenses: ₹2,922 Cr (↑ +12% QoQ from ₹2,604 Cr; ↑ +36% YoY from ₹2,142 Cr)
Operating Profit: ₹560 Cr (↓ -15% QoQ from ₹655 Cr; ↑ +7% YoY from ₹522 Cr)
Profit Before Tax: ₹550 Cr (↓ -16% QoQ from ₹656 Cr; ↓ -0.4% YoY from ₹552 Cr)
Profit After Tax: ₹432 Cr (↓ -16% QoQ from ₹513 Cr; ↓ -0.2% YoY from ₹433 Cr)
Diluted EPS: ₹3.24 (↓ -17% QoQ from ₹3.89; ↓ -0.9% YoY from ₹3.27)
🧠 Fundamental Highlights
Marico delivered stellar Q2 FY26 performance with consolidated revenue soaring 31% YoY to ₹3,482 crore - the highest growth in 17 quarters. The company achieved underlying volume growth of 7% in India business and robust 20% constant currency growth in international markets, despite margin pressures from input cost inflation.
India business revenue jumped 35% YoY to ₹2,667 crore, aided by strategic price hikes in core portfolios. Digital-first premium personal care portfolio (Beardo, Just Herbs, Plix) crossed ₹1,000 crore annualized run rate, while foods portfolio grew 12% crossing ₹1,100 crore ARR with Saffola Oats retaining number one position.
Despite input cost pressures causing 810 bps gross margin contraction, the company increased brand investments with A&P spend rising 19% to ₹345 crore. EBITDA grew 7% to ₹560 crore with margins at 16.1%. Over 95% of portfolio gained or sustained market share while 75% strengthened penetration.
International business recorded 20% CCG with Bangladesh up 22%, MENA 27%, and newer countries/exports surging 53%. Rural demand outpaced urban 2x, with CEO Saugata Gupta confirming company is "on track for full-year aspirations" targeting revenue growth in thirties and 18%+ EBITDA margins in H2.
Avendus retained Buy rating with ₹832 target (raised from ₹810), while Motilal Oswal maintained Buy at ₹825 target. The stock gained 15% YTD outperforming Nifty FMCG's 10%. GST rate rationalization expected to benefit nearly 30% of portfolio, with strategic focus on digital acceleration (20% sales target by FY27) and sustainability initiatives.
✅ Conclusion
Marico's impressive 20-year journey from sub-₹12 to ₹720, backed by stellar Q2 FY26 showing highest revenue growth in 17 quarters at 31%, validates the FMCG leadership thesis despite flat PAT. Post-results 2% rally to ₹739 tests critical ₹720-₹760 resistance zone. Digital-first portfolio crossing ₹1,000 crore ARR, foods at ₹1,100 crore ARR, and 20% international CCG demonstrate diversified growth engines. Rural outpacing urban 2x and 95% portfolio gaining market share provide strong momentum. Breakout above ₹760 could trigger rally toward ₹820 levels with analyst targets at ₹825-₹832 supporting upside potential.
Disclaimer: This analysis is for educational purposes only. Please consult your financial advisor before making investment decisions. Stock markets are subject to risks.

GOLD (XAU/USD): 2 Crucial Orders Before the NFP Storm!📉 Technical Analysis (SMC - 2H)
Trend: Decline after a clear MSS/BOS.
Focus: Price is retracing to the Selling Zone (Premium) to fill the FVG.
⚔️ Detailed Trading Plan (R:R > 1:2)
1. Priority Strategy: SELL Limit (Trend Following)
Entry: 4,157.782 (FVG Peak - Supply Zone)
Stop Loss (SL): 4,206.895 (Safe SL above the nearest structural peak)
Take Profit 2 (TP2): 4,051.733 (Main structural target - Nearest bottom)
Objective: Participate in the ongoing price decline.
2. Counter-trend Strategy: BUY Limit (Technical Rebound)
Entry: 4,051.733 (Nearest structural bottom - Support)
Stop Loss (SL): 4,018.699 (SL below lower FVG)
Take Profit 2 (TP2): 4,126.333 (Rebound to the upper FVG bottom)
Objective: Capitalise on the technical rebound from strong support.
🚨 Basic Risk: This Week's Focus
Hawkish Fed: Officials like Schmid assert high inflation, unwilling to ease policy, maintaining high interest rates (Negative for Gold).
Major News: FOMC Minutes (Wednesday) and especially NFP (Thursday) will determine the short-term momentum of USD/Gold.
Risk Management: Gold will be highly volatile from Wednesday. Adhere to SL and manage capital under 2% per order.
#Gold #XAUUSD #Forex #TechnicalAnalysis #FVG #SmartMoney #Fed #NFP #TradingView

Muthoot Finance: Record 10% Surge After Stellar Q2🔍 Technical Analysis
Muthoot Finance Limited showcases one of the most impressive wealth creation stories spanning over a decade. The stock has delivered a super bullish rally from less than ₹100 to reaching ₹3,400 by November 13, 2025 - representing an extraordinary 34x growth in just over 10 years.
On the evening of November 13, 2025, the company announced its Q2 FY26 results which exceeded market expectations significantly. The market's immediate response was spectacular - the very next day on November 14, the stock shot up 10% and closed at ₹3,725, hitting an all-time high of ₹3,755 during intraday trading.
This powerful breakout from ₹3,400 to ₹3,725 demonstrates strong institutional and retail buying interest, fueled by robust fundamentals and exceptional financial performance. The stock has now entered uncharted territory with strong momentum.
Entry Strategy: Current levels offer opportunity with strong momentum. Consider accumulation on minor dips.
Targets:
Target 1: ₹3,800
Target 2: ₹3,900
Target 3: ₹4,000
Risk Assessment:
No expectations below ₹3,400 level, which now acts as strong support post-breakout.
💰 Q2 FY26 Financial Highlights (vs Q1 FY26 & Q2 FY25)
Total Income: ₹7,283 Cr (↑ +13% QoQ from ₹6,450 Cr; ↑ +48% YoY from ₹4,929 Cr)
Total Expenses: ₹2,571 Cr (↑ +9% QoQ from ₹2,355 Cr; ↑ +42% YoY from ₹1,807 Cr)
Operating Profit: ₹3,232 Cr (↑ +22% QoQ from ₹2,654 Cr; ↑ +80% YoY from ₹1,798 Cr)
Profit Before Tax: ₹3,244 Cr (↑ +22% QoQ from ₹2,654 Cr; ↑ +80% YoY from ₹1,802 Cr)
Profit After Tax: ₹2,412 Cr (↑ +22% QoQ from ₹1,974 Cr; ↑ +83% YoY from ₹1,321 Cr)
Diluted EPS: ₹60.29 (↑ +20% QoQ from ₹50.22; ↑ +90% YoY from ₹31.67)
🧠 Fundamental Highlights
Muthoot Finance delivered spectacular Q2 FY26 performance with standalone PAT surging 87% YoY to ₹2,345 crore and total income jumping 56.5% to ₹6,461 crore, driven by robust gold loan demand amid soaring gold prices. The company achieved highest-ever loan AUM of ₹1,47,673 crore (up 42% YoY) and gold loan AUM of ₹1,24,918 crore (up 45% YoY).
Net interest income (NII) rose impressive 58.5% YoY to ₹3,992 crore, driven by continued momentum in core gold loan segment and steady borrower activity. Net interest margin expanded significantly to 12.66% from 11.5% in Q2 FY25, indicating superior interest income growth and efficient capital deployment.
Gold loan AUM increased by ₹11,723 crore during Q2 FY26, registering 10% quarterly growth. Gold prices rallying over 40% in 2025 boosted customer confidence and loan demand. The board approved incremental fundraising up to ₹35,000 crore through NCDs and ₹500 crore equity infusion in subsidiary Muthoot Money Limited.
Asset quality showed remarkable improvement with Stage III loan assets declining to 2.25% from 4.3% YoY, while Stage II assets improved from ₹1,203 crore to ₹534 crore. Management upgraded AUM guidance to 30-35% growth, signaling high confidence in sustaining momentum through FY26.
Multiple brokerages turned bullish post-results: Nuvama raised target to ₹4,000 (from ₹2,993) maintaining Buy rating, Motilal Oswal increased target to ₹3,800 with Neutral rating, while Bernstein maintained Outperform at ₹3,400 citing 25% AUM CAGR potential over FY25-27E with 36% EPS CAGR and 24%+ ROE.
✅ Conclusion
Muthoot Finance's remarkable decade-long journey from sub-₹100 to ₹3,755 all-time high, backed by exceptional Q2 FY26 showing 83% PAT growth and 48% revenue surge, validates the gold loan leadership thesis. Post-results 10% surge to ₹3,725 demonstrates strong market confidence. Highest-ever AUM at ₹1,47,673 crore, NIM expansion to 12.66%, and asset quality improvement with 2.25% Stage III loans showcase operational excellence. Management's upgraded 30-35% AUM guidance and brokerage targets at ₹3,800-₹4,000 support bullish outlook. Gold price tailwinds and digital transformation initiatives provide sustained growth visibility toward ₹4,000 target.
Disclaimer: This analysis is for educational purposes only. Please consult your financial advisor before making investment decisions. Stock markets are subject to risks.

XAUUSD – UPDATE ON SCENARIO AFTER WEEKLY OPEN💛 XAUUSD – UPDATE ON SCENARIO AFTER WEEKLY OPEN 🎯
🌤 Overview
Hello everyone 💬
Gold prices at the start of the week are mostly unchanged, the price structure on H4 remains the same, so Lana continues to maintain the old trading strategy.
Currently, gold is weakly reacting around the medium-term resistance area, not strong enough to break through – but also no clear reversal signals.
💹 Technical Analysis
📉 Prices are moving within a narrow range between key liquidity zones:
Zone 4138–4140 is the near resistance, where the market has repeatedly reacted with declines.
Zone 4200 coincides with confluence fibo + descending trendline – strong resistance.
Zone 3990–3988 is important support, also a lower liquidity area, suitable for technical rebound Buy.
Market liquidity is weak, as shown by the pin bars and narrowing range.
🎯 Reference Trading Plan
💢 SELL (priority on correction rhythm)
4138–4140 | SL: 4146 | TP: 4120 → 4105 → 4089
4200 | SL: 4212 | TP: 4185 → 4160 → 4133
💖 BUY (strong support)
3990–3988 | SL: 3984 | TP: 4002 → 4032 → 4060
⚠️ Market Insight (Macro Insight)
Gold declines simultaneously with US stocks and Bitcoin, indicating a lack of liquidity across the market.
This behaviour is common during phases like:
Financial Crisis 2008
Early pandemic panic 2020
Investors are forced to sell even profitable assets to cover losses, causing gold – despite being a safe haven asset – to also decline. This reflects a strong increase in cash demand and widespread fear.
🌷 Conclusion with LanaM2
Gold is moving within a tight range and is heavily dependent on liquidity 💛
If you find this useful, please 💛 Like – 💬 Comment – 🔔 Follow LanaM2 for daily gold analysis ✨

Titan Company: Supply Zone Test After Strong Q2 🔍 Technical Analysis
Titan Company Limited showcases one of India's most spectacular wealth creation stories spanning over two decades. The stock has delivered a super bullish rally from less than ₹2 to reaching ₹3,886 in January 2024 - representing an extraordinary 1,900x+ growth over 20+ years.
The ₹3,886 level established in January 2024 has acted as formidable resistance multiple times. During the resistance phase, the stock corrected to ₹2,925 before regaining momentum. With strong Q2 FY26 performance providing fundamental support, the stock has climbed back to ₹3,877 and is now facing the resistance zone again.
The critical supply zone of ₹3,800-₹3,900 is being tested once more. A decisive breakout above this zone with strong volume confirmation would signal the next major leg of the rally. Currently trading near this resistance, the stock awaits the catalyst for a breakout.
Entry Strategy: Wait for confirmed breakout above ₹3,900 with strong volume before initiating positions.
Targets:
Target 1: ₹4,000
Target 2: ₹4,100
Target 3: ₹4,200
Risk Assessment:
Not expecting significant bullish moves below the ₹3,800-₹3,900 supply zone.
💰 Q2 FY26 Financial Highlights (vs Q1 FY26 & Q2 FY25)
Total Income: ₹18,725 Cr (↑ +13% QoQ from ₹16,523 Cr; ↑ +29% YoY from ₹14,534 Cr)
Total Expenses: ₹16,850 Cr (↑ +15% QoQ from ₹14,693 Cr; ↑ +27% YoY from ₹13,298 Cr)
Operating Profit: ₹1,875 Cr (↑ +2% QoQ from ₹1,830 Cr; ↑ +52% YoY from ₹1,236 Cr)
Profit Before Tax: ₹1,522 Cr (↑ +3% QoQ from ₹1,480 Cr; ↑ +61% YoY from ₹948 Cr)
Profit After Tax: ₹1,120 Cr (↑ +3% QoQ from ₹1,091 Cr; ↑ +59% YoY from ₹704 Cr)
Diluted EPS: ₹12.62 (↑ +3% QoQ from ₹12.29; ↑ +59% YoY from ₹7.93)
🧠 Fundamental Highlights
Titan Company delivered spectacular Q2 FY26 performance with consolidated PAT surging 59% YoY to ₹1,120 crore and revenue jumping 28.5% to ₹18,837 crore, driven by robust festive demand and strategic expansion. EBITDA rose 46.3% YoY to ₹1,987 crore with margins improving 209 bps to 12.1%.
Jewellery division remained the crown jewel with revenue growing 21% YoY to ₹14,092 crore. Domestic brands Tanishq, Mia, and Zoya grew 18% despite high gold prices, while CaratLane delivered exceptional 32% YoY growth. International jewellery business nearly doubled, surging 86% YoY to ₹561 crore, demonstrating successful global expansion.
The company expanded retail presence by adding 55 new stores in Q2, bringing total store count to 3,377 stores as of September 2025. Watches segment grew 12% with analogue watches up 17%, while emerging businesses including fragrances and bags surged 37% YoY.
Strategic initiatives included gold exchange campaigns, lower carat offerings, and retail expansion to combat high gold price challenges. Studded jewellery grew in mid-teens with double-digit like-for-like growth for both Tanishq and CaratLane, showing strength beyond store expansion.
Titan announced plans to acquire 67% stake in Dubai-based Damas Jewellery for international expansion across GCC countries. The company targets 40 new Tanishq store openings this year and maintains optimistic outlook for double-digit growth driven by festive momentum and premiumization strategy.
✅ Conclusion
Titan's remarkable 20+ year journey from sub-₹2 to ₹3,886, backed by exceptional Q2 FY26 showing 59% PAT growth and 29% revenue surge, validates the premium valuation thesis. The critical ₹3,800-₹3,900 supply zone breakout with volume confirmation could trigger rally toward ₹4,200 levels. Jewellery division's 21% growth despite high gold prices, CaratLane's 32% surge, and 86% international business growth demonstrate operational excellence. Damas acquisition and 3,377 store network provide strong growth visibility. Stock trading at ₹3,877 awaits breakout catalyst for next leg upward.
Disclaimer: This analysis is for educational purposes only. Please consult your financial advisor before making investment decisions. Stock markets are subject to risks.
