BUY TODAY SELL TOMORROW for 5%DON’T HAVE TIME TO MANAGE YOUR TRADES?
- Take BTST trades at 3:25 pm every day
- Try to exit by taking 4-7% profit of each trade
- SL can also be maintained as closing below the low of the breakout candle
Now, why do I prefer BTST over swing trades? The primary reason is that I have observed that 90% of the stocks give most of the movement in just 1-2 days and the rest of the time they either consolidate or fall
Resistance Breakout in SYRMA
BUY TODAY SELL TOMORROW for 5%
Fundamental Analysis

EUR/USD I think EUR/USD Market Target 1.16250 Level in the DXY Weakness Situation and EXY Strong Situation.

HIGH PE - 140 - Biocon at major resistance NSE:BIOCON - Even though the results are good , seems hard to justify the PE of 140 . With 6% margin .

XAU/USD – Tug of War Before CPI: Sideway or Breakout? 1. MARKET CONTEXT
The US government reopens after a 40-day shutdown (a historic record).
Investors are on the sidelines observing ahead of tomorrow's CPI announcement → the market is likely to sideway awaiting news.
2. TECHNICAL ANALYSIS (H1–M30)
Main fluctuation range: 4097–4148
Break 4097 → adjust deeply to 407x – 403x
Break 4148 → trigger short-term increase, target 418x – 4205
Decision zone: 4097 & 4148
3. TRADING PLAN
🎯 Main strategy: Trade within the range (Sideway)
→ “Buy low – Sell high” according to support/resistance zones
RR ratio: 1:1 – 1:2 | SL: 10 points | TP: 10–20 points
BUY zone:
4097–4100 (strong support) → TP 4110–4120
Buy scalp: 4120–4124 → TP 4140–4145
Buy swing: 407x / 403x (if there is a candle reaction)
SELL zone:
4145–4147 → TP 4125–4100
If break 415x & retest, switch to Buy breakout
→ Entry 4140–4145 | TP 416x–418x–4205
4. SUMMARY
Main trend: Sideway awaiting CPI news
Strategy: “Break whichever range, trade that range”
Focus zones:
Upper range: 414x (Sell)
Lower range: 4095–4100 (Buy)

LiamTrading – XAUUSD H2 | USD strengthens again, gold ...LiamTrading – XAUUSD H2 | USD strengthens again, gold consolidates in an upward channel; await correction to 4090/4041 – break 4145 to confirm further rise
Quick context: USD recovery causes gold to move sideways during the Asian session. Price is moving within an upward channel, hitting the upper trendline and reacting around 4100, not forming a lower low yet. To confirm the continuation of the uptrend, a break of 4145 is needed; otherwise, prioritise the technical correction scenario towards liquidity zones.
Technical Analysis (Volume Profile • Trendline • S/R • Fibonacci)
Channel & Trendline: Channel top coincides with 4135–4145 → likely to see profit-taking pressure. Holding the lower edge of the channel ~4085–4090 keeps the upward structure valid.
Liquidity & FVG:
Liquidity 4090: price pull/volume attraction zone before choosing direction.
Fibonacci Retracement + old resistance ~4041–4043: strong confluence for a bounce if deep correction occurs.
Main resistance: 4130–4135 (retest of channel top), 4145 (pivot confirming rise), 4200 (sell scalp area if clear rejection appears).
Main support: 4084–4086 (channel edge/liq), 4041–4043 (Fib + S/R), deeper 4020 is a defensive point for buyers.
Trading Scenarios (optimised for mobile reading)
Scenario 1 – Buy shallow pullback (trend-following priority)
Entry: 4084–4086
SL: 4078
TP: 4098 → 4112 → 4135 → 4160
Suggestion: Wait for rejection candle at 4090 or M15 reversal signal before entry.
Scenario 2 – Buy deep (Fib + S/R)
Entry: 4041–4043
SL: 4036
TP: 4056 → 4072 → 4095 → 4120
Suggestion: Prioritise when price fills the gap and leaves a clear lower wick.
Scenario 3 – Sell scalp at resistance (counter-trend)
Entry: 4130–4132
SL: 4138
TP: 4112 → 4100 → 4088 → 4060
Note: Quick scalp only; abandon if H1/H2 closes strongly above 4145.
Bonus – Sell scalp 4200
Condition: Clear rejection on smaller timeframe.
SL: above the nearest recent high.
Reference TP: 4185 → 4166 → 4145.
Risk Management & Invalidation
Short-term bullish bias remains valid if price holds above 4085–4090.
H2 closes above 4145 → prioritise buying on breakout, limit all sell orders.
H2 closes below 4036 → risk of deeper test around 4020.
Risk per trade 0.5–1%, move SL to breakeven at +1R, do not average against the trend.
Which price zone do you find noteworthy today? Comment below & hit Follow on LiamTrading channel for the earliest updates.

Maruti: A good short term opportunity setting upHello,
Maruti Suzuki India Ltd, a subsidiary of Suzuki Motor Corp. The company is engaged in the manufacturing, purchase, and sale of motor vehicles, components, and spare parts. Its other activities include the facilitation of pre-owned car sales, fleet management, and car financing.
Maruti stock is trading at a very great point from a technical perspective & fundamental. Maruti Suzuki has said its first battery-electric vehicle, the E Vitara, will be exported to more than 100 countries, including Japan and Europe, from India. Investors are focusing on any updates on EV-related initiatives by the carmaker.
While the third-quarter net profit margin declined to 9.6% from 9.8% a year earlier due to higher promotional expenses Investors will be closely monitoring margin trends as automakers globally are dealing with relatively high inflation. Maruti Suzuki raised its car prices earlier this month due to rising costs and operational expenses. Investors will be paying attention to the pace of export growth.
While the electric car business is facing challenges as more manufacturers are beginning to believe they might not be able to compete with companies such as Tesla, we believe that Maruti Suzuki will continue to be a top manufacturer in its areas of operation. The companies are now choosing to switch to manufacture of hybrid vehicles than electric vehicles.
The MACD & Moving averages also point to a strong company that is at a good place to consider buying. We place a target of INR 13,800 on the stock with the entry near the shown support.
If you like my analysis, feel free to follow me on Tradingview & comment with the Indian companies you would like me to have a look at.
This is my personal trading journal, where I share insights and ideas. At times, I take trades outside ideal conditions to test strategies. Use this as inspiration but always perform your own analysis before making trading. Goodluck!

XAUUSD – PRIORITISE BUYING WHEN PRICE ADJUSTS💛 XAUUSD – PRIORITISE BUYING WHEN PRICE ADJUSTS 🎯
🌤Overview
Good morning traders 💬
Gold is experiencing a slight adjustment after encountering resistance at the VAH zone on the Volume Profile. This is a natural reaction in the current uptrend.
The price observation zone for today's adjustment is around the H4 trendline at 4078, deeper is the VAH zone 4020, where there is good liquidity for buyers.
Although there might be a short-term adjustment, the main trend remains upward. Therefore, I prioritise waiting to Buy at the support zone, rather than entering a trade against the trend.
💹 Technical Analysis (ICT Perspective)
📈 The price is maintaining a medium-term upward structure, with no reversal signals yet.
🟣 The 4075–4078 zone coincides with the trendline + liquidity zone – a potential buying area for short trades.
🔹 VAH around 4020 is strong support, suitable for long-term Buy if the price adjusts deeply.
💫 The 4200–4203 zone remains a major resistance (Sell Zone) – expect a downward reaction when the price approaches.
🎯 Reference Trading Plan
💖 Buy scalping (short-term)
Entry: 4075–4078 | SL: 4070
TP: 4095 – 4105
💖 Buy zone (main priority)
Entry: 4018–4021 | SL: 4011
TP: 4035 – 4042 – 4075 – 4095
💢 Sell zone (short reaction)
Entry: 4200–4203 | SL: 4210
TP: 4186 – 4165 – 4140
💢 Sell scalping (short-term)
Entry: 4122–4124 | SL: 4130
TP: 4105 – 4086 – 4060 – 4040
⚠️ Important Note
The 4048 zone is strong resistance – closely observe price reactions here.
Prioritise Buy according to the main trend, Sell should only be considered as a short-term reaction.
🌷Be patient and wait for the price to adjust to the support zone to buy according to Smart Money flow.
If you find this useful, please 💛 like – 💬 comment – 🔔 follow LanaM2 for daily gold insights ✨

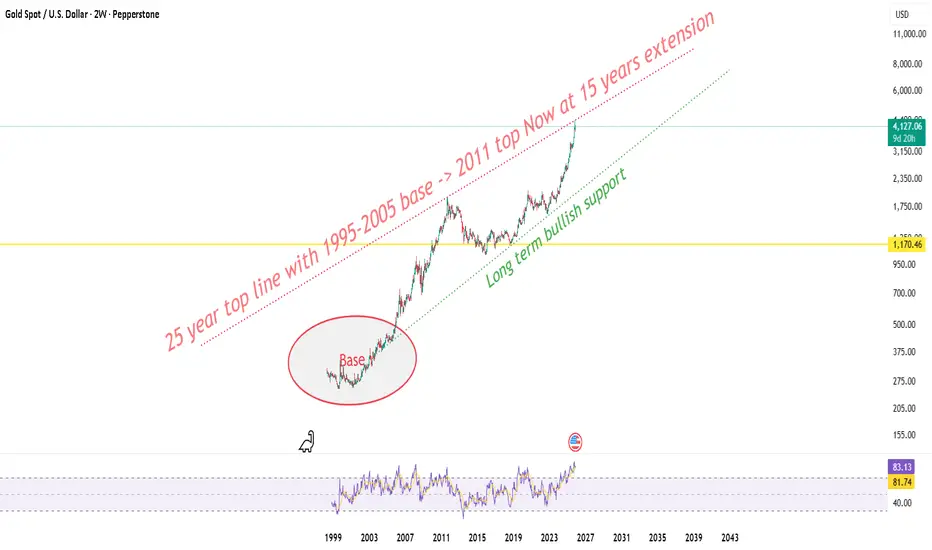
Gold at 25 year top line ! Macro view !Zooming out to the 2 week frame gold’s now touching the same top line that was drawn from the 1995-2005 base to the 2011 cycle high. This upper rail has acted like a generational ceiling and after nearly 15 years, price has stretched back into that very band again, this time near 4150–4350.
This zone isn’t just any resistance it’s the outer wall of gold’s entire super-cycle structure. Historically, whenever price came here with RSI above 80 on the 2-week frame, it marked exhaustion or at least a multi-month digestion phase before the next leg higher. And right now, RSI is sitting around 83 a clear signal of overheated momentum.
Macro context still favors gold in the long term global rate-cut expectations, slower real yields, and consistent central-bank accumulation keep the long-term green base trendline (drawn from 2005 lows) fully intact. As long as that line holds, the long-term structure stays bullish-biased.
But here’s the catch the higher we climb without a structural reset, the more fragile the rise becomes.
So 4365 stands as a major decision point.
Reject from here: we could see a healthy pullback toward 3750-3800 — still within the bullish channel.
Break and close above: that opens the door for a true macro breakout, with next expansion targets sitting around 4800–5200 over the coming years.
For now, this run feels more like a macro stretch ice sitting on sand. Looks shiny, but needs solid ground before it can hold.

BUY TODAY SELL TOMORROW for 5%DON’T HAVE TIME TO MANAGE YOUR TRADES?
- Take BTST trades at 3:25 pm every day
- Try to exit by taking 4-7% profit of each trade
- SL can also be maintained as closing below the low of the breakout candle
Now, why do I prefer BTST over swing trades? The primary reason is that I have observed that 90% of the stocks give most of the movement in just 1-2 days and the rest of the time they either consolidate or fall
Trendline Breakout in LUMAXTECH
BUY TODAY SELL TOMORROW for 5%

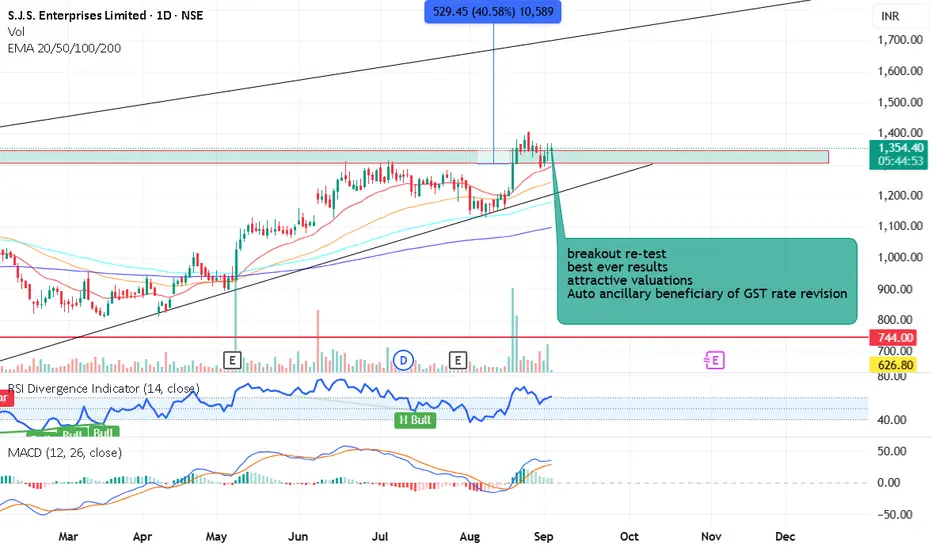
breakout retest SJS Auto ancillary stockbreakout re-test
best ever results
attractive valuations
Auto ancillary beneficiary of GST rate revision
ATH breakout with good volumes and retesting breakout level.
There are lot of chance to fly in blue sky.
this is only for educational not for any trade recommendation.
WILL GOLD CONTINUE TO RISE?I. BASIC CONTEXT
On November 10, 2025, gold prices surged after the market reacted positively to news of the U.S. government reopening.
The current market sentiment expects the FED to cut interest rates soon as recent economic data indicates a weakening U.S. economy.
Lower interest rates mean cheaper money, a weaker USD, thereby driving funds into safe-haven assets like gold.
The current rally is seen as a news-based pullback, potentially extending to key resistance areas before the market establishes a medium-term trend.
II. TECHNICAL ANALYSIS
Main timeframe: H2
Market structure:
Gold prices have broken out of the accumulation triangle pattern.
Formation of an Inverse Head and Shoulders pattern → signaling the correction phase has ended.
III. TRADING SCENARIOS
✅ Main scenario: WATCH TO BUY THE TREND (BUY THE DIP)
Trend expectation: Prices continue to extend the pullback to resistance areas 4180–4220.
Buy zones (BUY ZONES):
Zone 4105–4103 (near old H2 resistance → becoming new support).
Zone 4115–4116 (confirmation area post-breakout).
Deeper zone: 407x – 405x (Fib 0.618, trendline confluence area).
If prices retest the H2 structure: 4040 – 4035.
Buy stop:
When prices break through the 416x area with strong candle force → a buy stop can be placed to follow the breakout momentum.
Note to check the timing and candle force on H2/M30 to confirm momentum.
⚠️ Alternative scenario: WATCH TO SELL REACTION
If clear signs of weakness appear at resistance, consider a short SELL reaction at:
4180–4185
4205–4220
These are potential profit-taking areas for the current pullback wave.
IV. RISK MANAGEMENT
Stop Loss (SL): 10 points
Take Profit (TP): 10–12–13 points depending on setup
RR ratio: 1:1 – 1:1.3
Prioritize capital management according to the principle R ≤ 1% account/order.
Additionally, monitor news on Mr. Trump's actions during this period.
The U.S. government has reopened this week, so expect a fair amount of news, stay alert.
Trade effectively

Bajaj Finserv: Resistance Breaks, Q2 Results AwaitTechnical Analysis
Bajaj Finserv Limited has delivered an impressive super bullish rally since 2010, establishing itself as a blue-chip financial services stock. Multiple times since 2021, the stock faced resistance at the ₹2,000 level, which acted as a psychological and technical barrier.
However, recent strong year-on-year performance enabled the stock to decisively break above this resistance, and the ₹2,000 level is now acting as support - a classic bullish signal of role reversal. Currently trading at ₹2,112, the stock is well-positioned above its previous resistance.
Adding strength to the bullish setup, both the EMA-44 and Supertrend indicators are signaling bullish momentum, providing technical confirmation for the breakout. Tomorrow's Q2 FY26 results announcement serves as a crucial catalyst that could determine the next directional move.
Entry Strategy: Current levels offer opportunity with ₹2,000 support holding firm. Monitor Q2 results for confirmation.
Targets:
Target 1: ₹2,200
Target 2: ₹2,300
Target 3: ₹2,400
Stop Losses:
Minor Support: ₹2,000 (previous resistance, now support - be cautious if breached)
Major Stop: ₹1,800
Below ₹1,800, no more expectations on this stock.
Q1 FY26 Financial Highlights (vs Q4 FY25 & Q1 FY25)
Total Income: ₹35,439 Cr (↓ -3% QoQ from ₹36,595 Cr; ↑ +13% YoY from ₹31,480 Cr)
Total Expenses: ₹21,124 Cr (↓ -12% QoQ from ₹23,868 Cr; ↑ +7% YoY from ₹19,655 Cr)
Operating Profit: ₹14,315 Cr (↑ +12% QoQ from ₹12,728 Cr; ↑ +21% YoY from ₹11,825 Cr)
Profit Before Tax: ₹7,204 Cr (↑ +20% QoQ from ₹6,002 Cr; ↑ +21% YoY from ₹5,968 Cr)
Profit After Tax: ₹5,329 Cr (↑ +12% QoQ from ₹4,756 Cr; ↑ +27% YoY from ₹4,209 Cr)
Diluted EPS: ₹17.46 (↑ +15% QoQ from ₹15.14; ↑ +30% YoY from ₹13.39)
Fundamental Highlights
Bajaj Finserv delivered stellar Q1 FY26 performance with consolidated PAT surging 30% YoY to ₹5,329 crore, driven by robust performance across lending, insurance, and financial services verticals. The company's profit before tax jumped 21% YoY to ₹7,204 crore with total income rising 13% to ₹35,451 crore.
Subsidiary Bajaj Finance (51.39% holding) reported exceptional growth with PAT up 22% YoY to ₹4,765 crore and AUM reaching ₹4.41 lakh crore (up 25% YoY). Customer franchise expanded to 106.51 million, adding 4.69 million new customers in Q1 alone, with new loans booked surging 23% to 13.49 million.
Bajaj Allianz Life Insurance delivered impressive 76% YoY surge in shareholders' PAT to ₹171 crore, with VNB increasing 39% to ₹145 crore driven by product restructuring and favorable mix. Bajaj Allianz General Insurance posted 15% PAT growth to ₹660 crore with gross written premium up 9% to ₹5,202 crore.
Market cap stands at ₹3.45 trillion with EPS of ₹17.30 reflecting 31.1% QoQ and 30.1% YoY increase. The company operates 43 million EMI Network Cards and runs digital platforms like Bajaj Finserv Markets driving cross-selling opportunities.
Strategic diversification across lending, life insurance, general insurance, asset management (₹25,011 crore AUM), and emerging ventures in health, direct wealth management creates multiple growth engines. Capital adequacy ratio at healthy 21.96% provides growth capital while maintaining strong balance sheet.
Conclusion
Bajaj Finserv's decisive breakout above ₹2,000 resistance backed by strong Q1 FY26 showing 27% PAT growth and 30% EPS increase validates the bullish thesis. Subsidiary Bajaj Finance's 25% AUM growth to ₹4.41 lakh crore and 4.69 million customer additions demonstrate operational strength. Tomorrow's Q2 FY26 results serve as critical catalyst for the next leg toward ₹2,400 target. EMA-44 and Supertrend bullish signals provide technical confirmation. Critical support at ₹2,000 and major stop at ₹1,800 offer clear risk management levels for this diversified financial services powerhouse.
Disclaimer: tinyurl.com

SONA (XAU/USD): BREAKOUT DONE! FED CUT KA FAYDA. KAB KHARIDEIN?📰 Fundamental Analysis: Bada Game Changer (MUST READ)
Bhaiyon aur Behnon, fundamental factors are very strong for Gold (Sona)!
Rate Cut Ki Umeed (Expectation): Market is expecting more than 60% probability for another Fed Rate Cut in December.
Kam rates means Dollar (DXY) will be weak, aur Gold (non-yielding asset) becomes dhamakedaar (explosive/exciting)!
Economy Thodi Slow Hai: US Consumer Sentiment slid to 50.3 (lowest since June 2022). Yeh data supports a 'Dovish' Fed, jisse Sona ko aur support milta hai (which gives more support to Gold).
💡 Is Hafta Ka Main Focus: Watch out for FOMC member speeches on Wednesday. Poora market unki taraf dekh raha hai (The entire market is looking towards them) for the next direction!
📊 Technical Analysis: Setup Ekdum Solid Hai!
Gold ne ek powerful Breakout diya hai from the consolidation range (4,044 - 4,060). Matlab, trend ab pakka Bullish ho gaya hai! (Meaning, the trend is now definitely Bullish!)
Entry Ka Wait Karo (Patience is key): DON'T JUMP IN NOW! Wait patiently for a pullback to the Demand Zone/CP (4,081 - 4,114). This is the best place to initiate a Long position.
Targets (TP): If the CP zone holds, the targets are 4,155, 4,185, and the big level at 4,236.
Stop-Loss (SL): Keep it safe below 4,044.
🎯 Strategy Summary: Fatafat Dekho!
Strategy: Wait and Buy (Long) in the 4,081 - 4,114 area.
Risk: Dhyaan rakhna (Be careful) if price closes below 4,044.
#XAUUSD #Gold #Sona #FedRateCut #Breakout #TechnicalAnalysis #FOMC #IndianTraders

AUDNZD - OVERBOUGHT CONDITIONS HINTING AT A POSSIBLE REVERSALSymbol - AUDNZD
CMP - 1.1485
AUDNZD continues to maintain its upward trajectory, supported by fundamental divergence between the two economies. The Australian dollar remains resilient and continues to outperform the New Zealand dollar after the RBNZ implemented an aggressive 50 basis point rate cut, lowering the official cash rate to 2.5%, while the RBA remains on hold due to rising inflation concerns.
Today's move is primarily driven by the Reserve Bank of Australia’s hawkish stance, which has further fueled AUD strength. The pair has been rallying consistently without any meaningful pullbacks or retracements, and several technical indicators are now signaling potential exhaustion within the current uptrend.
A reversal setup may emerge if price action begins to show rejection patterns near key resistance zones, offering short opportunities with favorable risk-to-reward potential.
Resistance levels: 1.1485, 1.1500
Support levels: 1.1427, 1.1378
However at the same time, Keep in mind that If any further hawkish commentary or policy action emerges from the RBA, it could reinforce AUD’s strength, leading to additional upside in AUDNZD before any significant correction unfolds.

LiamTrading – XAUUSD H2 | A corrective phase might occur todayLiamTrading – XAUUSD H2 | A corrective phase might occur today
Follow Liquidity 4090, FVG 4053–4069 & VAH ~4025
Quick glance: Gold remains in an uptrend but shows signs of stalling at the upper boundary of the rising channel. With the USD potentially volatile as the US nears “reopening”, a technical correction towards liquidity zones is a scenario to prepare for.
Technical Analysis
Trendline/Price Channel: Price is moving within an ascending channel; the channel top around 4130–4140 is prone to profit-taking/stalling.
Liquidity: 4085–4092 – a price pull/volume attraction point before choosing the next direction.
FVG #1: 4053–4069 – a price gap likely to fill and rebound.
VAH (Volume Profile): 4023–4028 – volume value peak; strong confluence support during deep corrections.
POC: ~3985–3990 – a magnetic level if the market weakens more than expected.
Resistance: 4135–4140 (near channel top + short-term offer), further 4166 (Fibo/channel top extension).
Fibonacci: The latest upward wave shows the expansion area around 4135–4166 as a “liquidity pocket” – suitable for scalp sell upon clear rejection; retracement levels 0.382–0.5 converge around 406x–402x, matching FVG & VAH → priority buy point if price corrects.
Trading Scenarios
Buy shallow pullback (trend-following)
Entry: 4083–4085
SL: 4077
TP: 4098 → 4112 → 4140 → 4166
Note: Require rejection/wick at Liquidity 4090; move SL to breakeven at +1R.
Buy deep at VAH/Volume Profile
Entry: 4025–4028
SL: 4020
TP: 4040 → 4065 → 4100 → 4112
Note: Prioritize when FVG 4053–4069 fills and rebounds; exercise caution with volume.
Sell scalp at channel resistance (counter-trend)
Entry: 4135–4140
SL: 4148
TP: 4122 → 4105 → 4090
Note: Only a scalp trade; abandon if H1/H2 closes strongly above 4140.
H1/H2 closes below 4077 → risk of testing 4053–4069; breaking further 4020 might drag to POC ~3990.
Each trade risks 0.5–1%, do not average against the trend; adhere to Dow (enter only when support/resistance is confirmed broken on entry timeframe).
Which level are you watching for gold today? Comment below & hit Follow on LiamTrading channel for the fastest updates.

Astral: EMA Breakout Powers Fresh RallyTechnical Analysis
Astral Limited showcases an exceptional wealth creation journey spanning two decades. The stock has delivered a super bullish rally from below ₹4 to reaching ₹2,454 - representing an extraordinary 600x+ growth over 20 years.
Over the past 5 years since 2021, the stock has established strong support in the ₹1,200-₹1,300 zone, tested multiple times. Currently trading at ₹1,577, the stock achieved a significant technical milestone yesterday with a decisive breakout above the EMA-44 level.
The EMA-44 has acted as resistance multiple times in the past, making this breakout particularly significant. Adding to the bullish setup, the Supertrend indicator is also signaling bullish momentum, while quarterly results have been positive, providing fundamental support to the technical breakout.
Entry Strategy: Go long above ₹1,600 with breakout confirmation.
🎯Targets:
Target 1: ₹1,800
Target 2: ₹2,000
Target 3: ₹2,200
🚫Stop Losses:
Critical Support: ₹1,200-₹1,300 zone (tested multiple times over 5 years)
If the ₹1,200-₹1,300 zone is taken down, no more expectations on this stock.
💰Q2 FY26 Financial Highlights (vs Q1 FY26 & Q2 FY25)
Total Income: ₹1,577 Cr (↑ +16% QoQ from ₹1,361 Cr; ↑ +15% YoY from ₹1,370 Cr)
Total Expenses: ₹1,321 Cr (↑ +12% QoQ from ₹1,176 Cr; ↑ +14% YoY from ₹1,160 Cr)
Operating Profit: ₹257 Cr (↑ +39% QoQ from ₹185 Cr; ↑ +22% YoY from ₹210 Cr)
Profit Before Tax: ₹180 Cr (↑ +64% QoQ from ₹110 Cr; ↑ +21% YoY from ₹149 Cr)
Profit After Tax: ₹135 Cr (↑ +71% QoQ from ₹79 Cr; ↑ +24% YoY from ₹109 Cr)
Diluted EPS: ₹5.02 (↑ +66% QoQ from ₹3.02; ↑ +23% YoY from ₹4.09)
Fundamental Highlights
Astral Limited delivered exceptional Q2 FY26 performance with shares surging nearly 6% following strong results. Revenue grew 15.1% with profit rising 24%, driven by plumbing volumes surging 20.6% and adhesives/bathware growing double digits.
Market cap stands at ₹41,805 crore (down 12.5% in 1 year) with annual revenue of ₹6,017 crore and profit of ₹505 crore. Stock is trading at 11.1 times book value with promoter holding at 54.2%.
The company is executing strategic capacity expansion with Hyderabad greenfield plant (70,000 MT capacity) and new Kanpur facility coming up in FY26. Total planned capex of ₹300-350 crore annually in FY25-FY26 to be funded through internal accruals.
Astral expects consolidated revenue growth of 10-12% per annum in FY25 and FY26, supported by plumbing volume growth of 17% and adhesives revenue growth of 15-20%. Gross margins improved to 39% in FY24 from 33% in FY23 due to favorable raw material costs.
The company has successfully diversified into paints, faucets, sanitary ware, and valves through strategic acquisitions. Bathware business expected to achieve operating breakeven in FY26. Strong brand franchise backed by sustained advertising and IPL sponsorships driving market penetration.
✅Conclusion
Astral's remarkable 20-year journey from ₹4 to ₹2,454, backed by strong Q2 FY26 showing 71% QoQ PAT growth and 15% revenue increase, validates the growth thesis. Yesterday's EMA-44 breakout with Supertrend bullish signal creates compelling technical setup. Strategic capacity expansion with 70,000 MT Hyderabad plant and Kanpur facility provide growth visibility. Plumbing volumes surging 20.6% and gross margins at 39% demonstrate operational strength. Entry above ₹1,600 targets ₹2,200 levels with ₹1,200-₹1,300 zone providing strong support base tested over 5 years.
Disclaimer: tinyurl.com

XAUUSD – PRIORITISE BUYING ON TUESDAY💛 XAUUSD – PRIORITISE BUYING ON TUESDAY 🎯
🌤 Overview
Hello everyone 💬
Gold continues its upward momentum in the first two days of the week, supported by the cash distribution policy for low-income individuals and the reopening moves by the US government under President Trump.
These factors are putting downward pressure on the USD, helping gold prices maintain a short-term upward trend.
💹 Technical Analysis
🟣 Currently, the price is touching the VAH area according to the Volume Profile and showing a slight reaction – however, the support trendline around 4110–4113 remains an ideal buying zone to continue following the trend.
🔹 The 4200–4203 area (Fibonacci Extension 2.618) coincides with the strong resistance of H4, likely to see a short adjustment reaction before continuing to extend to the 43xx area.
🎯 Trading Plan Reference
💖 BUY Scenario (priority trend-following)
Entry: 4110–4113 | SL: 4106
TP: 4132 – 4150 – 4175 – 4200 – 4250
💢 SELL Scenario (short-term reaction)
Entry: 4200–4203 | SL: 4207
TP: 4188 – 4165 – 4148
⚠️ Important Notes
Prioritise buying according to the main upward trend, especially when the price reacts at the H4 trendline.
Sell orders are only for short-term reactions, and profits should be secured early when the first TP is reached.
USD volatility remains a key factor to closely monitor this week.
🌷 Conclusion
The upward trend of gold is still maintained 💛
Be patient and wait for the price to react at the 4110–4113 area to buy according to the trend, and take advantage of pullbacks at resistance to manage orders effectively.
If you find this useful, don't forget to 💛 like – 💬 comment – 🔔 follow LanaM2 for daily gold insights ✨

Eurchf bearish /SHORT
---
📉 EUR/CHF – Momentum shifts & premium short bias
The pair is showing renewed dominance of aggressive sellers, enabling a breach of key support range — buyers’ interest remains muted. Coupled with reduced inflation in Switzerland and a lowered fair-value estimate from UBS, the bias tilts decisively downward.
🔻 Entry / Stop / Targets
Entry (Short): around ~0.9313 –– as price re-tests the premium supply zone.
Stop-Loss: just above the 0.9326 level, invalidation of the supply zone.
Take-Profit (TP): primary TP near ~0.9210 (next major support zone).
Alternate TP: deep target ~0.9170 if momentum accelerates.
🎯 Trade Rationale
Structure: supply zone (≈0.9313-0.9326) holding, prior support now acting as supply.
Volume: heightened selling volume confirms break lower in test phase.
Macro + fundamentals: UBS lowers fair value for EUR/CHF to ~1.05 amid Swiss inflation deceleration = underlying risk-to-downside pressure.
Technical: range break below ~0.9320 triggers next leg down.
✨ Messaging for audience
Trade with precision — a premium short zone has been identified, stop is tightly defined, target offers strong risk-reward. This is not just a pullback — it’s a power move where sellers are in control. Position now for the follow-through.
---

NIITMTS well posied technically and fundamentally for quick upmoFollow the "Smart Money" : Domestic Institutional Investors (DIIs) and Mutual Funds significantly increased their stake in the most recent quarter (adding +1.58%).
The "Smart Money" Divergence : This accumulation happened while retail/"public" investors sold off their holdings (-1.38%). This is a classic bullish divergence.
Proof of Accumulation : This isn't day-trading. Recent delivery volumes are exceptionally high, ranging from 65% to 81% , proving that shares are being bought and held for the long term.
Fortress-Like Business Pipeline : The business is heavily de-risked with $409 Million in contracted, visible revenue.
Perfect Client Retention : The company maintains a 100% contract renewal rate from its 104 global clients, proving its services are mission-critical.
Real Growth (Not Just a Story):
Top-Line : 20% YoY revenue growth confirms strong market demand.
AI: AI-enabled services are not a future promise; they are already contributing ~10% of total revenue.
Solid Financial Health : The balance sheet is strong. The company has a high TTM Return on Capital Employed (ROCE) of ~22-28% and a healthy, low debt-to-equity ratio.
The Opportunity : The stock is near its 52-week low due to a short-term profit dip (which scared off retail), while institutions are clearly using this as a value entry point to buy a high-quality, long-term business

mcx gold updatemcx gold fire boom near 1.50% due to rate cut bets fuel rally.
now if mkt sustain abv 123000 looks up side 123590-124000++++in coming session where hurdel 122700 again close blw looks some dwn correction till 122300-121890++++
trading ideas -- buy gold any dips near 123000-123100 with sl 122700 tgt 123590--124000++

XAUUSD – PRICE STRUCTURE UPDATE: MAINTAINING THE TRADING ...💛 XAUUSD – PRICE STRUCTURE UPDATE: MAINTAINING THE TRADING SCENARIO 🎯
🌤 Overview
Hello everyone 💬
The price structure of gold is still on track as per the previous scenario — those who have bought according to the prior plan might have already profited and should continue to hold their ground.
The price in the Asian session at the start of the week has risen steadily, breaking through the 4021 zone, confirming a short-term uptrend and aiming to retest the upper edge of the H4 price channel.
This is a positive signal before the market might enter a deeper correction in the mid-week sessions.
In terms of news, the latest statement from US President Trump indicates that the government shutdown might soon end — this is a factor that could cause significant USD volatility, thereby having a short-term impact on gold prices.
💹 Technical Analysis
📈 On the H4 frame, the price remains within the medium-term upward channel, maintaining the structure of “higher lows”.
🟣 Breaking the 4021 zone confirms that upward momentum is prevailing, and the Sell Zone Liquidity 4090–4100 continues to be the short-term target for testing.
🔹 After hitting this zone, a correction is expected towards the 3920 – 3785 zone (Buy Zone Fibonacci) – where buyers might return strongly.
💫 The current price signal is entirely in line with the previous technical scenario, with no need to change the trading plan.
🎯 Reference Trading Plan
💢 SHORT scenario (short-term)
Entry: 4098–4102 | SL: 4112
TP: 4078 – 4025 – 3998 – 3920 – 3875 – 3785
💖 LONG scenario (long-term strategy)
Entry: 3785–3789 | SL: 3777
TP: 3810 – 3865 – 3925 – 3988
🌷 Conclusion
Gold prices are moving exactly as predicted in the structure 💛
Be patient, maintain discipline, and stick to the key price zones – this is the time when perseverance will yield the greatest advantage.

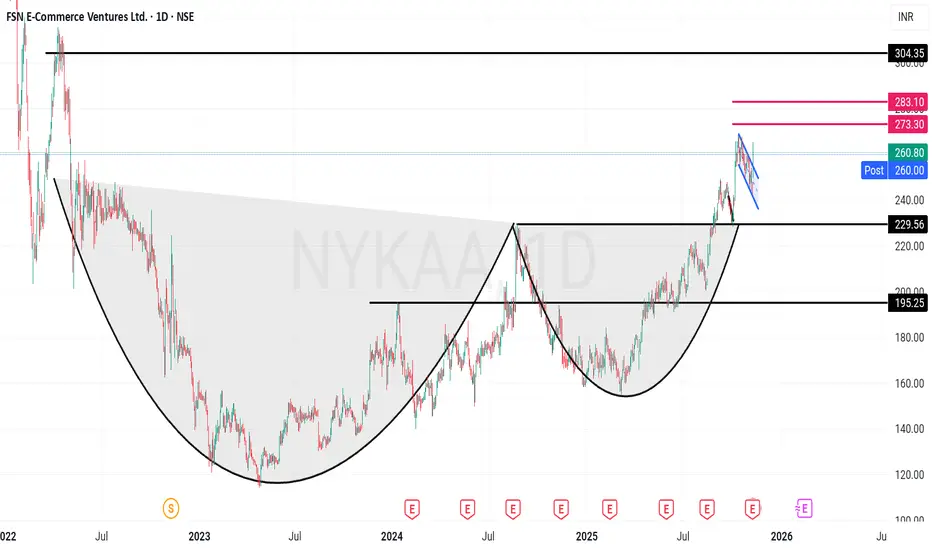
Nykaa - Strong Growth Cup & Handle with Detailed fundamentalsFSN E-Commerce Ventures Limited (Nykaa) – Technical & Fundamental Analysis
Company Overview:
FSN E-Commerce Ventures Limited (Nykaa) is a digitally native consumer technology platform, delivering a content-led, lifestyle retail experience. Since its incorporation in 2012, the company has focused on designing a differentiated brand discovery journey for its consumers. It offers a diverse portfolio of beauty, personal care, and fashion products, including owned-brand products manufactured in-house. Nykaa provides an omnichannel experience to cater to consumer preferences and convenience.
Technical Analysis
Chart Patterns: Cup and handle breakout; Today 1-hour parallel channel breakout
Current Market Price (CMP): ₹260
Targets: ₹301, ₹350
Support Levels: ₹230, ₹195
Recent News & Highlights
✅Q1 FY26 Results: Consolidated net profit surged 142% YoY to ₹23.30 Cr; revenue up 23.4% to ₹2,155 Cr
✅Arbitration Win: Nykaa Fashion received ₹10 Cr compensation from arbitration award
Q1 FY26 Guidance: Management anticipates consolidated net revenue growth at lower end of mid-twenties range YoY
✅Fashion Segment Target: Company expects EBITDA breakeven in fashion by FY26
✅Organic Portfolio Expansion: Aims to increase organic portfolio by 30% annually to reach ₹6,000 Cr GMV
✅Q4 FY25 Performance: EBITDA ₹133 Cr vs ₹93.28 Cr YoY; EBITDA margin improved to 6.47% from 5.59%
✅Corporate Action: NCLT approved merger of Iluminar Media (LBB) into Nykaa Fashion
Analytical Summary
Operational Excellence: Revenue growth of 24.5% YoY with net profit doubling to ₹66.08 Cr demonstrates strong execution and operating leverage. The company is scaling both beauty and fashion verticals while expanding margins.
Capital Structure: Debt increased 41% to ₹961 Cr, but debt-to-equity remains negligible at 0.04, showing conservative leverage. ROE at 5.9% suggests room for improvement in capital efficiency.
Valuation Risk: PE of 675.77 and PB of 40.5 reflect aggressive growth expectations. EV/EBITDA of 117.5 leaves minimal margin of safety, requiring caution for long-term investors.
SWOT Analysis
Strengths (16 Factors):
Rising net and operating cash flows for 2 consecutive years
Strong EPS growth; quarterly profit margins expanding
Improving RoCE, ROE, and ROA
Consistent revenue growth for past 2 quarters
Clean governance; zero promoter pledge
Weaknesses (3 Factors):
Promoter shareholding dilution
Expensive valuation (PE > 40) limits margin of safety
Opportunities (1 Factor):
Increasing FII/FPI shareholding validates institutional interest
Disclaimer
This analysis is for educational and informational purposes only. It does not constitute investment advice. Trading and investing in stocks involve risks, and individuals should conduct their own due diligence or consult with a qualified financial advisor before making any investment decisions. The author is not responsible for any gains or losses arising from the use of this analysis.