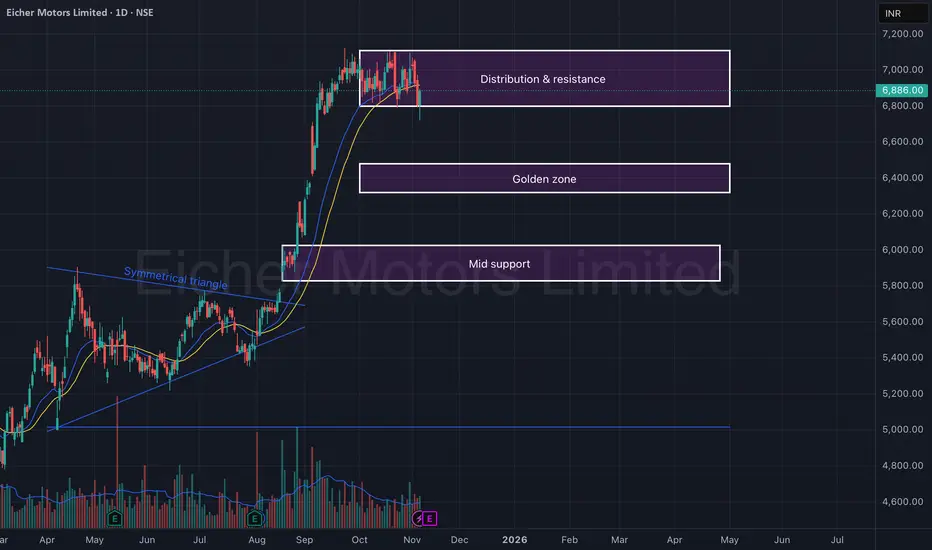
Eicher Motors Ltd – Distribution Zone & Golden Support Level (D)Eicher Motors is showing signs of short-term distribution after a strong uptrend. The price has been consolidating near the ₹6,850–₹7,050 resistance zone, which has acted as a supply area multiple times in recent sessions.
Following an extended rally from the breakout of the symmetrical triangle, the stock appears to be entering a cool-off phase — likely testing lower supports such as the golden zone (₹6,300–₹6,450) or mid support (₹5,900–₹6,000) before resuming its larger trend.
🎯 Key Levels:
CMP: ₹6,886 (+1.17%)
Resistance / Distribution Zone: ₹6,850 – ₹7,050
Golden Zone (Retracement Support): ₹6,300 – ₹6,450
Mid Support: ₹5,900 – ₹6,000
Stop-Loss (if long): Below ₹5,850
📊 Technical View:
Price facing resistance near prior highs, forming short-term distribution structure.
EMA alignment still bullish, but price is attempting a short-term retest.
Golden zone coincides with 38.2–50% retracement levels from the prior rally.
A reversal candle or bullish pattern in the golden zone could present a buying opportunity for swing traders.
🧠 View:
Eicher Motors remains structurally bullish in the medium term, but a short-term pullback is likely. The ₹6,300–₹6,450 golden zone will be key for a potential bounce, while ₹7,000 continues to act as the ceiling until a clear breakout occurs.
Fundamental Analysis
SAIL ( W ) CUP & HENDAL PATTERN BREAKOUT● Add Your Watchlist ●
📊 Chart to Study For Swing Trading
➡️ STOCK NAME : SAIL
▫️Date : 10.11.25
🔸️ Pattern : Cup & Hendal
🔸️Timeframe : Weekly
🔸️Near Brekout Price
🔴 Chart is Only For Education Purpose

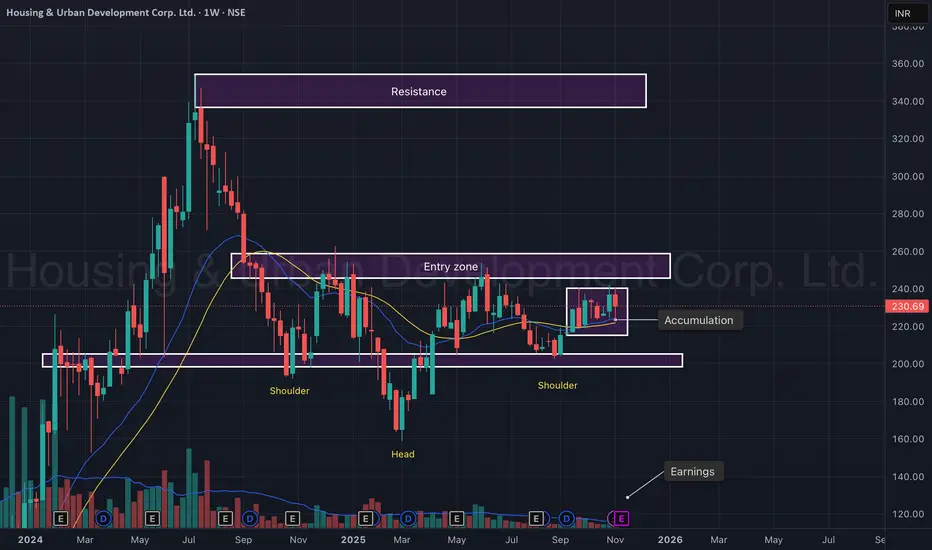
HUDCO – Inverted Head & Shoulders Pattern with Accumulation (W)HUDCO is showing a classic Inverted Head & Shoulders formation on the weekly chart, signaling a potential medium-term trend reversal after an extended consolidation phase. The stock has been forming higher lows since mid-2024, supported by steady volume accumulation.
The entry zone (₹225–₹235) is being retested multiple times, indicating strong demand at lower levels. A decisive breakout above ₹240–₹245 could confirm pattern completion and trigger a fresh rally toward the next resistance zone.
🎯 Key Levels:
CMP: ₹230.69 (+1.39%)
Pattern: Inverted Head & Shoulders
Entry Zone: ₹225 – ₹235
Support (Shoulder Zone): ₹200 – ₹210
Resistance Target: ₹340 – ₹360
Stop-Loss: ₹205 (weekly close basis)
📊 Technical View:
Formation of Inverted Head & Shoulders with strong right shoulder support.
Accumulation phase visible with increasing volumes and sideways base.
20 & 50 EMA alignment turning positive, supporting bullish reversal bias.
Sustaining above ₹240 could trigger the start of a breakout rally.
🧠 View:
HUDCO is showing strong base-building behavior. A weekly close above ₹240 may confirm a breakout from the neckline, paving the way for targets of ₹300+ in the short term and ₹350+ in the medium term.
DABUR: a long term breakout candidatePros:
-Defensive sector i.e. FMCG and world’s largest ayurvedic and natural health care company
-P/E in February 2020 > P/E in November 2025
-Promoter holding at 66% & the retail holding is near an all time low
-Highest ever sales and EPS
-Increase in capex and reduction in debt
-RS has been negative for the last many years and such stocks generally give big upmove when RS becomes positive
Cons:
-PEG is negative implying slow growth
Disc: invested

How will the golden new week be from 10-14/11?📉 H4 Analysis (Trendline, Support & Resistance)
Structure:
The price is currently moving within an upward channel.
Trendline:
Upper red trendline: Acting as dynamic resistance.
Lower red trendline: Current support, from where the price has bounced several times.
🧭 Fibonacci Levels:
0.5 = 4,130
0.618 = 4,188
→ This zone (4,180 – 4,200) is the key resistance zone.
💎 Key Levels:
Resistance: 4,180 – 4,200
(Fibo 0.618 + Previous Swing High)
Support: 3,890 – 3,920
(Previous Base + Bottom of Channel)
⚔️ Possible Scenarios:
If the price stays above 4,000 → Bullish move may continue, target 4,180–4,200.
If the price falls below 3,970 → Bearish breakdown, target 3,890 support zone.
📊 In Summary:
🔺 Resistance: 4,180 – 4,200
🔻 Support: 3,920 – 3,890
⚡ Trend: Mildly bullish, but strong resistance exists at 4,200.
SELL GOLD: 4195 – 4200
Stoploss: 4210
Take profit: 100-300-500pips
BUY GOLD: 3885 – 3890
Stoploss: 3970
Take profit: 100-300-500pips

LiamTrading – XAUUSD D1 | Scenario for Week 2 of NovemberLiamTrading – XAUUSD D1 | Scenario for Week 2 of November
Accumulation range 4047–3928, prioritise buying on breakout – watch for short at 4200 (FVG + Fib 0.382)
Overview: After the correction from the historical peak, gold is forming a bottom – accumulating in the price box 4047–3928. The D1 structure still leans towards a medium-term uptrend if the price holds above 3928; the ~4200 area coincides with a broad FVG + Fib 0.382, a “liquidity pool” prone to strong reactions.
Macro Summary
Hedging flows against public debt/deficit risks and net buying demand from some central banks/Asian bloc support the long-term trend.
Expectations of a cooling interest rate path in 2026 help ease pressure on gold, but pullbacks may still occur before major technical milestones.
Technical Analysis (D1 Frame – Trendline | S/R | Volume zone | Fibonacci)
Accumulation Range: 4047 (top of the box) ↔️ 3928 (bottom of the box). D1 closing above 4047 confirms an upper range expansion; breaking 3928 triggers a deeper decline to lower Fib levels.
Fibonacci of the most recent up wave:
The price is oscillating around 0.618 → tendency to form a base.
Deeper area if the base breaks: 0.5 ~ 3850 and 0.382 ~ 3710.
Key resistance: 4090–4120 (mid-box area), ~4200 (FVG + Fib 0.382) – expected large liquidity/short-term reversal zone.
Important support: 3990–4010 (psychological/trading cushion), 3928 (lower range – breakout mark).
Trendline: The medium-term uptrend line remains intact if corrections do not close below 3928.
Trading Scenario for the New Week
Scenario 1 – Buy with the trend on upper range breakout
Condition: D1 closes above 4047, retest holds firm at 4038–4047.
Entry: 4048–4055
SL: 4018
TP: 4090 → 4120 → 4185–4205 (FVG + Fib 0.382)
Management: Take partial profit at 4090/4120, move SL to breakeven at +1R.
Scenario 1b – Buy at the box bottom (fade range)
Entry: 3935–3945 (when there is a rejection candle/clear buying tail at 3928–3945)
SL: 3895
TP: 3995–4010 → 4040–4047
Note: If D1 closes below 3928, cancel the plan and switch bias to a bearish scenario.
Scenario 2 – Short reaction at the 4200 liquidity zone
Entry: 4185–4205 (FVG + Fib 0.382) when clear rejection appears on D1/H4
SL: 4225
TP: 4120 → 4047 → 4010 (extended target: 3850 if there is a breakdown signal)
Note: Counter-trend order; reduce volume, exit quickly if D1 closes above 4205.
Risk & Invalidation
The medium-term bullish bias remains valid as long as D1 does not close below 3928.
D1 closing below 3928 opens the path to 3850 (Fib 0.5), even 3710 (Fib 0.382).
Strong news (CPI, employment, central bank speeches) can disrupt signals; wait for candle closure according to the chosen frame.
Summary
Gold is “spring-loaded” within 4047–3928. Priority plan: Buy on breakout–hold 4047 to aim for 4090–4120 and test ~4200; simultaneously watch for short reaction at 4200. If 3928 breaks, switch scenario to decline towards 3850 → 3710.

XAUUSD – H4 PERSPECTIVE: WAIT FOR LIQUIDITY TEST BEFORE DEEP...💛 XAUUSD – H4 PERSPECTIVE: WAIT FOR LIQUIDITY TEST BEFORE DEEP DECLINE 🎯
🌤 1. Overview
Hello everyone 💬
Gold just ended the week with a candle closing at the 4001 region, after a slight rise and then holding steady in the upward channel on the H4 frame.
The current sideways movement is making it difficult for many traders to find short-term entry points.
However, the 4090 area still has an unfilled liquidity gap (FVG), which coincides with the upper edge of the price channel. This could be the next short-term destination before the market adjusts for a deeper decline.
From my perspective, gold might rise another leg to sweep the liquidity in the upper region, then adjust back to the 3785 area – an important Fibonacci Retracement zone, where a strong reaction from buyers is highly likely.
💹 2. Technical Analysis
📈 The price structure is still maintaining an upward trend within the H4 price channel, with each subsequent low being higher than the previous one.
🟣 The 4090–4102 area is a liquidity region yet to be swept, located at the channel's peak – a high probability of a downward reaction.
🔹 The potential Buy zone around 3785–3789 coincides with Fibonacci 0.618 and a strong historical support area.
💫 Main scenario: Price might test the upper liquidity region, then adjust down to the Buy Zone before forming a larger upward momentum.
🎯 3. Reference Trading Plan
💢 SELL scenario (short-term)
Entry: 4098–4102 | SL: 4112
TP: 4078 – 4025 – 3998 – 3920 – 3875 – 3785
💖 BUY scenario (long-term strategy)
Entry: 3785–3789 | SL: 3777
TP: 3810 – 3865 – 3925 – 3988
⚠️ 4. Important Notes
Prioritize short-term Sell if there is a strong reaction at the 4090–4100 region.
Long-term Buy only if the price adjusts deeply to the 3785–3790 region.
Limit emotional trading – this is a liquidity accumulation phase before major volatility.
🌷 5. Conclusion & Interaction with LanaM2
Gold is following the accumulation path before forming a major wave 💛
Be patient and observe reactions at the two critical regions 4090 and 3785, as these could be the pivot points for the coming week.

Cholamandalam Financial Holdings Ltd (CFHL) Triangle Breakout 1DCholamandalam Financial Holdings Ltd (CFHL) – Triangle Breakout & 1-Year Resistance Breakout 🚀
📊 Technical View:
CFHL has given a triangle breakout along with a 1-year resistance breakout, indicating strong bullish momentum. If Trend continues, The price action also shows a successful retest of the breakout zone, shows trend continuation.
Resistance Turned Support: ₹1650 – previously a resistance, now acting as strong support.
Current Action: Price broke above the ₹1650 range, retested the level today , and is now moving upward again.
Next Resistance Targets Levels: ₹1824 / ₹2004
Support Levels: ₹1536 / ₹1410
🏦 Company Overview:
Cholamandalam Financial Holdings Limited (CFHL), incorporated in 1949, is a part of the Murugappa Group, one of India’s most diversified business conglomerates.
CFHL is a Non-Deposit Taking Systemically Important Core Investment Company (CIC) registered with the Reserve Bank of India (RBI).
The company holds substantial investments in group companies and provides a diverse range of financial products and risk management services to individual and corporate clients through its subsidiaries and group companies.
📈 For educational purpose only. Not a buy/sell recommendation.

Tamilnad Mercantile Bank (TMB) – Update | 3.5% Move from Our Lvl🟢 Tamilnad Mercantile Bank (TMB) – Update | 3.5% Move from Our Level 🚀
Latest Update : Our analysis shared around ₹499 has played out well — TMB made an intraday high of ₹517, gaining nearly 3.5% from the mentioned level.
🏦 Company Overview:
Tamilnad Mercantile Bank Limited is one of the oldest and leading old private sector banks in India. The bank offers a wide range of banking products and services to retail, MSME, agricultural, and corporate customers.
Retail Products: Home loans, personal loans, auto loans, educational loans, business loans, and security-backed loans.
MSME Portfolio: Loans for manufacturing, traders, and service sector enterprises.
Agricultural Loans: Offered to individual farmers, farmer groups, agri-businesses, and agri-corporates.
📊 Technical View:
High Reached: ₹517 (▲3.5%)
Resistance: ₹510 – price tested and faced mild rejection here.
Supports: ₹466 / ₹440
💡 View: The stock showed strong momentum from the support zone and approached its major 1-year resistance area near ₹510–₹515. A sustained close above ₹515 can confirm a breakout and open the next upside targets of ₹535 / ₹600.
📈 For educational purpose only. Not a buy/sell recommendation.

LTF - Rounding bottom Expecting Rounding bottom pattern to breakout if CMP crosses 195
Target = 195+(195-40) = 350

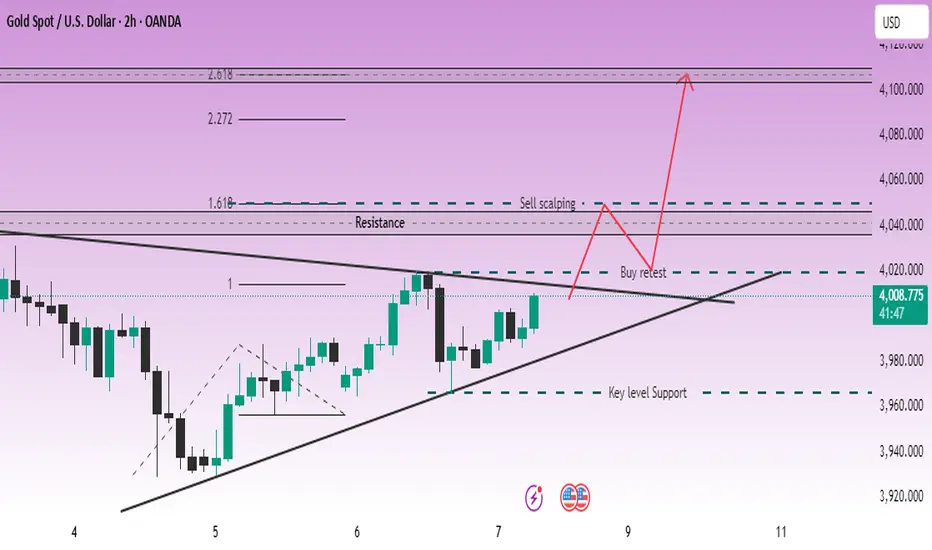
LiamTrading – Gold compressed at the triangle peak; watch for...LiamTrading – Gold compressed at the triangle peak; watch for a break at 4020 (H2)
After a week of accumulation, the price is pressing against the triangle peak between the descending trendline (from late October) and the ascending trendline (from 5/11). The advantage will clearly lean towards an increase if 4020 is broken and held.
Technical Analysis (prioritise H2, Volume Profile – Trendline – S/R – Fibonacci)
Trendline & Structure
The descending trendline is blocking recovery waves; the ascending trendline supports adjustment waves.
Closing the H2 candle above the confluence area ~4020 will confirm a clear upward movement.
Support / Resistance (S/R)
Main support: 3970–3972 (swing low & “Key level Support”).
Decision zone: 4014–4020 (break–retest zone).
Resistance: 4045 (medium-term), 4050 (supply for scalp orders), upper band 4105–4110.
Volume Profile (recent session / composite)
POC magnet: 4015–4017 → likely profit-taking/fluctuations; staying above POC turns this area into a launchpad.
LVN: around 4020 → beautiful break-and-go; failing to hold often pulls back to 4015/4010.
Fibonacci Extension (H2 swing)
1.618 coincides with 4045–4050 → first upward target.
2.272/2.618 creates a liquidity zone 4095–4110 → area may weaken/strong profit-taking.
Today's Trading Scenarios
Scenario 1 – Buy on breakout direction
Entry: 4020–4022 after closing above trendline + retest holding 4018–4020
SL: 4014
TP: 4045 → 4070 → 4100–4110
Management: Partially close at 4045; move SL to breakeven when reaching +1R. Staying above 4020 means POC 4015–4017 should switch roles to support.
Scenario 1b – Buy on adjustment wave (before breakout, cautious volume)
Entry: 3998–4002 (“400x”) when there is an upward reaction at the ascending trendline
SL: 3988
TP: 4017 → 4045
Note: H2 closes below 3988 → cancel the order.
Scenario 2 – Sell scalp at resistance
Entry: 4048–4052 (confluence Fibo 1.618 + supply zone)
SL: 4056
TP: 4040 → 4030 → 4020
Note: This is counter-trend. Ignore if H2 closes strongly above 4052.
Summary
The upward bias is confirmed when breaking–holding 4020, opening targets 4045 → 4070 → 4100+. Before that signal, trade within the range respecting POC 4015–4017 and ceiling 4045/4050. Risk per order 0.5–1%, move SL to BE when reaching +1R.
XAUUSD – AWAITING CONFIRMATION OF UPTREND – TARGET 4050💛 XAUUSD – AWAITING CONFIRMATION OF UPTREND – TARGET 4050 🎯
🌤 1. Overview
Hello everyone 💬
Gold today remains in a phase of indecision – waiting for signals to confirm a new trend.
On the H2 chart, the price has broken the downtrend line and is retesting this line. The structure of “higher lows” indicates that buying pressure is gradually gaining dominance.
The previous peak around 4018 is currently the decisive point for the trend – if the price confirms a breakout above, the upward momentum may extend towards the 4050 area.
Currently, the market is fluctuating within the range of 3964 – 4018, and needs to break out of this zone to determine a clearer direction.
💹 2. ICT Perspective
📈 The price has broken the downtrend line and retested the structure on the H2 chart – an early signal for the potential formation of an uptrend.
🟣 The area 3964–4018 is a short-term liquidity accumulation zone before the price expands.
🔹 OB 4040–4042 coincides with significant resistance, suitable for short sell orders (scalp) if there is a strong reaction.
💫 When the price surpasses 4018, the upward structure will be confirmed and the expansion target may aim towards 4050 – 4077.
🎯 3. Reference Trading Plan
💖 BUY scenario (priority when confirmed)
Entry: above 4018 | SL: 4011
TP: 4025 – 4033 – 4050 – 4077
💢 Short SELL scenario (scalping)
Entry: 4040–4042 | SL: 4046
TP: 4022 – 4015 – 3998
⚠️ 4. Important Notes
Clear confirmation is needed when breaking the 4018 zone before entering a buy order.
If the price continues to fluctuate within the 3964–4018 range, trading should be limited.
Today is Friday, manage risk more tightly, prioritise accuracy in each order.
🌷 5. Conclusion & Interaction with LanaM2
Gold is showing positive signals 💛
Be patient and wait for reactions around the 4018 zone – this could be the start of a new uptrend if clearly confirmed.

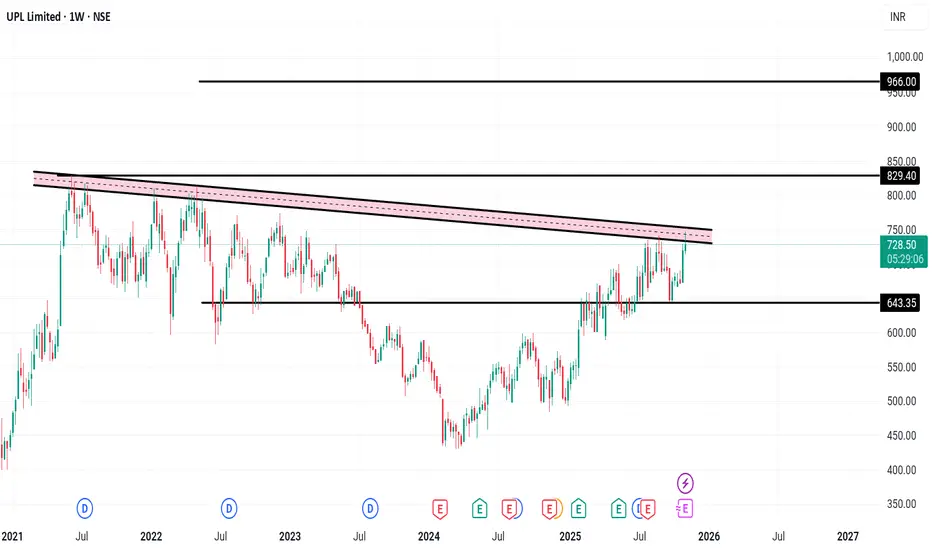
UPL Limited – Weekly Chart Analysis
📊 UPL Limited – Weekly Chart Analysis
Company Overview:
UPL Limited is a global leader in sustainable agricultural solutions, ranked among the top five agricultural solutions companies worldwide. The company operates across multiple countries, offering an integrated portfolio of patented and post-patent agricultural solutions for both arable and specialty crops — including biologicals, crop protection, seed treatment, and post-harvest solutions.
UPL is principally engaged in:
Production and sale of agrochemicals, field crops, and vegetable seeds
Non-agro business of industrial chemicals, chemical intermediates, and speciality chemicals
With market access across the world’s food basket, UPL is focused on driving growth and innovation throughout the entire agricultural value chain — from growers to distributors and partners. 🌱
📈 Technical View (1-Week Chart):
A trendline formation is observed on the weekly timeframe, indicating a potential breakout setup.
Resistance: ₹830 – strong resistance zone. A breakout above this level can trigger the next target near ₹930.
Support: ₹643 – strong support base.
This formation suggests the move could take time to play out, as it’s developing over the weekly chart.
📊 Key Financial Snapshot:
UPL’s current market price is around ₹724.15 with a P/E ratio of 11.65. The company holds a market capitalization of ₹61,068.53 crore and offers a dividend yield of 0.83%.
In the latest quarter, net profit stood at ₹612 crore, reflecting a 125.74% increase compared to the previous quarter. Quarterly sales were ₹12,019 crore, showing an 8.38% rise. The company’s Return on Capital Employed (ROCE) is 7.66%, indicating stable operational efficiency.
Disclaimer: For educational purposes only, not investment advice
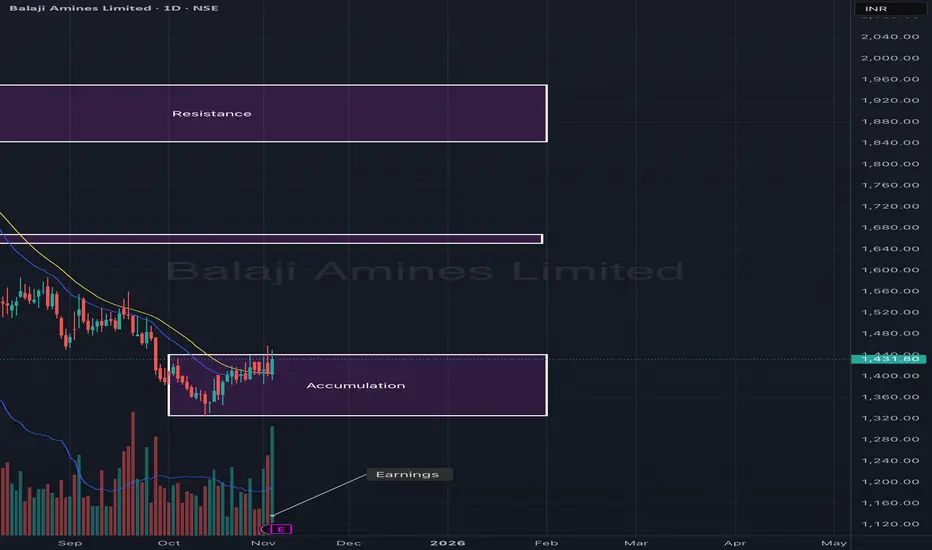
Balaji Amines Ltd – Accumulation Phase Before Potential UpsideBalaji Amines appears to be in a strong accumulation zone after an extended downtrend. The stock has been consolidating between ₹1,350–₹1,450, forming a solid base supported by stable volumes. A sustained move above this range could mark the beginning of a trend reversal and initiate a fresh leg toward the upper resistance levels.
The recent earnings announcement may act as a potential catalyst, as the stock shows early signs of momentum supported by short-term moving average crossovers.
🎯 Key Levels:
CMP: ₹1,431.80 (+1.93%)
Accumulation Zone: ₹1,350 – ₹1,450
Resistance 1: ₹1,650 – ₹1,700
Resistance 2: ₹1,900 – ₹1,950
Stop-Loss: ₹1,340 (on daily close basis)
📊 Technical View:
Price consolidating near the base zone post-correction, signaling accumulation.
Volume stability and EMA alignment suggest early buying interest.
A breakout above ₹1,450 could trigger a move toward ₹1,700.
Sustaining above ₹1,700 may open the next leg toward ₹1,950+.
🧠 View:
Balaji Amines is forming a base after prolonged correction. A close above ₹1,450 with volume confirmation can trigger momentum toward ₹1,700 in the short term, and ₹1,950 in the medium term.
A daily Market WrapMarket Mood: Mildly Moody
US equities hit a speed bump as the dollar tripped for the second day running. Treasury yields, which had shot up recently, cooled off slightly—though the 10-year looks like it’s eyeing another climb. Precious metals made a modest comeback, thanks to the softer dollar, but not enough to justify breaking out the champagne (maybe a half-smile at best). Oil, meanwhile, slid to a two-week low, and Asia decided to keep things boring with flat equities and currencies
America’s Political Soap Opera: Shutdown, Season 2
US assets are looking fragile, and the biggest villain is the government shutdown, now so long it deserves its own Netflix series. With Republicans and Democrats locked in a staring contest, government functions are grinding to a halt and the economic fallout is starting to bite.
To add to the drama, Democrats scored sweeping wins in local elections, and President Trump is blaming the shutdown for the Republican stumble. The big question: will this political stalemate finally turn into a compromise, or will Washington keep playing chicken with the economy?
Corporate Reality Check: Layoffs Ahead?
In a less-than-cheerful headline, US firms announced the highest number of job cuts for any October in over 20 years. The culprits: AI efficiency drives, cautious consumers, tighter corporate budgets, and rising costs.
Economists warn this could flip the labor market from today’s “low hire, low fire” equilibrium to a much scarier “low hire, high fire” one—basically, fewer jobs and more pink slips.
Central Banks: The Brits Blink First
Across the pond, the Bank of England played it safe, keeping rates unchanged in a tight 5–4 vote. The Bank noted that inflation has “peaked,” subtly hinting at future cuts. In plain English: the BoE is done fighting inflation and may soon start fighting recession fears.
The move wasn’t a surprise, but the dovish tone was softer than expected—like a stern teacher suddenly saying, “Alright, you’ve learned your lesson.”
On Deck: US Data & Fed Chatter
Today’s economic lineup features the University of Michigan’s Consumer Sentiment Index and the New York Fed’s Consumer Inflation Expectations survey—two handy barometers for how optimistic (or not) Americans are feeling about prices and paychecks.
Adding to the noise, Fed officials Williams, Jefferson, and Miran are scheduled to speak. Expect markets to hang on every word, as if one of them might accidentally say “rate cut.”
India Watch: Trade Talks & Banking Tweaks
Back home, Commerce Minister Piyush Goyal said that India–US trade negotiations are “going very well”, though several “sensitive and serious” issues remain. Translation: progress, but not quite popcorn-worthy yet.
Meanwhile, the RBI kept its steady hand on the rupee, continuing its interventions to avoid any wild FX swings. The RBI also reaffirmed its cap on voting rights for large bank shareholders, a reminder that no matter how big you are, in Indian banking, you still don’t get to call all the shots.

Gold Again Bullish side Buy Gold 4018 above cross
Then buy gold
Target 4039,4060,4075,4110
Sell Gold 4006
Target 3995,3988,3965,3930,3900,3880
Wait for correction

Pricol LtdDate 07.11.2025
Pricol
Timeframe : Weekly Chart
A Long Term Bet & Buy On Dip/s Stock.....
Key Points
(1) Company is the 2nd-largest instrument cluster manufacturer globally by volume and holds a 55-60% share of the domestic market and 65% in the 2W segment
(2) The company has 8 manufacturing plants across India
(3) Allocated Rs. 600 Cr for capacity expansion between FY23-FY25, focusing on new PLI scheme products and potential acquisitions
Product Segments
(1) Driver Information and Connected Vehicle Solutions
(2) Actuation, Control, and Fluid Management Systems
Product Mix
(1) Dashboard Instruments: 68%
(2) Pumps & Mechanical Products: 20%
(3) Switches and Sensors: 12%
Customer Segments
(1) Domestic OEMs: 89%
(2) Exports: 6%
(3) Aftermarket: 5%
Clientele
TVS Motor Company, Hero MotoCorp, Bajaj Auto, Royal Enfield, Honda Motorcycle, etc
Valuations
(1) Market Cap 6312 Cr
(2) Stock Pe 33
(3) Roce 23%
(4) Roe 17%
(5) Book Value 5.5X
(6) Opm 12%
(7) EV/Ebita 16.39
(8) Promoter 38%
(9) Profit Growth (TTM) 15%
(10) Sales Growth 35%
Regards,
Ankur Singh

Kaynes, IOT king and leading electronic equipment manufacturerBuy: 4050
SL: 3900
Target: 4800
The stock is technically in strong uptrend and fundamentally also good because it has a strong order book and now it can be considered

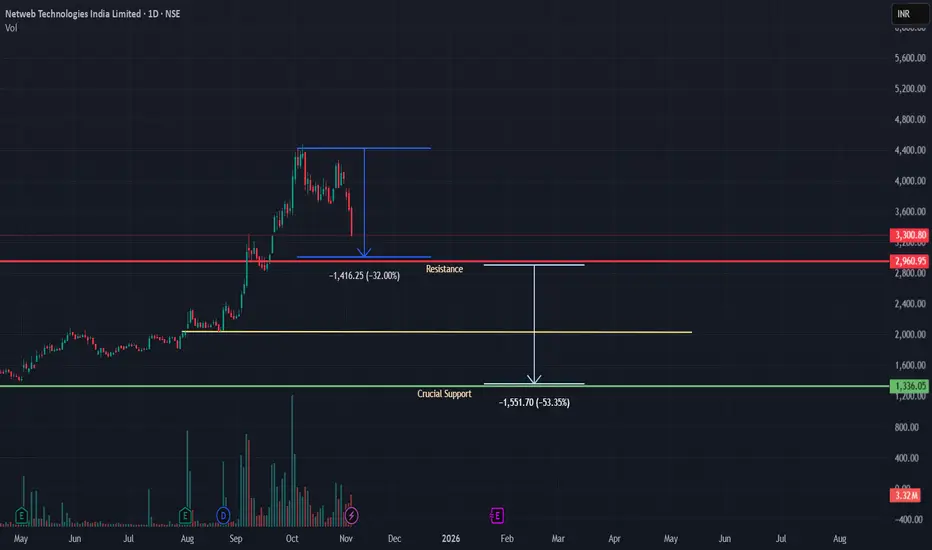
Time to have a foot in the door of AI for India ?The NVIDIA of India.
The sock have rallied almost 8X since its IPO price.
Since the last month it has corrected over 25%.
> Reasons to consider the stock-
- Fastest growing company in segment.
- Strong growth(~66%).
- Backed by India AI Mission, NSM, and PLI schemes.
- India's digital transformation need more AI and Cloud Infra giving it large room still to grow.
- Strong Orderbook of ₹3,252 Cr.
- govt. projects >50%
Optimized Strategy (Clear, Actionable)
Price Range --> Condition --> Allocation --> Rationale
₹3,000–₹3,300 --> Current --> 15% --> FOMO hedge
₹2,600–₹2,800 --> 15–20% correction --> 20% --> Better value
₹2,200–₹2,400 --> 30% correction --> 25% --> High value zone
₹1,900–₹2,100 --> 40% correction --> 25% --> Deep value — strong buy
₹3,600+ Only on earnings upgrade --> 15% max --> Grow with fundamentals
The stock is currently worth accumulating of initial step. There is a big room for the stock to grow looking at India growing digital sector. We need data localization and the company is in a partnership with Global sector Giant NVIDIA. Bett]ting on the company worth.
Note : I am not a SEBI registered analyst so ask your advisor or do your own research before taking any financial decision. I am not responsible for any of you losses.
INDIANB Price ActionAs of July 24, 2025, Indian Bank (INDIANB) is trading around ₹639, showing strong momentum after recovering from recent declines. The stock is close to its 52-week high of approximately ₹658, indicating a robust upward trend in the public sector banking space.
The bank has demonstrated consistent financial growth, with a 14% year-on-year increase in both deposits and advances, currently standing above ₹63,000 crore and ₹53,000 crore respectively. Total business volume grew to over ₹1.16 lakh crore. Net profit for the last financial year increased by 11% to around ₹1,124 crore.
Asset quality has improved, with gross non-performing assets (NPA) reducing to 3.09% and net NPA to 1.25%. The provision coverage ratio is strong at 78%, reflecting prudent risk management. Net interest margin (NIM) is stable at approximately 3.6%, supporting healthy core profitability. The cost-to-income ratio is near 48%, indicating moderate operational efficiency.
Return on assets (ROA) and return on equity (ROE) stand around 1.55% and 12.6% respectively, highlighting solid returns relative to asset base and shareholder equity. Capital adequacy ratios remain comfortable under Basel III norms.
Technically, Indian Bank’s stock is trading above major moving averages (5, 20, 50, 100, 200 days), confirming positive price momentum. Year-to-date, the stock has delivered over 21% returns, outperforming many peers in the public sector banking segment.
Overall, Indian Bank presents a strong growth and stability profile with improving asset quality, stable margins, and expanding business volumes, making it an attractive candidate in the public banking sector for medium to long-term investors.

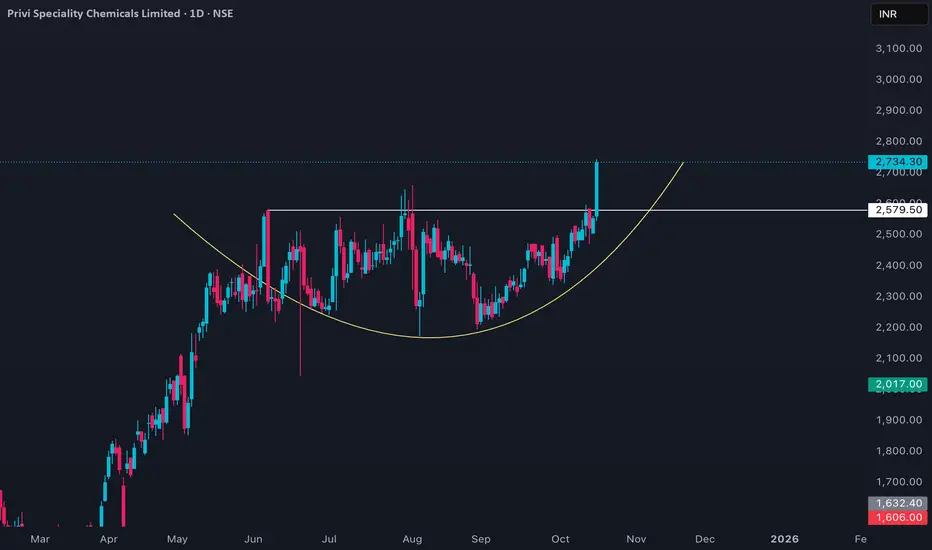
PRIVISCL Price actionPRIVISCL (Privi Speciality Chemicals Ltd) is currently trading with a price near ₹2,520–₹2,730, showing recent volatility with a slight downward bias. The stock touched a 52-week high at ₹2,660 in August 2025 and experienced a notable pullback from that level. On October 15, it closed at ₹2,539, after reaching a low of ₹2,505 during the session. Average daily volumes are moderate, and the deliverable percentage remains healthy, typically above 75%.
Short-term price action reflects a decline of about 8% over the past month and roughly 6% over the last week. However, the yearly performance remains strong, with a rise of 49% in the past 12 months, beating many industry peers. The company’s fundamentals show premium valuation levels with a trailing PE over 45, and the stock trades at nearly 10 times its book value. Market capitalization is around ₹9,600–₹10,700 crore, and debt remains moderate at a ~1:1 ratio. No promoter shares are pledged.
Earnings are solid: EPS has grown over 34% annually for the past three years, and EBIT margins have improved from 13% to 16% in recent quarters. Net income for the last quarter came in at ₹619 million, with revenue growth supported by positive operating trends. The company pays a small annual dividend, with the last payout at ₹5 per share, offering a modest yield.
Overall, PRIVISCL is fundamentally strong, but the recent pullback suggests short-term consolidation after a robust rally. Valuations are elevated, so price movement may remain volatile; long-term outlook is supported by growth in profitability and margins, with analysts maintaining high price targets above current levels.
Silver Price Technical Analysis & Forecast November 2025 Get the latest Silver technical analysis and price forecast for November 2025. Discover critical support and resistance levels, bullish and bearish scenarios, and market momentum. Find out if Silver (XAG/USD) will break higher or see a pullback, with expert insights on trend direction and potential price targets.

LiamTrading – Gold confirms medium-term uptrendLiamTrading – Gold confirms medium-term uptrend
Gold has officially broken the downward trendline, confirming the transition phase to a medium-term uptrend. After a prolonged accumulation phase, the market is beginning to show clear buying power, and the potential for an extended rally is gradually forming.
Macro – Fundamental Analysis
The latest report from the World Gold Council (WGC) shows that central banks continued to increase gold purchases significantly in September, totalling 39 tonnes, the highest level since the beginning of the year.
Most notably, the Central Bank of Brazil – for the first time this year – added 15 tonnes of gold to its national reserves.
Since the beginning of the year, the net purchases by central banks have reached 200 tonnes, clearly reflecting the trend of moving away from the USD amidst global economic and geopolitical instability. This capital flow provides a solid foundation for the medium and long-term uptrend of gold.
Technical Analysis
On the H2 chart, gold prices have broken the downward trendline, signaling a reversal and establishing a new upward structure.
The 3985–3988 zone is acting as dynamic support, potentially serving as a retest point before prices continue to rise.
The POC of the Volume Profile at the 4015–4017 zone is a short-term resistance, where the market may see profit-taking reactions before breaking higher.
The 4046 mark is considered a decisive zone; if surpassed and held, the medium-term uptrend will be strongly reinforced.
Today's Trading Scenarios
Scenario 1 – Buy in line with the uptrend:
Entry: 3986–3988 (may wait for retest confirmation)
SL: 3980
TP: 4020 – 4045 – 4090
Scenario 2 – Short sell at resistance:
Entry: 4015–4017
SL: 4023
TP: 4002 – 3986
Summary
Gold is giving clear signals of establishing a medium-term uptrend, supported by buying flows from central banks. Traders should prioritise buying positions at strategic support zones and observe price reactions around the POC to confirm the next direction.
