Fundamental Analysis Basics (P/E, P/B, ROE, ROCE)1. Price-to-Earnings Ratio (P/E Ratio)
What it Means
The P/E ratio tells you how much investors are willing to pay today for ₹1 of a company’s earnings. It connects a company’s market price with its profit generation ability.
Formula:
P/E = Current Market Price ÷ Earnings Per Share (EPS)
Why P/E Matters
A high P/E suggests that investors expect strong future growth.
A low P/E may indicate undervaluation, or that the company is facing growth challenges.
How to Interpret P/E
High P/E (>30): Market is optimistic, often seen in growth sectors like technology or consumer internet companies.
Moderate P/E (15–30): Indicates stable performance, common in quality midcaps and blue-chip stocks.
Low P/E (<15): Might indicate a value pick or a fundamentally weak company.
Limitations
P/E does not work well if profits are volatile or negative.
P/E differs widely across sectors—comparing a bank with a tech company is misleading.
Best Use Cases
Compare P/E with the stock’s historical average.
Compare P/E with the industry average.
Use Forward P/E (P/E using estimated future earnings) to understand growth visibility.
2. Price-to-Book Ratio (P/B Ratio)
What it Means
The P/B ratio compares the company’s market value with its book value (net assets). It tells how many times investors are paying relative to assets.
Formula:
P/B = Market Price per Share ÷ Book Value per Share
Book Value per Share = (Total Assets – Total Liabilities) ÷ Number of Shares
Why P/B Matters
Useful for asset-heavy sectors such as banks, NBFCs, manufacturing, and PSU companies.
Helps understand whether the stock trades above or below its actual net worth.
How to Interpret P/B
P/B < 1: Stock may be undervalued; the company trades below its net worth.
P/B between 1–3: Normal valuation for most companies.
P/B > 3: Indicates premium valuation; market expects strong future returns.
Limitations
Not useful for asset-light businesses like IT, FMCG, or digital companies where the real value lies in brand and intellectual property.
P/B alone does not measure profitability or efficiency.
Best Use Cases
Combine P/B with ROE to judge whether a company is generating strong returns on its net assets.
Valuable for evaluating banks and financial institutions.
3. Return on Equity (ROE)
What it Means
ROE shows how efficiently a company generates profits using shareholder equity. It reflects management’s ability to create value.
Formula:
ROE = Net Profit ÷ Shareholder’s Equity × 100
Why ROE Matters
High ROE indicates that the company uses shareholder money efficiently.
It reflects competitive advantage, pricing power, and strong demand.
How to Interpret ROE
ROE > 20%: Excellent – shows strong efficiency and high margins.
ROE 15–20%: Good – typical for stable companies.
ROE < 10%: Weak – indicates poor profitability or inefficient use of equity.
Limitations
ROE can be misleading if the company has very high debt; equity becomes smaller because debt funds the assets.
A temporary profit spike can artificially inflate ROE.
Best Use Cases
Compare ROE with the industry average.
Use ROE along with P/B to identify high-quality compounders.
Check 5–10 year ROE trends for consistency.
4. Return on Capital Employed (ROCE)
What it Means
ROCE measures profitability based on all capital employed, including equity and debt. It gives a more holistic view than ROE.
Formula:
ROCE = EBIT ÷ (Equity + Debt) × 100
Here, EBIT (Earnings Before Interest and Taxes) measures operating profit.
Why ROCE Matters
Shows how efficiently the company generates profits using both debt and equity.
Crucial for capital-heavy industries like manufacturing, steel, energy, or infrastructure.
How to Interpret ROCE
ROCE > 20%: Excellent capital allocation, highly efficient.
ROCE 15–20%: Good and sustainable.
ROCE < 12%: Weak returns relative to capital employed.
Limitations
ROCE may fluctuate due to capital expansion cycles.
Not very useful for debt-free companies where ROE already gives similar insight.
Best Use Cases
Compare ROCE with the company’s cost of capital (WACC).
High ROCE indicates strong pricing power and effective management.
How These Ratios Work Together
Using P/E, P/B, ROE, and ROCE in isolation is incomplete. Successful investors combine them for a full picture of valuation and performance.
1. P/E + ROE → Identifying Growth at Reasonable Price (GARP)
High ROE + reasonable P/E = High-quality stock at fair valuation.
Example: A company with ROE 20% and P/E 18 is usually attractive.
2. P/B + ROE → Banking and Financial Analysis
High ROE + moderate P/B = efficient bank with good asset quality.
A bank with ROE 17% and P/B 1.5 is stronger than a bank with ROE 10% and P/B 1.
3. ROCE + P/E → Capital-Intensive Business Screening
High ROCE suggests strong return on capital.
If P/E is low while ROCE is high, the stock may be undervalued.
4. ROE vs ROCE → Debt Analysis
ROE > ROCE: Company uses leverage (debt) to boost shareholder returns.
ROCE > ROE: Limited debt; equity is used more efficiently.
Practical Example (Simplified)
Suppose a company has the following metrics:
P/E = 20
P/B = 3
ROE = 22%
ROCE = 18%
Interpretation:
P/E 20 → Fair valuation.
P/B 3 → Market expects strong future performance.
ROE 22% → Very efficient with shareholder capital.
ROCE 18% → Strong use of total capital.
Conclusion:
This is a high-quality growth company trading at a fair-to-premium valuation.
How Investors Use These Ratios in Real World
1. For Long-Term Investors
Focus on businesses with consistently high ROE and ROCE.
Avoid companies with declining profitability, even if valuation looks low.
2. For Value Investors
Look for low P/E and low P/B stocks with improving ROE/ROCE.
These indicate potential turnarounds.
3. For Growth Investors
Accept high P/E if ROE and ROCE remain elevated for multiple years.
Growth sustainability is more important than cheap valuation.
4. For Traders
Use ratios to identify strong fundamentally-backed stocks for swing or positional trades.
Conclusion
P/E, P/B, ROE, and ROCE are essential tools of fundamental analysis. P/E and P/B help measure valuation, while ROE and ROCE measure profitability and efficiency. Together, they determine whether a stock is fundamentally sound, fairly priced, and capable of delivering long-term returns. When used consistently and compared with historical data, sector averages, and market conditions, these ratios give investors a powerful framework for making informed decisions.
Fundamentalstrategy

Understanding the Fundamental MarketCore Principles of the Fundamental Market
Intrinsic Value Assessment:
The central idea in the fundamental market is that every asset has an intrinsic or “true” value. Investors compare this intrinsic value with the current market price to determine whether the asset is undervalued, fairly valued, or overvalued. Buying undervalued assets or selling overvalued ones forms the basis of long-term profit strategies.
Focus on Economic Fundamentals:
Fundamental markets heavily rely on macroeconomic and microeconomic indicators. For example, GDP growth, inflation rates, employment statistics, interest rates, and government fiscal policies are crucial in assessing the overall economic environment. At the micro level, company-specific data such as revenue, earnings, debt levels, cash flow, and competitive positioning are analyzed to determine the financial health and growth potential of individual firms.
Long-term Investment Horizon:
Unlike traders who operate in the short-term, the fundamental market favors long-term investments. Investors anticipate that while short-term price fluctuations may occur due to market sentiment or technical factors, in the long run, the market price of an asset will converge with its intrinsic value.
Key Components of Fundamental Market Analysis
Company Analysis (Equity Market):
In the stock market, fundamental analysis involves examining a company’s financial statements—balance sheet, income statement, and cash flow statement. Key metrics include:
Earnings per Share (EPS): Indicates profitability on a per-share basis.
Price-to-Earnings Ratio (P/E): Measures whether a stock is overvalued or undervalued relative to its earnings.
Debt-to-Equity Ratio: Assesses financial leverage and risk.
Return on Equity (ROE) and Return on Assets (ROA): Evaluate efficiency in using shareholders’ capital or assets to generate profits.
Beyond numbers, qualitative factors such as management quality, brand strength, market share, regulatory environment, and competitive advantages are also critical in assessing long-term growth potential.
Macroeconomic Analysis:
The broader economy directly influences asset prices. Factors such as:
Interest rates: Higher rates may reduce borrowing and consumer spending, negatively affecting company profits.
Inflation: Rising inflation can erode the real value of returns and affect purchasing power.
Fiscal and Monetary Policies: Government spending, tax policies, and central bank interventions can stimulate or constrain market growth.
Global Events: Geopolitical events, pandemics, and trade policies also play a significant role in determining market trends.
Industry Analysis:
Understanding the industry in which a company operates helps investors identify growth opportunities or potential risks. Factors to consider include:
Market size and growth potential
Competitive dynamics
Technological innovations
Regulatory constraints
Cyclical vs. non-cyclical industry characteristics
Valuation Models:
Investors use various models to estimate intrinsic value, including:
Discounted Cash Flow (DCF) Analysis: Projects future cash flows and discounts them to present value.
Dividend Discount Model (DDM): Focuses on the present value of expected dividends.
Comparable Company Analysis: Compares valuation multiples (like P/E, EV/EBITDA) with peers.
Asset-Based Valuation: Evaluates the net asset value of a company by subtracting liabilities from total assets.
Participants in the Fundamental Market
The fundamental market attracts a wide array of participants, including:
Long-term investors: Individual and institutional investors who seek wealth accumulation over years or decades.
Mutual funds and pension funds: These funds invest in fundamentally strong companies with sustainable growth.
Value investors: Investors who follow the philosophy of buying undervalued stocks with a margin of safety, popularized by Benjamin Graham and Warren Buffett.
Corporate analysts and research houses: Professionals who provide insights into company performance and macroeconomic trends.
Advantages of Operating in the Fundamental Market
Reduced Speculative Risk: By focusing on intrinsic value, investors can avoid the herd mentality and irrational exuberance often seen in speculative trading.
Long-Term Wealth Creation: Fundamental market investments are typically more stable and generate wealth over extended periods through price appreciation and dividends.
Informed Decision-Making: Thorough research and analysis ensure that investment decisions are grounded in reality rather than market sentiment.
Alignment with Economic Growth: Investments in fundamentally strong companies often mirror real economic growth, providing consistent returns.
Challenges of the Fundamental Market
Time-Consuming Analysis: Evaluating financial statements, industry dynamics, and macroeconomic trends requires significant effort and expertise.
Market Inefficiency: In the short term, market prices may deviate from intrinsic value due to speculation, news events, or investor sentiment.
Information Overload: Investors must filter vast amounts of data to focus on meaningful indicators.
Globalization and Complexity: International exposure introduces currency risks, geopolitical factors, and cross-border regulatory challenges.
Examples of Fundamental Market Strategies
Value Investing: Buying stocks that trade below their intrinsic value and holding until the market recognizes their true worth.
Growth Investing: Identifying companies with strong revenue and earnings growth potential even if current valuations are high.
Income Investing: Focusing on companies that provide regular dividend income alongside steady capital appreciation.
Sector Rotation: Moving investments across sectors based on macroeconomic cycles and industry trends.
Conclusion
The fundamental market is the backbone of rational, long-term investing. It emphasizes in-depth research, economic understanding, and valuation analysis to identify assets with sustainable growth potential. By concentrating on intrinsic value, participants in the fundamental market can mitigate short-term volatility and speculation, building wealth steadily over time. While it requires patience, diligence, and expertise, the fundamental market offers one of the most robust approaches to navigating the complexities of modern financial markets.
Ultimately, the fundamental market is not just about buying and selling assets—it’s about understanding the economy, businesses, and human behavior to make informed decisions that align with long-term financial goals.
Importance of Understanding Market Fundamentals1. Definition of Market Fundamentals
Market fundamentals refer to the core economic, financial, and quantitative factors that influence the price and value of financial instruments. In equities, fundamentals typically include revenue, earnings, debt levels, and management quality. In commodities, supply and demand dynamics, production costs, geopolitical events, and seasonal trends play a pivotal role. For currencies, factors like interest rates, inflation, trade balances, and central bank policies dominate price behavior. Understanding these elements provides insight into why prices move in a certain direction and helps participants make informed decisions rather than relying solely on market sentiment or speculation.
2. Informed Investment Decisions
Investing without understanding market fundamentals is akin to navigating a stormy sea without a compass. Fundamentals provide the analytical foundation for evaluating the intrinsic value of an asset. For example, in equity markets, price-to-earnings (P/E) ratios, return on equity (ROE), and earnings growth rates help investors assess whether a stock is overvalued or undervalued. Similarly, commodity traders examine production data, inventory levels, and global consumption patterns to gauge potential price trends. By relying on fundamentals, investors can make decisions grounded in logic and data, rather than reacting impulsively to short-term price fluctuations.
3. Risk Management and Protection Against Volatility
Financial markets are inherently volatile, and prices can swing dramatically due to economic, political, or social developments. Understanding market fundamentals helps participants anticipate potential risks and adopt strategies to mitigate them. For instance, if an investor recognizes that rising interest rates may depress stock valuations, they can adjust their portfolio allocation to minimize losses. In commodities, awareness of seasonal production cycles and geopolitical risks can prevent exposure to adverse price movements. A strong grasp of fundamentals enables participants to develop contingency plans, hedge their positions, and navigate uncertainty with confidence.
4. Long-Term Investment Strategy
While technical analysis can be effective for short-term trading, long-term investing heavily relies on fundamentals. Investors focused on building wealth over years or decades benefit from understanding the underlying economic health of a company, sector, or country. For example, an investor considering an emerging market must evaluate GDP growth, political stability, inflation trends, and currency strength to make a prudent decision. Fundamental analysis allows investors to identify undervalued assets with growth potential, which can outperform the market over the long run. In essence, understanding fundamentals aligns investment choices with sustainable economic realities rather than temporary market hype.
5. Understanding Market Cycles
Markets operate in cycles influenced by macroeconomic factors such as inflation, interest rates, employment levels, and consumer sentiment. Recognizing these cycles is crucial for effective timing and strategy. For instance, during an economic expansion, stocks and commodities typically rise due to increased demand and corporate profitability. Conversely, during recessions, defensive assets like bonds, gold, or utilities may outperform. By analyzing market fundamentals, participants can anticipate cyclical patterns, position their portfolios accordingly, and capitalize on opportunities while minimizing losses during downturns.
6. Identification of Investment Opportunities
Market fundamentals serve as a powerful tool for spotting profitable opportunities. By studying supply-demand dynamics, global economic trends, and sector-specific developments, investors can identify assets poised for growth. For example, a surge in electric vehicle adoption can signal increased demand for lithium and cobalt, guiding commodity investors toward related markets. Similarly, technological innovation in healthcare or AI may indicate potential winners in the stock market. Without an understanding of these fundamentals, such opportunities may go unnoticed or be exploited poorly, leading to suboptimal returns.
7. Behavioral Discipline and Emotional Control
Emotions such as fear and greed often drive irrational decision-making in financial markets. Market participants frequently react impulsively to price volatility, rumors, or news headlines. A strong grasp of fundamentals instills discipline by providing a rational framework for evaluating opportunities and risks. When an investor understands the intrinsic value of an asset, they are less likely to panic during market dips or chase overpriced securities during rallies. This emotional control is critical for consistent performance and long-term success in the markets.
8. Adapting to Global Economic Trends
In today’s interconnected world, local markets are influenced by global events. Trade policies, geopolitical tensions, currency fluctuations, and international interest rates can affect asset prices worldwide. Understanding market fundamentals enables participants to interpret these global trends and adjust strategies accordingly. For instance, a rise in crude oil prices due to Middle Eastern tensions may impact not only energy companies but also sectors dependent on transportation or manufacturing. Traders and investors who comprehend these linkages can position themselves advantageously in response to global developments.
9. Enhanced Analytical Skills
Studying market fundamentals cultivates analytical thinking and critical reasoning. Investors learn to interpret financial statements, macroeconomic reports, and industry data to form actionable insights. These skills are transferable across different asset classes and markets, allowing participants to adapt to evolving financial landscapes. Furthermore, the ability to analyze fundamentals objectively reduces reliance on hearsay or speculative tips, empowering investors to take responsibility for their decisions.
10. Foundation for Technical Analysis
While technical analysis focuses on price patterns and market psychology, it becomes far more effective when combined with fundamental understanding. Knowledge of the underlying factors driving price movements provides context to technical signals. For example, a breakout in a stock chart may be more meaningful if supported by strong earnings growth or favorable industry trends. Conversely, ignoring fundamentals may lead to misinterpretation of technical patterns and result in costly mistakes. Integrating fundamental and technical analysis creates a holistic approach that maximizes the likelihood of successful trades.
11. Navigating Uncertainty and Market Crises
Markets are often affected by unexpected events such as financial crises, political upheavals, natural disasters, or pandemics. During such periods, prices may deviate significantly from historical norms. Investors who understand market fundamentals can differentiate between short-term shocks and long-term value, preventing panic-induced decisions. For instance, during the 2008 financial crisis, those who focused on the fundamental health of companies were able to identify undervalued stocks and make profitable investments while others succumbed to fear-driven selling.
12. Practical Applications Across Asset Classes
Understanding market fundamentals is not limited to stocks; it applies across all asset classes. In commodities, evaluating production, storage, consumption, and weather patterns is essential. In forex markets, analyzing interest rate differentials, inflation trends, and trade balances informs currency valuation. In bonds, credit ratings, yield curves, and monetary policies determine risk and return. Real estate investors consider macroeconomic growth, demographic trends, and regulatory policies. Across all these sectors, fundamental analysis forms the backbone of strategic decision-making, highlighting its universal importance.
13. Contributing to Financial Literacy
Finally, mastering market fundamentals contributes to broader financial literacy. Individuals become better equipped to understand economic news, corporate reports, and investment opportunities. This knowledge promotes responsible financial behavior, enabling informed decision-making in personal finance, retirement planning, and wealth management. Beyond individual benefits, widespread financial literacy fosters a more efficient and stable market, as participants base decisions on informed analysis rather than speculation and rumor.
Conclusion
In conclusion, understanding market fundamentals is indispensable for anyone participating in financial markets. It equips investors and traders with the knowledge to make informed decisions, manage risk, and develop long-term strategies. Fundamentals provide a lens to interpret market cycles, identify investment opportunities, and maintain discipline amid volatility. Moreover, they enhance analytical skills, facilitate integration with technical analysis, and enable navigation through global economic trends and crises. Across all asset classes, a deep comprehension of market fundamentals is the foundation upon which sustainable financial success is built. Ignoring these principles leaves participants vulnerable to speculation, emotional decision-making, and missed opportunities, whereas mastery of fundamentals fosters confidence, prudence, and consistent performance in the ever-evolving world of financial markets.
BTC/USD Supply Zone Rejection SetupThis BTC/USD 30-min chart shows price climbing within a rising channel toward a POI Supply Zone (114,201 – 114,940 USD). The market is respecting both the support line and rejection line while trading above the EMA 70 (111,733) and EMA 200 (112,102), indicating bullish momentum in the short term.
Key Analysis Using Strategies:
Trend/EMA Strategy: Price is above both EMAs, signaling bullish continuation until the supply zone.
Channel Strategy: Price is moving inside an ascending channel; upper channel resistance aligns with the supply zone, suggesting potential reversal.
Supply & Demand: Strong supply zone at 114,201–114,940 is the key resistance area to watch for rejection.
Price Action: After breakout from EMA and minor consolidation, price shows bullish structure with higher highs and lows.
Risk Management: Possible short entry at supply zone (114,201–114,940) with stop-loss above 114,940, and targets near 112,100 and 109,000.
📌 Summary: Short-term bullish toward supply zone, but a potential bearish reversal setup forms at 114,201–114,940 if rejection occurs, with downside targets around 112,100 → 109,000.

BTC/USD Bearish Retest Setup – Eye on 106.6K TargetTrend: BTC is in a downtrend channel (rejection line above, support line below).
EMA Signals: Price is trading below EMA 70 & EMA 200 → bearish bias remains strong.
Supply & Demand:
Support zone: around 112,000 – 112,500 (price just bounced).
RBR Supply zone: 114,300 – 116,000 where sellers are likely waiting.
📊 Strategies in play
Support–Resistance: Bounce at support, retest expected at supply zone.
EMA Strategy: Bearish since candles trade under 200 EMA.
Break & Retest: Price could retest supply before resuming drop.
Target Projection: If rejection at supply holds, target = 106,600 zone (chart target point).
⚖️ Risks
A clean break above 116,000 would invalidate bearish setup and open room for reversal.
Range trading possible between 112k–116k before breakout.
✅ Summary: BTC short-term bias remains bearish. Expect retest of 114.3k–116k supply before continuation lower toward 106.6k target. Only a strong breakout above 116k flips the trend bullish.

EUR/USD Bearish Rejection at Resistance Zone – Target 1.15392📉 EUR/USD 1H Chart Analysis
Trend: The chart is showing a clear bearish trend inside a descending channel (support & rejection lines). Price continues to respect this downward structure.
Resistance Zone: A strong supply/resistance area is marked at 1.16148 – 1.16307 (highlighted in pink). Sellers are likely to defend this zone.
Indicators:
Price is trading below the 70 EMA and 200 EMA, confirming bearish momentum.
EMA crossover suggests continued downward pressure.
Price Action: Recently, a small pullback (yellow highlight) is visible after touching the lower boundary of the channel, indicating a short-term retracement before another bearish push.
Strategy:
📍 Entry: Look for short entries near the resistance zone (1.16148 – 1.16307).
⛔ Stop Loss: Above 1.16456 (previous high / EMA resistance).
🎯 Target: First target 1.15392, aligning with the projected channel support and marked demand area.
✅ Summary:
EUR/USD remains bearish as long as price stays below the EMAs and inside the descending channel. Expect rejection from the resistance zone and continuation to the downside toward 1.15392.

Buy Mankind Pharma for 15% short term Mankind Pharma
Take entry Near 2600Rs
Target will be 3055( almost 16% upside)
Invest more at 2477
Mankind look likes very bullish
Double bottom pattern perform on up trendline.

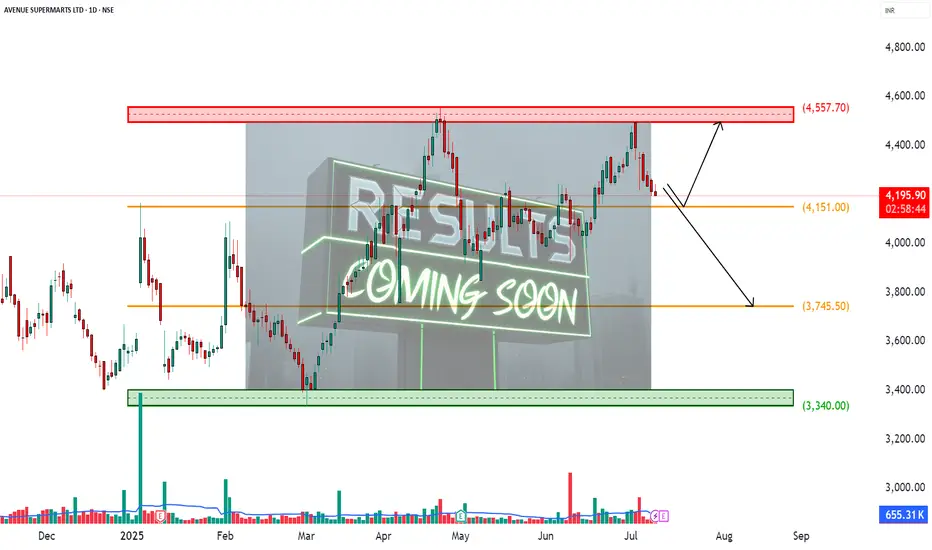
DMART – Earnings Incoming________________________________________________________________________________📈 DMART – Earnings Incoming: What’s the Right Time to Enter an Options Trade?
📆 Result Date: 11th July 2025 (Friday)
🕒 Strategy Style: Beginner + STWP HNI Learning Setup
🔍 For Educational Purposes Only
________________________________________________________________________________
🧠 What's the Setup?
DMART is announcing results on Friday, 11th July. We’re expecting a strong move — either up or down — because of mixed expectations around revenue and margins.
When you trade options around results, timing your entry is just as important as selecting the right strikes.
Let’s simplify it ⬇️ ________________________________________________________________________________✅ Option 1: Enter on 10th July (Thursday, After 2 PM)
💡 This is the ideal time for most traders.
🟢 Better option prices (not too inflated yet)
🟢 Good liquidity for smooth entry
🟢 Gives you overnight time to plan
🟢 You avoid the Friday panic crowd
🎯 STWP Suggested Strategy:
Buy 4300 CE + 4100 PE = ~₹180 total premium
This is called a Long Strangle – You win if the stock moves sharply up or down after results.
________________________________________________________________________________⚠️ Option 2: Enter on 11th July (Friday, Before 2 PM)
🔸 You might think, "Let me wait till Friday to get more clarity" — but there’s a catch:
❌ Option prices become expensive (high IV)
❌ Bid-ask spreads get wide (hard to enter)
❌ No time to react if results come intraday
❌ You’re stuck with weekend gap risk without prep
Unless you're experienced or scalping early, it’s not ideal for beginners.
________________________________________________________________________________🎯 Best Timing Rule – STWP Style:
📌 Enter on 10th July between 2:00 PM – 3:15 PM
Why?
You’ll lock in a clean setup with decent pricing and avoid stress.
📆 Exit Plan:
Hold through the weekend → Exit on Monday (14th July) if stock moves sharply 🔥
________________________________________________________________________________🧠 Alert:
Set alerts at:
₹4450 (Upside)
₹3950 (Downside)
If either hits on Monday, trail the winning side and exit the losing leg.
________________________________________________________________________________
📚 This is a learning example – not a trade recommendation.
Options carry risk. Please manage your capital and don’t trade blindly.
________________________________________________________________________________⚠️ Disclaimer (Please Read):
• This chart is shared for educational purposes only and is not investment advice.
• I am not a SEBI-registered advisor.
• The information provided here is based on personal market observation.
• No buy/sell recommendations are being made.
• Please do your own research or consult a registered financial advisor before making any trading decisions.
• Trading involves risk. Always use proper risk management.
________________________________________________________________________________
EUR/GBP 4H Bullish Breakout Trade Setup – Demand Zone to 0.85250📉 Trendline Break
🔵 A key trendline was broken 🔽 (bearish ➡️ bullish shift).
✂️ This break signals potential upside movement as sellers lose control.
🟦 Demand Zone (BUY Area)
📍 Zone: 0.83967 – 0.84249
🛒 Buyers expected here!
🟢 Price may pull back here before heading up.
🟡 This is marked as the ENTRY POINT zone.
🔴 Stop Loss Zone
📍 Level: 0.83977
❌ Place stop loss just below the demand zone.
🛡️ Protects against downside breakout risk.
🟧 Resistance Zone
📍 Around: 0.84500 – 0.84600
⚠️ Price may face resistance temporarily before continuing the upward move.
📏 Testing this area confirms strength.
🟩 Target Zone
🎯 Target Point: 0.85250
💸 If the trade plays out, this is where profit is expected.
🚀 Bullish target above the resistance zone.
✅ Trade Setup Summary
🧩 Details
🟦 Entry 0.84240 (inside demand zone)
🔴 Stop Loss 0.83977 (below demand zone)
🟩 Target 0.85250 (above resistance)
📈 R/R Ratio ~1:4 (great risk/reward!)
🔍 Final Outlook:
🟠 Watch for: Pullback to entry zone
🟢 Then look for: Bullish candlestick confirmation
🚀 Goal: Ride it up to 0.85250 with strong momentum

GOLD (XAU/USD) 4H CHART – BULLISH BREAKOUT TRADE SETUP🔵 Trendline Breakout 📈
📏 Price broke above a descending trendline, signaling a potential bullish reversal.
🔼 This breakout is often seen as a buy signal by traders.
🧱 Resistance Area 🛑
🔹 Price has entered and broken through a horizontal resistance zone.
🔄 This zone may now flip into support, adding confidence to the long setup.
🟧 Demand Zone 📦
📍 Marked between 3,267 – 3,298.
🛡️ Strong buying interest historically observed in this area.
📉 EMA (70) at 3,298.065 acts as dynamic support.
🟦 Entry Point 🚪
🎯 Entry Level: 3,322.930
🔄 Enter after retest confirmation or bullish candle above resistance.
🔴 Stop Loss ⛔
⚠️ SL Level: 3,267.993
💣 Below the demand zone and EMA — protecting against false breakouts.
🟩 Target Point 🎯
🚀 TP Level: 3,490.000
📌 Prior high zone — strong historical resistance expected here.
💰 Trade Setup Summary
✅ Buy Above: 3,322.930
❌ Stop Loss: 3,267.993
🎯 Target: 3,490.000
📊 Risk/Reward Ratio: Favorable (approx. 1:3)
🔎 Technical Confidence Levels
🔵 EMA Support ✅
🔵 Trendline Breakout ✅
🔵 Resistance Flip ✅
🔴 False Breakout Risk

U.S. Dollar Index (DXY) Bearish Setup – Supply Zone Rejection & 🔹 Trend Overview
📊 Overall Trend: Bearish (Downtrend)
📉 Price is forming lower highs and lower lows within a descending channel.
🔻 Recently bounced off a support zone, now heading toward a potential pullback.
🔵 Supply Zone (Resistance Area)
📍 Zone Range: 100.049 – 100.601
🧱 Acts as a resistance block where sellers might step in.
📏 Confluent with EMA 70 at 100.178, strengthening its validity.
🔸 Trade Setup – Short Position
🟠 ENTRY POINT: 100.088
❌ STOP LOSS: 100.587 – 100.595 (Just above supply zone)
🎯 TARGET: 98.000 (With intermediate support levels)
📌 Support Levels
🔹 98.112 – First minor support
🔹 98.106 – Close-range confirmation
🔹 97.885 – Additional support zone
🟦 Main Target: 98.000
⚖️ Risk/Reward Ratio
🟧 Small risk above supply zone
🟩 Large reward to downside = Favorable R:R
📌 Summary
📈 Expecting a pullback into supply zone.
🧨 Look for bearish confirmation around 100.088.
🎯 Target the downside at 98.000 for profit.

USD/CHF 4H Bearish Setup: FVG Rejection & EMA Resistance Strateg🔵 Chart Structure
🔻 Downtrend Identified
* Lower highs & lower lows forming.
* Resistance line sloping down 📉.
🧲 EMA 70 (0.82387)
* Acting as dynamic resistance 🔴.
* Price currently sitting just below it ⬇️.
💠 FVG (Fair Value Gap) — 0.82441 to 0.83097
* Price expected to fill the imbalance here.
* Confluence with resistance = 🔥 ideal sell zone.
🎯 Trade Plan (Short Setup)
🟦 Entry Point:
* 💥 0.82415
* Just under EMA + inside FVG zone.
🛑 Stop Loss:
* ❌ 0.83110
* Above FVG + above previous high = protected stop.
🎯 Take Profit:
* ✅ 0.80150
* Near prior demand zone + horizontal support.
* Target zone clearly marked in light blue 🧊.
⚖️ Risk-Reward Ratio
🎲 Estimated around 2.5:1 or better.
✅ High reward potential if resistance holds.
⚠️ Caution / Notes
🔎 Watch for bearish confirmation candles 🕯️ at entry zone.
📆 Be aware of economic news that could impact USD or CHF.
🧪 If price closes above 0.83110, setup becomes invalid ❌.
📌 Summary
Element Level Emoji
🔵 Entry 0.82415 💥
🛑 Stop Loss 0.83110 ❌
✅ Take Profit 0.80150 🎯
🔻 Trend Bias Bearish 📉
📐 Tools Used EMA, FVG, Resistance 📊

BTC/USD 4H Trade Setup – Demand Zone Reversal Play🔵 1. Demand Zone 🧲💎
📍 Range: 100,418.83 – 102,253.51
🟦 Strong support zone
💡 This is where buyers are expected to step in
📉 Price is currently testing this zone — potential reversal area
🚀 2. Entry Point 🎯
📍 Zone: 102,232.52 – 102,264.33
✅ Just above demand zone for safe entry
🧘♂️ Wait for bullish confirmation (wick rejections, engulfing candles)
🛑 3. Stop Loss 🔻
📍 Zone: 100,498.77 – 100,538.74
🔒 Below demand zone — protects you from false breakouts
⛔ Invalidates setup if price breaks below this level
🎯 4. Target Point 💰
📍 Target: 108,800.00
🧱 Major resistance zone
📈 Offers a solid Risk/Reward setup (approx. 1:4)
🪜 Possible take-profit scaling around 108,656.78 – 109,256.50
🔁 5. CHoCH – Change of Character 🔄
📍 Confirmed structural break above a lower high
🕵️♂️ Indicates shift from bearish to bullish
🔁 Needs confirmation with higher low near demand zone
📏 6. EMA 70 (Exponential Moving Average) 📉
📍 Level: 106,849.30
🔴 Price is currently below EMA = short-term bearish
🧗♂️ Reclaiming the EMA will strengthen the bullish bias
✅ Quick Summary with Emojis
📌 Plan:
🔵 Buy near: 102,250
🛑 Stop Loss: 100,500
🎯 Take Profit: 108,800
📊 Trend:
🔻 Bearish short-term (below EMA)
🔁 Potential reversal from demand zone
⚠️ Watch For:
🔍 Bullish confirmation at demand zone
🔄 Reclaim of EMA (106.8k)
🧱 Resistance near 108.8k

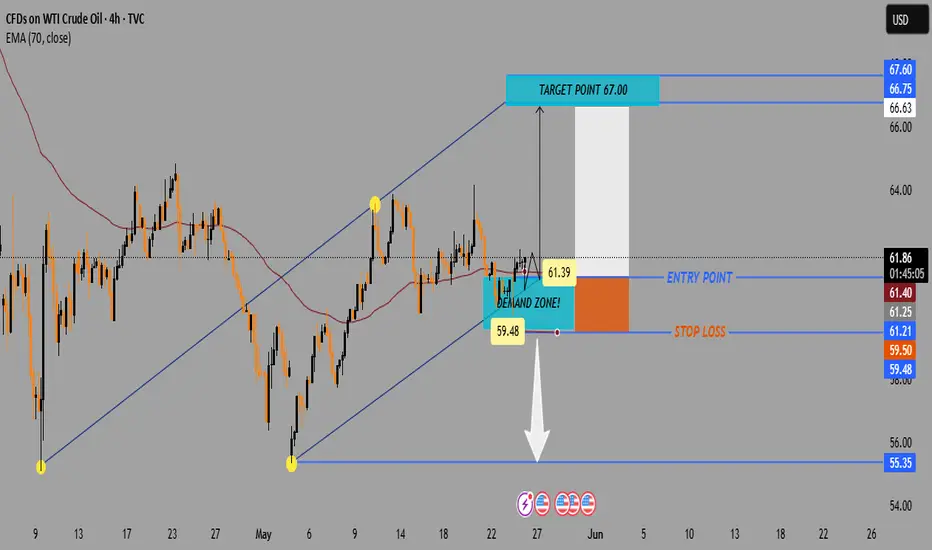
WTI Crude Oil 4H Chart – Bullish Setup from Demand Zone📈 Current Price: $61.74
🔵 Key Zones & Levels
🔹 Demand Zone (Buy Area):
🟦 $59.48 – $61.39
→ Price expected to bounce here
→ 🔄 Potential reversal zone
🔹 Entry Point:
🎯 $61.39
→ Ideal level to enter LONG
→ Just above demand zone
🔹 Stop Loss:
🛑 Below $59.48
→ Exit if price drops here
→ Protects capital
🔹 Target Point:
🚀 $67.00
→ Profit-taking zone
→ Strong resistance zone nearby:
* 66.63
* 66.75
* 67.60
📊 Indicators
📍 EMA (70): 🔴 61.40
→ Price trading above = bullish signal
→ EMA acting as support
📏 Trendline Channel:
🔼 Higher highs & higher lows
→ Supports uptrend continuation
📌 Trade Plan Summary
* Bias: 📈 Bullish
* Buy: At 61.39
* Stop: Below 59.48 🛑
* Target: 67.00 🎯
* Risk-Reward: ✔️ Favorable (~1:3)
🔍 What to Watch
* ✅ Bullish candles in demand zone
* 🔁 Retest of EMA or lower channel
* ❌ Avoid if it breaks below $59.48
Bitcoin (BTC/USD) 1H Chart Analysis – Double Top Signals BearishPattern Formed: DOUBLE TOP
⚠️ Bearish Reversal Pattern Spotted!
📍 Formed near 111,794.8
⬆️ Price tested the top twice and failed – strong resistance confirmed!
Key Zones:
🔶 SUPPLY ZONE (Resistance):
🟧 111,794.8 - 111,829.8
🔼 Expect selling pressure here!
🔷 SUPPORT Zone (Broken!):
🔻 Price fell below this level, confirming a bearish breakout
🟩 TARGET ZONE:
🎯 102,500.0
✅ This is the likely drop target based on the pattern
🧊 Other minor supports:
* 102,820.6
* 102,750.8
* 102,227.0.
Indicators:
📈 Trend Line
* Supported the price during the uptrend
* ❌ Now broken — indicates momentum shift
📉 EMA 70 (Red Line)
* Current Price (108,238.6) is below EMA 70 = 109,245.0
* Indicates bearish pressure.
Trade Setup:
🔽 Short Entry Idea: After support break
🛑 Stop Loss: 111,829.8
🎯 Take Profit: 102,500.0
⚖️ Risk-Reward looks attractive!
Summary:
📉 Bearish bias confirmed by:
* Double Top pattern
* Supply zone rejection
* Support break
* EMA crossover
🚨 Traders Watch Out: Bears are in control — next major stop likely at 102,500.0!

Silver (XAG/USD) Bullish Breakout Setup – 4H Chart Analysis📈 Bullish Setup
Key Zones & Levels:
🔵 Current Price: 33.48
🟣 EMA 70 (Support): 32.83
🔻 Acting as dynamic support
🟦 Demand Zone:
📍 32.54 - 32.83
🟢 Strong buying interest expected here
🟥 Resistance Zone:
📍 Around 33.48 - 33.60
⚠️ Breakout above this zone could trigger buying momentum
Trade Setup:
🚀 Entry Point:
🔵 33.11 - 33.12
🛑 Stop Loss:
🔻 32.54 (Just below demand zone and EMA)
🎯 Target (Take Profit):
🎯 35.50
✨ Potential gain if breakout confirms
Price Path Projection:
🔹 Scenario 1: Bounce from demand zone → Break resistance → Hit target
🟢➡️📈➡️🎯
🔸 Scenario 2: Immediate breakout above resistance
📈⚡➡️🎯
Summary:
Trend: Bullish
EMA and trendline support price
Risk/Reward is favorable
Watch for confirmation before entry

EUR/AUD Bullish Channel Trade Setup –Demand Zone Bounce Strategy📉 1. Downtrend Ends
🔽 Price was falling earlier (left side of chart)
🔄 Then it reversed at the bottom of the channel (yellow dot)
➡️ Trend Change Begins
📈 2. Uptrend Channel Forms
📊 Channel consists of:
🔵 Resistance Line (upper blue)
🟢 Support Line (lower blue)
🔁 Price is bouncing between these two lines like a pinball:
🔵 Resistance Line
| 🔼
🟢 Support Line
💠 3. Key Trading Zone
🔷 DEMAND ZONE: (Bright blue box)
🟦 Between 1.74697 and 1.75349
👉 Buyer interest expected here
🎯 4. Trade Setup (Bullish Idea)
🟢 Entry Point:
📍 1.75349
✨ Near support zone and channel bottom
🔻 Stop Loss:
🚫 1.74710
📉 Below the demand zone, protects from downside
🎯 Target Point:
🎯 1.77800
📈 Near the resistance line at the top of the channel
📊 Strategy Flow (Emoji Dots Path)
📉 🔽 🔽 🔽
🟡 Bottom found
⬆️ 🔼 🔼 🔼
📈 Enters channel
🟦 Price enters DEMAND ZONE
🔽
🔵 Entry: 1.75349
🔼
🎯 Target: 1.77800
✅ Final Thoughts
This is a clean bullish setup within a rising channel
✅ Wait for price action confirmation (like a bullish candle 🕯️) in the demand zone
🔒 Protect with your stop loss
🚀 Potential reward is strong if it bounces up

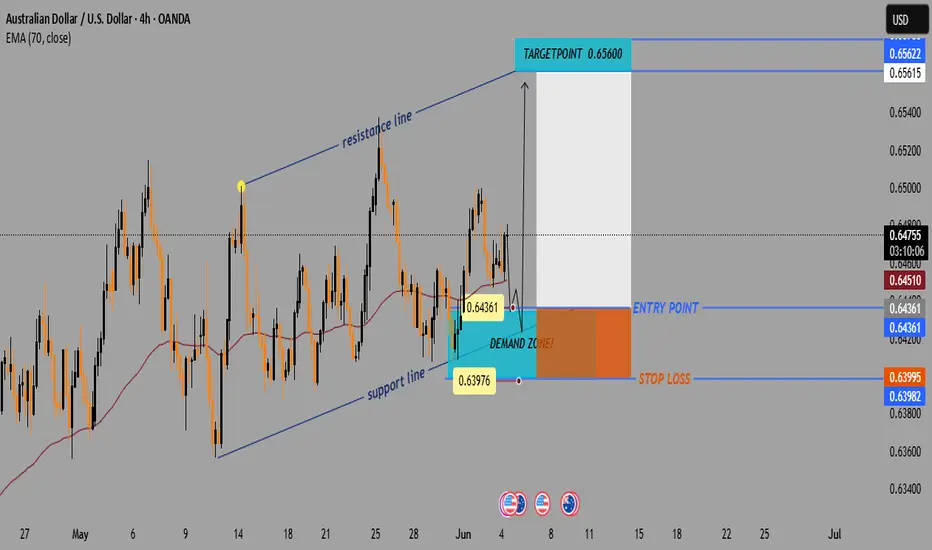
AUD/USD Bullish Setup: Demand Zone Bounce Toward 0.65600📈 Price Channel Analysis
🔼 The pair is moving within an ascending channel: • Support Line 🟦 – lower trendline showing bullish structure
* Resistance Line 🟥 – upper boundary acting as potential target
💡 This suggests bullish momentum is intact unless the price breaks below support.
📌 Key Trade Levels
🔵 Entry Point: 0.64361
* 👇 Positioned just above the DEMAND ZONE
* 📍Near the 70 EMA — a key dynamic support
🟨 Demand Zone: Area between 0.6400 – 0.6436
* 🧲 Buyers are expected here
* Good spot for a bullish entry
🔴 Stop Loss: 0.63995
* 🚨 Below the demand zone = limited risk
🟢 Target Point: 0.65600
* 🎯 Aligned with the upper resistance line
* Nice upside potential
⚙️ Technical Indicator
📉 EMA 70 (red line) = 0.64510
* Price is bouncing near it
* 📊 Acts as trend support — confirming buy idea
📊 Risk-to-Reward Ratio
🔻 Risk: ~36 pips (Entry → Stop Loss)
🔺 Reward: ~124 pips (Entry → Target)
✅ R:R Ratio ≈ 3.4:1 👍
🧠 Trade Idea Summary
📘 Trade Type 🔼 Buy (Long)
💰 Entry 0.64361
🛑 Stop Loss 0.63995
🎯 Target 0.65600
🌟 Bias Bullish
🔍 Final Thoughts
✅ Strong setup within a bullish channel
📉 EMA support + 🟦 Demand zone = Good confluence
📅 Watch out for USD news (see icons below chart)
Gold (XAU/USD) – Inverse Head & Shoulders Breakout Setup🧠 Chart Pattern Identified: Inverse Head & Shoulders
🟡 Left Shoulder ➡️ Formed at a local dip.
⚫ Head ⬇️ Deepest low around 3,274.103.
🟡 Right Shoulder ➡️ Bouncing near the same zone.
🔁 This is a classic bullish reversal pattern — a break above the neckline could signal a strong upside move.
📊 Key Levels & Zones
🔵 Support Zone:
🟦 Area: 3,274 – 3,294
✅ Strong bounce seen here (highlighted by the head and shoulders base)
🔵 Resistance Zone:
📏 Just below 3,305 (marked as neckline)
✋ Price must break this to confirm the reversal
🔵 Target Point:
🎯 3360 📈
📏 Based on the height from head to neckline
🔵 Stop Loss Zone:
❌ 3,274.526
🔻 Below the head for safe risk control
⚙️ Trading Setup Summary
🔹 📍 Entry Point:
📌 Around 3,294.449
🚪 Enter on breakout above neckline
🔹 🎯 Target Point:
🏁 3360
🔹 🛑 Stop Loss:
🚫 3,274.526
🔹 Risk-Reward Setup:
🔍 Targeting a move of ~65 points
⚖️ Risk of ~20 points → solid R/R ratio
📈 Indicator:
🧮 EMA 70 ➡️ 3,305.005
⏳ Price currently testing it — a break above EMA would boost bullish confirmation.
📅 Economic Events:
📆 Multiple event icons suggest upcoming news — expect volatility!
⚠️ Be cautious during these times.
✅ Final Thoughts:
📊 Pattern suggests a bullish breakout is near 🚀
🔒 Use stop-loss and enter after breakout to manage risk effectively
🎯 Keep an eye on volume during breakout — it confirms strength

EUR/USD4H Bearish Trade Setup Supply Zone Rejection with 3:1 RRR🔷 Trend Overview
📈 Price was in a rising channel (trend line + support line).
❌ Channel broken on downside → potential trend reversal.
🟧 🔼 Supply Zone (Sell Area)
📍 Zone: 1.13707 – 1.14432
🟠 Price faced rejection here.
💡 Institutional selling likely in this zone.
🔥 This is the ideal short-entry area.
🟦 🔽 Entry Point
🎯 Entry: Around 1.13694
🧩 Sits just below supply zone = safer trigger.
✅ Wait for a bearish confirmation candle before entering.
🟨 Support Level
📉 Support Zone: ~1.13100 – 1.13400
📊 Recently broken with a strong bearish candle.
🧱 Used to act as a floor, now may act as resistance.
🟩 🎯 Target Point
✅ Take Profit: 1.10970
📎 Matches previous structure support.
💰 Lock in profits before the psychological level at 1.1100.
🟥 ⛔ Stop Loss
❌ Stop: 1.14419
📏 Placed above the supply zone for protection.
🛡️ Shields from false breakouts or spikes.
⚖️ Risk-to-Reward Ratio (RRR)
💡 Approx. 3:1 ✅
📉 Risk: ~70 pips
📈 Reward: ~270 pips
🔥 High-probability setup
📌 EMA (Exponential Moving Average – 70)
📍 EMA 70 at 1.13102
🔻 Price is below the EMA → favors bearish momentum
🧠 Pro Tips:
🔍 Watch for bearish engulfing or rejection candles at the entry zone.
🗓️ Be aware of major news events (ECB, Fed).
🧮 Adjust lot size for risk management (based on SL size).
✅ Summary:
🧩 Element 📊 Value
Trade Type 🔻 Short (Sell)
Entry Point 📌 1.13694
Stop Loss ⛔ 1.14419
Take Profit 🎯 1.10970
RRR ⚖️ ~3:1
Sentiment 📉 Bearish

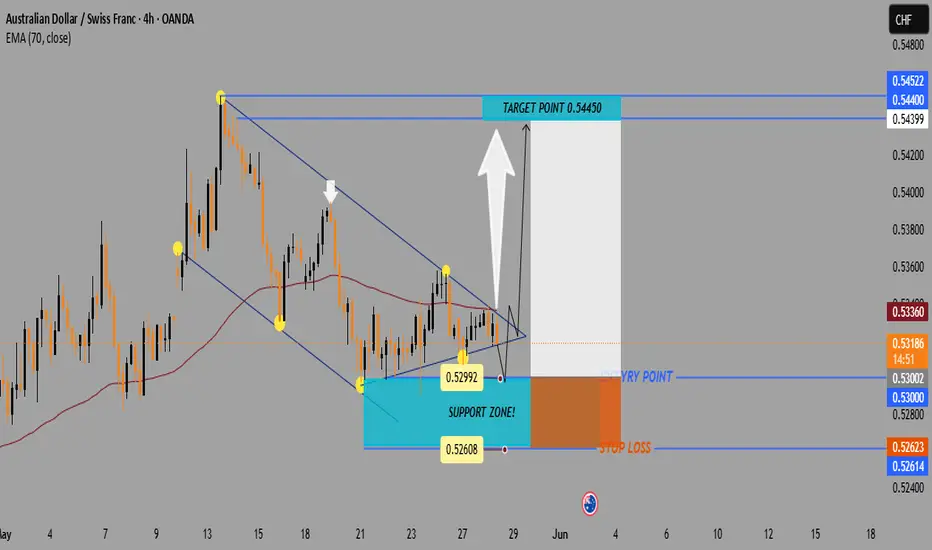
AUD/CHF Breakout Alert: Bullish Setup from Descending Wedge!🔻 Pattern: Descending Wedge
📐 Formed by lower highs and higher lows.
🟡 Indicates price compression — often a bullish breakout setup!
🔼 Breakout direction expected: UP
🟦 Support Zone
📍 Located around 0.52614 – 0.53000
📉 Price bounced multiple times here — strong buying interest
🛡️ Acts as a demand zone
🟢 Entry Point
🎯 Entry range: 0.53000 – 0.53188
💥 Breakout candle appears ready to close outside the wedge
⚡ Momentum may be building for a push higher
🎯 Target Point
🔵 Target: 0.54450
📈 Near recent highs — aligns with pattern breakout projection
🎉 Aiming for a good profit zone
🔴 Stop Loss
❌ Stop loss: 0.52623
🛑 Below the wedge and support — protects from a false breakout
⚖️ Keeps risk-reward ratio attractive
📊 Indicator
🧭 EMA 70 (Red Line) at 0.53360
🔄 Price hovering near it — crossing above = bullish signal
📌 Trade Setup Summary
🔸 Pair: AUD/CHF
🔸 Timeframe: 4-Hour (4H)
🔸 Pattern: Descending Wedge
🔸 Bias: Bullish
🔸 Entry: 0.53000 – 0.53188
🔸 Target: 0.54450 🟢
🔸 Stop Loss: 0.52623 🔴
✅ Conclusion
🚀 If price breaks above the wedge and EMA, this could be a high-probability long trade.
📏 Tight stop, wide target = good risk/reward setup!
EUR/CAD Bearish Setup – Supply Zone Reversal Trade Plan"Trend:
⬆️ Uptrend (past) → 🔄 CHoCH (Change of Character) → ⬇️ Potential Downtrend
1. Pattern Formed:
📐 Rising Wedge → Bearish Reversal Pattern
➡️ Price broke structure at the bottom = CHoCH ⚠️
2. Supply Zone:
🟧 Supply Zone = 1.56580 - 1.56602
🔄 Price may pull back here before dropping
📍This is your ENTRY ZONE
3. Trade Setup:
🔵 Entry Point:
* 1.56580 (Inside Supply Zone)
❌ Stop Loss:
* 1.57176
* Just above swing high & supply zone 🛑
✅ Take Profit Target:
* 1.54370
* Strong previous support zone 💰
4. Indicators:
📉 EMA (47) = Acting as resistance
* Price is currently below EMA ➡️ Bearish signal
TRADE PLAN OVERVIEW:
* 🎯 Entry: 1.56580
* ⛔ Stop Loss: 1.57176
* 💸 Take Profit: 1.54370
* ⚖️ Risk/Reward Ratio: 1:3 (Great!)
Summary:
* Wait for rejection or bearish candle in supply zone
* Enter short
* Ride it down to the target
* Manage risk smartly ✅

NZD/USD 4HChart Analysis:Bullish Reversal Setup from Demand Zone📈 Price: 0.59552
📊 EMA 70: 0.59410 (🟤 Brown Line)
Chart Zones & Key Levels
🔷 Resistance Zone:
🔼 Around 0.60298 – 0.60304
🔹 Price reacted strongly here (🔽 white arrows)
🔹 Acts as a ceiling for now
🟢 Demand Zone:
🔽 Around 0.58800
✅ Buyers stepped in here before
📉 If price drops again, might bounce from here
🟥 STOP LOSS:
❗ 0.58793
🔸 Protects from deeper losses if trend breaks down.
TRADE IDEA
1️⃣ Entry Idea: Wait for a pullback into the Demand Zone
📉⬇️
2️⃣ Bullish Reversal Expected:
⬆️ Bounce toward Target Zone
🎯 Target Point: 0.60300
🟦 Profit zone marked in blue
💸 Good Risk/Reward ratio.
Indicators & Pattern
📐 Wedge Pattern:
🔹 Bullish breakout potential
🔹 Currently respecting the channel
📉 EMA Crossover Area:
🔸 Could act as dynamic support/resistance
🟤 Price hovering around EMA (0.59410)
Summary:
✅ Buy Setup if price holds above 0.58800
🎯 Target: 0.60300
🛑 Stop Loss: 0.58793
⚠️ Watch the price reaction at the Demand Zone for confirmation!
