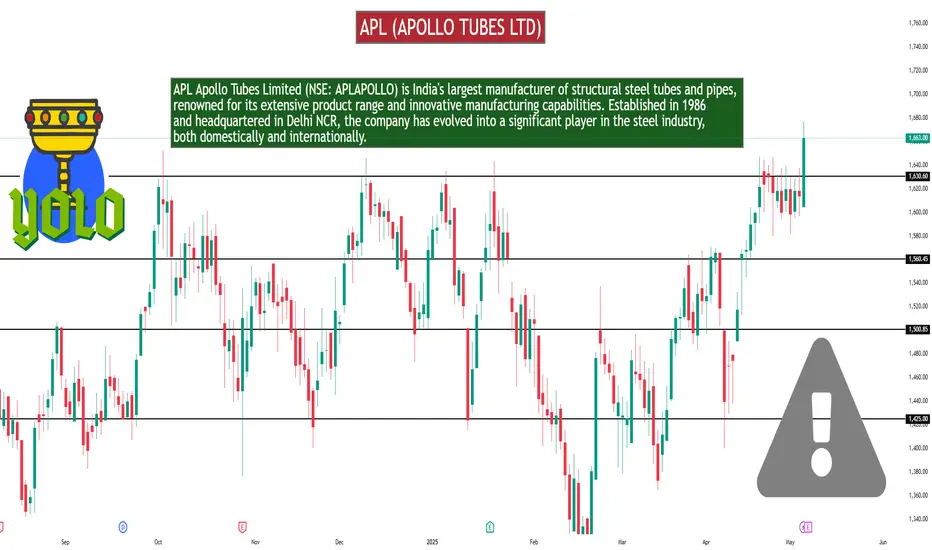
APL (APOLLO TUBES LTD)As of May 6, 2025, here are the key intraday support and resistance levels for APL Apollo Tubes Ltd (NSE: APLAPOLLO):
📊 Intraday Support & Resistance Levels
Standard Pivot Points:
Support Levels:
S1: ₹1614.17
S2: ₹1599.23
S3: ₹1580.17
Resistance Levels:
R1: ₹1648.17
R2: ₹1667.23
R3: ₹1682.17
Fibonacci Pivot Points:
Support Levels:
S1: ₹1614.17
S2: ₹1601.18
S3: ₹1593.15
Resistance Levels:
R1: ₹1635.18
R2: ₹1648.17
R3: ₹1656.20
Camarilla Pivot Points:
Support Levels:
S1: ₹1615.18
S2: ₹1612.07
S3: ₹1608.95
Resistance Levels:
R1: ₹1621.42
R2: ₹1624.53
R3: ₹1627.65
The current price of APL Apollo Tubes Ltd is trading above the Camarilla R3 and Fibonacci R1 levels, indicating strong bullish momentum. Traders may consider these levels for potential entry or exit points, keeping in mind that surpassing the R3 levels could suggest overbought conditions, while approaching S1 or S2 levels might indicate potential support zones.
Fundametal
Technical ConceptA "technical concept" refers to a specific idea or principle within a technical field, like engineering, computer science, or a specific industry. It's a fundamental building block that helps explain how something works, what it does, and why it's used. These concepts are often complex and require a certain level of technical understanding.

Tata Power Corporation Ltd // 3hour Support and ResistanceAs of May 3, 2025, here are the key 3-hour support and resistance levels for Tata Power Company Ltd (NSE: TATAPOWER):
📊 3-Hour Support and Resistance Levels
Level Price (₹) Type
Support 1 349.81
Support 2 348.43
Support 3 346.76
Resistance 1 352.86
Resistance 2 354.53
Resistance 3 355.91
These levels are derived from the classic pivot point method and are crucial for traders to monitor, as movements beyond these points may indicate potential changes in the stock's trend.
🔍 Technical Indicators
As of the latest available data:
Relative Strength Index (RSI): 44.03, indicating neutral momentum.
Stochastic RSI: 0, suggesting oversold conditions.
Commodity Channel Index (CCI): -133.29, reflecting bearish momentum.
Money Flow Index (MFI): 56.07, indicating neutral buying and selling pressure.
These indicators suggest a neutral to slightly bearish outlook for the stock.
📈 Strategy Considerations
Bullish Scenario: If the stock price maintains above the support levels, particularly Support 1 at ₹349.81, it may continue its upward movement towards Resistance 1 at ₹352.86.
Bearish Scenario: A drop below Support 1 could signal a potential reversal or consolidation phase.
Please note that these levels are based on historical data and should be used in conjunction with other technical analysis tools and market conditions.

Pidilite Industries
PIDILITE Industries is forming a Head and shoulders pattern on 4 Hour Time frame, although the chart is looking bullish and the price is also at a round number
support i.e., 3000, but as this indication is on 4 hour we cannot ignore it.
We will wait for the price to breakdown and let the first 30 min candle close below the neckline and do a retest or give us some confirmation candles.
We will also keep a eye, how price is rejecting from 3000 if it gives us some concrete confluences we will looking for long trades only, trend priority

bullish trend in NIFTYHOW TO TRADE ON NIFTY ON EXPIRY.
Nifty is making a bull run according to MACD of daily chart frame but as we know corona cases is increasing so at the end be cautious the market may fall.
behind the scenes:
FII BOUGHT 227CR DII BOUGHT 381CR.
EUROPEAN MARKET DAX shows negative sentiments.
SGX nifty is trading positive at the time of review
Advance to decline ratio is around 1276:645 in Nifty50
US market data is flat
Crude oil is trading at $59.54
Gold is trading at 1737 with flat view
US 10yr bond is flat at 1.669
Dollar index is also flat 92.37
OI For Nifty for the lower side are 14,800/ 14,700/ 14,600/ 14,500
OI for nifty on the upper side are 14,900/ 15,000/ 15,100/ 15,200
Maximum OI at 15,000
Max pain at 14800
what to expect:
Market may show a bull run but expected to come back after forenoon.
how to trade today:
1. Gap up opening
first possible resistance 14879
second 14949
third 14997
fourth 15048
2. Gap down
first possible resistance 14762
second 14734
third 14643
fourth 14535
3.flat opening
14819 is a crucial level to watch
This is an educational analysis no call is related to it.

Exide Ind for long RUNAll breakouts and targets are mentioned on the chart.
Do follow me for more swing & intraday call.
if you like my work you can also show by cheering.
Also, comments your views on this.
all the above analysis is my own, if anybody keeps an different opinion can also share.
trade on your own risk, analysis is just for educational purpose.
Thank you.

buy zone alert buy around 150 sl 125 target 210+ time frame 6month
We are not Registered with SEBI, Under RA Regulations. All Calls/Views posted here are for an Educational Purpose Only. Do your Own Analysis
