“Nifty 50 Intraday Key Levels | Buy & Sell Zones 29th Oct 2025”“Want to learn more? Like this post and follow me!”
26233🔴 Above 10m closing Shot Cover Level
Strong resistance — short covering likely above this.
26138🟠 Below 10m hold PE By level /
Above 10m hold CE by level
26028🟣 Above 10M hold positive trade view
Below 10M hold negative trade view
Sentiment deciding level — crucial for trend direction.
25913⚫ Above Opening S1 10m Hold CE By level
Bullish entry level — CE hold area.
25828🟠 Below Opening R1 10m Hold PE By level
Below 10m hold PE By Risky Zone Weak zone — PE may strengthen below this.
25690🟢 Above 10M hold CE By Safe Zone level
Safe bullish zone — CE can be held confidently above.
25670🔵 BELOW 10M hold UNWINDING level
Breakdown zone — unwinding or heavy selling possible below.
Future

“Nifty 50 Intraday Key Levels | Buy & Sell Zones 17th Oct 2025”“Want to learn more? Like this post and follow me!”
25832 🔴 Above 10m closing Shot Cover Level
Strong resistance — short covering likely above this.
25720 🟠 Below 10m hold PE By level /
Above 10m hold CE by level
25623 🟣 Above 10M hold positive trade view
Below 10M hold negative trade view
Sentiment deciding level — crucial for trend direction.
25523 ⚫ Above Opening S1 10m Hold CE By level
Bullish entry level — CE hold area.
25433 🟠 Below Opening R1 10m Hold PE By level
Below 10m hold PE By Risky Zone Weak zone — PE may strengthen below this.
25327 🟢 Above 10M hold CE By Safe Zone level
Safe bullish zone — CE can be held confidently above.
25318 🔵 BELOW 10M hold UNWINDING level
Breakdown zone — unwinding or heavy selling possible below.

“Nifty 50 Key Levels & Trade Zones – 30th Sept 2025”
“Follow me and like this post for more learning tips!”
Key Levels from the Chart
24,890 – Above 10M Closing Shot Cover Level
24,820 –Above 10M Hold CE by Entry Level
Below 10M Hold PE by Risky Zone
24,722 –Above 10M Hold Positive Trade View
Below 10M Hold Negative Trade View
24,590 –Above Opening S1 10M Hold CE by Level
Below Opening R1 10M Hold PE by Level
24,470 –Above 10M Hold CE by Level
Below 10M Hold PE by Level
24,370 –Above 10M Hold CE by Safe Zone Level
Below 10M Hold Unwinding Level

NIFTY Analysis – 23 july 2025 ,Morning update at 9 amNIFTY Technical Outlook Today
Pre-Market Insight
NIFTY spot closed below 24% false level
Short covering is visible – a bullish sign.
Watch for price behavior around 25150, a crucial level.
Market Scenarios Today
Bullish Possibility (If holds above 25150)
May open near 25150
May rise to 25219, then possibly up to 25298 if a Bottle. ki. neck ki tarah ka pattern forms.
squize pattern is expected today in bb band track this carefully.
Bearish Possibility (If fails to sustain above 25150)
Downside targets:
25014
24896
24807

Monday Trade Plan (Nifty 50) 🔼 Bullish Levels (Call Side Entry):
Above 25,008
🔹 Hold CE (Call) — Positive trade view.
Above 25,118
🔹 Hold CE by Entry Level
🚨 Below this: Risky Zone for PE (Put)
Above 25,218
🔹 10 min Closing Short Cover Level
✅ Strong momentum expected above this zone
🔽 Bearish Levels (Put Side Entry):
Below 25,000
🔻 Hold PE — Negative trade view.
Below 24,888
🔻 Opening R1 10m — Hold PE by level
Below 24,788
🔻 Hold PE by level
Below 24,688
🔻 Hold PE by Safe Zone level
Below 24,600 (Approx)
🧯 UNWINDING ZONE
🔻 Strong downward momentum expected
⚠️ Mid-Zone / Risk Areas:
Between 25,000 – 25,008: No clear direction
Between 25,088 – 25,118: Risky Zone for PE
Between 24,788 – 24,888: Rangebound area, watch for breakout

Nifty 50 Intraday Trade Plan July 15, 2025🔴 Upper Resistance Levels:
25,430.00
🔺 Above 10m closing: Short Cover Level
🔻 Below 10m: Hold PE (Safe Zone)
25,280.00
🔺 Above 10m: Hold CE (Entry Level)
25,240.00
🔻 Below 10m: Hold PE (Risky Zone)
25,160.00
🔺 Above 10M: Hold Positive Trade View
🔻 Below 10M: Hold Negative Trade View
🟢 Current Zone:
Market is trading near 25,087.10
Watch levels:
25,030.00 – Above Opening S1: Hold CE by level
25,000.00 – Below Opening R1: Hold PE by level
🟠 Lower Support Levels:
24,960.00
🔺 Above 10m: Hold CE by level
24,920.00
🔻 Below 10m: Hold PE by level
24,800.00
🔺 Above 10M: Hold CE by Safe Zone
24,760.00
🔻 Below 10M: UNWINDING Level
🔍 Strategy Suggestions:
✅ Bullish Bias:
If price sustains above 25,160, consider Call Option Buy (CE) or bullish trades.
❌ Bearish Bias:
If price fails below 25,030 or 24,920, consider Put Option Buy (PE) or short positions.

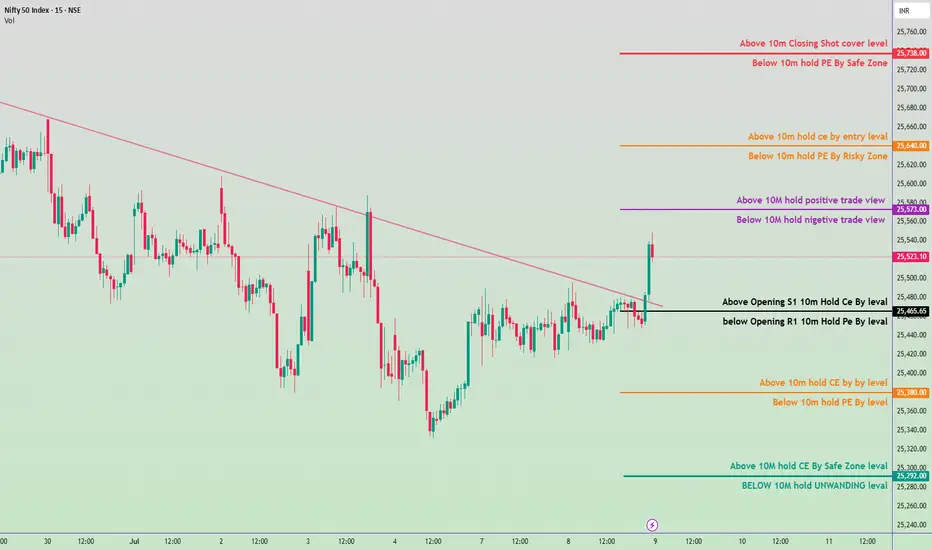
Nifty 50 Intraday Trade Plan for July 9, 2025🔴 Upper Resistance Zones (Short Covering Area)
🔺 25,738.00 – Shot Cover Level
If a 10-minute candle closes above this level, expect short covering – bullish breakout.
If price comes below this after testing, it's a safe zone to hold PE (puts).
🟧 25,640.00 – CE Entry Zone
Above this: Call options (CE) can be held.
Below this: Risky zone for holding PE, volatility may increase.
🟪 25,573.00 – Sentiment Zone
Above this: Positive trade bias.
Below this: Negative trade bias, indicating weakness.
⚫ Midpoint Zone (Opening & Pivot-Based Decision Area)
⚫ 25,465.65 – Opening + S1/R1 Zone
Above this level: Hold CE positions (bullish intraday setup).
Below this level: Hold PE positions (bearish setup).
🟠 Lower Mid-Level (Support/Breakdown Test)
🟠 25,380.00
Above: Intraday buy CE zone.
Below: PE can be held for more downside.
🟢 Bottom Support Zone (Safe Zone / Unwinding Zone)
🟢 25,292.00 – Safe CE Hold Zone
If the price holds above this level after 10 min: safe to hold CE.
🟢 25,282.00 – Unwinding Zone
Below this level: Risk of unwinding and larger sell-off increases.
📌 How to Use This Plan (Summary)
Wait for 10-minute candle confirmations near these levels.
Follow directional bias: CE (calls) if price sustains above levels, PE (puts) if price remains below.
Trade only after confirmation, not just touch.
Learn Option TradingOption trading is buying and selling contracts that give you the right (but not the obligation) to buy or sell a stock at a specific price before a certain date.
There are two types:
Call Option: You expect the stock price to go up.
Put Option: You expect the stock price to go down.
It’s like booking a movie ticket in advance—you can go if you want, but you don’t have to.

ABFRL seems goodABFRL seems good. It has given a breakout with accumulative volume. It is coming out from range

Bank Nifty: Unveiling Next MovesIdentified a channel and consolidation mark.
Marked levels for upward and downward movements.
Anticipating the upcoming developments in Bank Nifty.
Stay tuned for the unfolding narrative. 📊🔄 #BankNifty

fin nifty futures short side fin nifty futures short side setup
entry level near the 19550-60
target level 100 points
stop loss above of the candle i.e 19580(19590)

what should we expect of nifty future ahead?NSE:NIFTY1! nifty future and nifty has shown false breakout structure on weekly timeframe, should it break the weekly support we may see nifty future and nifty move downwards till 18800/700 levels.

Ashok Leyland NSE: ASHOKLEYMajor points of Ashok Leyands are marked in the chart.
Disclaimer: Only for education purpose, do own alaysis before investing in stock market.

Update on BrentBrent had moved up to 78.5 and down now to 77.4 . To book profit at 77 was expected.
If trade is not closed then booke profit and wait for next analysis. Buy was given at 74 $
Brent target was given @ 82. Since crude is highly dependend on external news precautionary measures is taken.
Trade crude on your own risk management.

Bank nifty Futures 22nd June 2023Let's see how the day opens tomorrow. Price action should be watched, and a decision taken accordingly.
Will try and give some live market updates.
Keep following to understand the significance of these lines drawn and how and why these lines are very important.
Please go through the previous charts and check the price action and how these lines responded vis a vis the days open

Aarti Ind - Short term viewThe above chart is the single point of view to understand the movement of the stock. In the past few weeks, the stock is trading in a small range.
According to the above setup, if rises above 425-430, may go bullish up to 610 or even 730.
If breaks down to 470 and sustains below, may go to 350 levels.
This is only for learning and sharing purposes, not a bit of trading advice in any form.
Please share your views about the study, especially if you don't agree with my approach.
All the best.

NIFTY FUTURE INTRADAY LEVELS FOR 8TH MAY 2023Nifty Future Intraday Levels For 8th May 2023
Disclaimer - All The Levels Are Only For Educational Purpose.
Do Your Own Analysis Before Trade.

Piramal may be a good pickThe stock is trading in a price range for the last five months. This time again at the lower levels. If able to sustain above 780 levels, may be bullish in coming sessions. The buy scenario is open only above 780. Keep it on the radar.
Only for learning and sharing purposes, not a piece of trading advice in any form.
All the best.

OP scalable L2 blockchain (passive)OP is a fast, stable, and scalable L2 blockchain.
The growth shown by OP is last few days is excellent. It might not be wrong to say OP is leading L2 blockchain because of growth.
This has a very bright chart ahead.
All goes well with BTC, we could see $4+ in no time.
Its very good to enter now, with a proper SL.

sgx nifty 50 futurefibonacci channel finding
high and low rejection or out points,
18000-19000 future market ( shown fib channel).
similar point to break out for all time high.
or not.
goodluck fii data shown low selling but not toomuch ,

Best Stock For Future 350 to 1000 Going Hey Guy's What's up
Here is a Best Stock To Hold For Bright Future
So this stock is going to take takeoff get in to this!!!!!!!!
And it's
ABFRL (Aditya Birla Fash
NSE:ABFRL

SGX Nifty possibilities of long and short trades.This is an Idea of SGX Nifty probabilities on a Long note.
Fibo retracment :
Lets start with basi Fibo retracement, from point A to B , which is already at 38.2%, now we all know if this is going to be a strong bull trend there will be a possible reversal at this level or
a possible reversal will be at 50% which comes around 17238 - 16938 .. it doesnt have to be 50% it may even take a reversal at 61.8% as well.
Pitchfork :
A valid Pitchfork has been broken and trigger line has been rejected (Normal terms we call it trendline)
2 possibilities here: One, this could be a retest of the broken pitfork line which is absolutely at fibo 50% which can only be known once it reaches that area of horizontal support
Two, this could be a downtrend after getting rejected by the trendline at point B.
H&S Pattern :
There is an Head and shoulder pattern in formation which could take support at Fibo 50% and revert back to the trendline, if this happens and a breakout of trendline is seen, target is mentioned on chart.
lets say H&S is not formed, trendline or pitchfork parallol line still acts as a strong resistance, or breaks pitchfork and rejects at trendline, that is going to be a 3rd time rejection of this trendline,
we might see a stong move downside once again. which i called alternate possibility.

Banknifty April Future -Intraday 20.04.2022Please follow levels and trade, all trades are for educational purpose only.
