Weekly analysis of XAUUS/Gold with buy and sell scenarios...Gold has reached to Level 2 as we analysed few weeks back.
Gold has created a strong weekly momentum candle showing positive sentiment. But there is divergence with volume. Candle is strongest amongst last four weekly candles while volume is lowest. On daily time frame there are consecutive 5 buy candles. RSI is also over 80 and oversold All these brings a caution
So, price may take a pause or pull back to adjust pricing. Now we need to be cautious and plan for rangebound pull back.
1. Price has created higher highs in lower time frames and created micro structures.
2. Now price may pull back with some delivery change in lower time frames.
3. Still, we should be positive till delivery changes at 4H/1H TF.
4. Most probably price will take liquidity of FVG/RDRB level and create MSS/CISD/TS/iFVG in LTF.
5. Price should show rejection/reversal in respective LTF (4H/1h/15m) at FVG zone.
6. Take the trade only once clear entry model i.e. turtle soup. iFVG break, CDS or MSS happens on LTF
All these combinations are signalling a high probability and high RnR trade scenario.
Note – if you liked this analysis, please boost the idea so that other can also get benefit of it.
Also follow me for notification for incoming ideas.
Also Feel free to comment if you have any input to share.
Disclaimer: This analysis is for educational purposes only and does not constitute investment advice. Please do your own research (DYOR) and check with your financial advisor before making any trading decisions.
Fvg

Nifty weekly analysis - Detailed Last week Nifty had strong downfall of ~3% because of various factors including global events and selling of FIIs. Week closed with a strong bearish candle with heavy volume showing further downside pressure targeting near draw on liquidity of ~24600. This level has highest volume, which will act as magnet for price.
Order flow is also downside creating lower highs.
Currently price is inside weekly price imbalance zone and at a psychological number of 25000. So, we can expect a pause at this level for few days. So next week may go in range bound mode to bearish.
Over all sentiments are bearish until there is a big positive change appears in global politics.
Critical points ……………….
• Support zone: 24,580–25,050
• Resistance zone: 25,550–25,600
• Bias: Range-bound to mildly bearish for the coming week.
1. If breakout support with volume we may see 24600 levels soon.
Note – if you liked this analysis, please boost the idea so that other can also get benefit of it.
Also follow me for notification for incoming ideas.
Also Feel free to comment if you have any input to share.
Disclaimer: This analysis is for educational purposes only and does not constitute investment advice. Please do your own research (DYOR) and check with your financial advisor before making any trading decisions.

Trump Imposes Tariffs on EU – Gold Creates a R Market Context
Trump’s announcement of new tariff measures on EU goods has triggered a strong risk-off wave, pushing capital out of risk assets and into Gold as a safe-haven.
The USD shows mixed reactions, while Gold rallies sharply and forms a rare bullish GAP, clearly reflecting defensive market sentiment.
The key question now is not whether Gold is strong or weak, but:
Will this GAP be filled, or held for trend continuation?
Technical Structure (H1)
The broader structure remains bullish, confirmed by multiple Breaks of Structure (BOS).
The latest impulsive move has created a bullish Fair Value Gap (GAP) above the equilibrium zone.
Price is currently holding above the FVG, with no clear acceptance back into lower levels.
➡️ In a geopolitical and trade-risk environment, GAPs are not required to be filled immediately.
Decision Zones
Upper FVG / GAP: 4,634.188
Equilibrium Zone: 4,619.928
Lower Support / GAP Base: 4,596.602
Scenarios (If – Then)
Scenario 1 – GAP Holds & Continuation
If price holds above 4,619.928, the GAP remains protected.
Bullish continuation toward higher levels becomes likely as safe-haven flows persist.
Scenario 2 – Technical GAP Fill
If price loses 4,619.928, a retracement toward 4,596.602 is likely for rebalancing.
Only a clear H1 close below 4,596.602 would confirm a deeper GAP fill.
Summary
Trade-related confrontation is changing price behavior, causing Gold to react more aggressively than usual.
At this stage, the GAP represents the decision point between continuation and correction.
Reaction at the GAP will define the next move.
Trade the reaction, not the headline.

Weekly Analysis with buy/Sell scenarios in Gold/XAUUSDAt weekly time frame Gold has shown sharp and strong reversal candle and closing below the low of previous week. This is signifying change in delivery to downside. Monday has created a strong downside side fall and remaining days went in consolidation mode. Consolidation has effect of year end as well. Price has created SIBI at daily time frame. So we can expect a pullback till SIBI and downfall till DOL (Draw on Liquidity). If price breaks new high, we can expect up move towards the levels of 4720 and 4900.
We should keep eye on both the scenario.
Critical notes.
1. Price may show some consolidation or direct pull back till daily SIBI.
2. If price retraced till SIBI and develop LTF entry model. This may be a good sell scenario.
3. If price breaks and sustains above SIBI and/or all-time high. We may witness further up move till the levels mentioned above.
4. Most probably price will take liquidity of FVG/RDRB level and create MSS/CISD/TS/iFVG in LTF.
5. Price should show rejection/reversal in respective LTF (1h/15m) at FVG zone.
6. Take the trade only once clear entry model i.e. turtle soup. iFVG break, CDS or MSS happens on LTF
All these combinations are signaling a high probability and ~8/10R trade scenario.
Note – if you liked this analysis, please boost the idea so that other can also get benefit of it.
Also follow me for notification for incoming ideas.
Also Feel free to comment if you have any input to share.
Disclaimer: This analysis is for educational purposes only and does not constitute investment advice. Please do your own research (DYOR) and check with your financial advisor before making any trading decisions.

XAUUSD (D1) – Elliott ABC pattern activeLana sells the pullback, waits to buy at major liquidity 💛
Quick summary
Timeframe: Daily (D1)
Elliott view: Price is likely developing an ABC corrective structure after a strong rally
Strategy: Sell the B-wave pullback into supply, buy only when price returns to strong liquidity
Context: Precious metals started 2026 strong, but short-term volatility and re-accumulation swings are still expected
Fundamental backdrop (supports the bigger trend)
Gold and silver opened 2026 with strong momentum, extending the best run since the late 1970s. Goldman Sachs remains bullish on precious metals and continues to highlight an aggressive long-term target (around $4,900 for gold).
Lana’s key point: the long-term bull cycle can remain intact, but the market still needs healthy corrections to reset liquidity and build new structure.
Technical view (D1) – Elliott ABC structure
On the Daily chart, after the powerful top, gold dropped sharply, forming a clean Wave A. The current structure suggests:
Wave B: a corrective rebound into resistance/supply
Wave C: a potential move back down into liquidity zones before the next major direction is confirmed
This ABC lens helps avoid getting trapped when the news looks bullish, but price is still in a corrective phase.
Key levels from the chart
1) Sell zone (B-wave supply)
Sell: 4435 – 4440
This zone aligns with marked resistance and a Fibonacci pullback cluster (0.236 / 0.382). If price retraces here and shows rejection, it’s a strong area to look for B-wave selling pressure.
2) Buy zone (major liquidity – potential C-wave completion)
Buy Liquidity: 4196 – 4200
This is the strongest liquidity area on the chart. If Wave C plays out, Lana will look for buying opportunities here with clearer risk control.
3) Deeper accumulation liquidity
Accumulate liquidity: the lower accumulation area highlighted on the chart
If the market sweeps deeper than expected, this is the region where longer-term buyers may step in.
Trading plan (Lana’s approach)
Primary idea: Sell rallies into 4435–4440 if price shows weakness (B-wave rejection).
Primary buy plan: Wait for price to revisit 4196–4200 and confirm support (liquidity absorption).
If price breaks and holds above the sell zone, Lana stops selling and waits for a new structure to form.
Note on early-year behavior
The first weeks of the year often bring “messy” moves as liquidity returns and positioning resets. Lana will only trade at planned zones and avoid entries in the middle of the range.
This is Lana’s personal market view and not financial advice.

HFCL BY KRS CHARTS17th September 2025 / 9:21 AM
Why HFCL?
1. First of all, its second time it's in my radar, previously we had more than 40% Return on this one and still long-term Target has been still loading 225 Rs.
2. 1M TF is making Higher High with current price level previously it breaks from flag pattern and gave upside move.
3. As we cand see in chart i have mentioned FVG range for 1M tf which was expected fall to be fill that FVG and it did.
4. Further, along with FVG filling 1W & 1D tfs is showing bullish divergence within range.
5. Volume is above avg with Morning Star Candle Breakout showing more bullish signs.
SL & Target is mentioned ‼️
** Attached Previous View on HFCL also go check it out**

Weekly Analysis of BTC with Buy/Sell scenarios...BTC prediction of last week just worked perfectly well and market kept in consolidation mode itself. BTC is still in consolidation zone and may spend some more days. It may develop ABC pattern or reversal at identified daily FVG level, if price has to change its delivery and take turn from here. This zone is kind of make or break. If price is not able to sustain and breakdown, then it may witness ~65-70K levels as well.
We hope for reversal from this level as price is developing the pattern at higher time frame.
1. Price has taken liquidity or 82K and almost touched 80K.
2. It has inversed 1Day FVG and now price is consolidating in the range between EMAs.
3. We may expect price retracement till 1D iFVG and then reversal.
4. Before to that we may see sweep of 92900 (1D CISD) level and then a retracement short trade till 1D FVG
5. Most probably price will take liquidity of FVG/RDRB level and create MSS/CISD/TS/iFVG in LTF.
6. Price should show rejection/reversal in respective LTF (5m/15m) at FVG zone.
7. Take the trade only once clear entry model i.e. turtle soup. iFVG break, CDS or MSS happens on LTF
All these combinations are signaling a high probability and ~6R trade scenario.
Note – if you liked this analysis, please boost the idea so that other can also get benefit of it.
Also follow me for notification for incoming ideas.
Also Feel free to comment if you have any input to share.
Join me on live stream for real time update.
Disclaimer: This analysis is for educational purposes only and does not constitute investment advice. Please do your own research (DYOR) and check with your financial advisor before making any trading decisions.

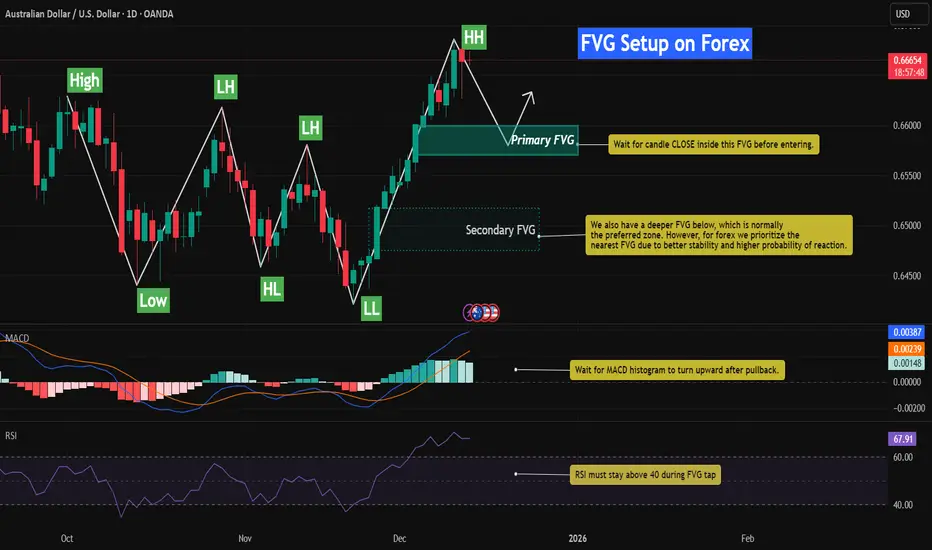
Bullish FVG Retracement With RSI & MACD📈 AUDUSD – Bullish FVG Retracement With RSI & MACD Momentum Confluence
This chart highlights a well-defined bullish structure on AUDUSD, characterized by a sequence of Higher Lows (HL) followed by a clean Higher High (HH). The latest impulsive leg upward created multiple Fair Value Gaps (FVGs), each formed by sharp displacement that left behind inefficiencies in price.
As price extends higher, the nearest unmitigated FVG becomes the primary area of interest. This imbalance represents the most logical level for a corrective retracement before bullish continuation resumes.
While a deeper FVG exists below, the nearest imbalance tends to offer stronger stability and higher probability in forex due to tighter liquidity behavior and more frequent shallow retracements.
In this setup, the combination of FVGs + RSI Behavior + MACD Histogram provides a high-confluence framework for identifying discount retracement zones and timing momentum re-acceleration.
⸻⸻⸻⸻⸻⸻⸻⸻⸻⸻
📊 Key Observations
1️⃣ Recent Bullish FVG Creation
The most recent impulsive leg upward generated a clear bullish FVG.
AUDUSD responded strongly to displacement, confirming active buy-side order flow.
Price has not yet returned to rebalance this inefficiency, making it the most probable retracement magnet.
2️⃣ Primary FVG (High-Probability Zone)
The upper FVG has the strongest confluence:
Formed by strong bullish displacement
Closest imbalance to current price (forex tends to fill nearest inefficiency first)
Aligns with bullish structure (HL → HH progression)
RSI remains elevated, signaling temporary overextension before a healthy pullback
MACD histogram shows slowing momentum, suggesting a cooling phase before continuation
This makes the upper FVG the most structurally significant level for a bullish reaction.
3️⃣ Secondary FVG Below
A deeper FVG also exists, but:
Formed during a smaller displacement
Much lower probability in forex due to shallower retracements
Carries less relevance unless the primary FVG fails
Momentum and structure currently favor reacting to the nearest imbalance
The zone may still attract price in extreme volatility, but it is not the main expectation.
4️⃣ RSI Behavior (Pullback Confirmation)
RSI is currently near the overbought region, indicating:
Market is stretched after a strong rally
A retracement is healthy and expected
During FVG entry, RSI must stay above 40 to maintain bullish structure and prevent a reversal signal
This acts as a structural momentum filter.
5️⃣ MACD Histogram Confirmation
MACD histogram is showing:
Momentum deceleration
A potential shift to light-green bars as price cools
A bullish continuation signal expected once the histogram begins turning upward from the pullback
Together, this confirms the classical model:
impulse → slowdown → retracement → continuation.
6️⃣ Structural Context
AUDUSD maintains a clean bullish sequence:
HL → HH progression
Deep liquidity sweep in the previous leg
Strong displacement aligned with bullish flow
As long as price holds above the FVG and prior HL, pullbacks are more likely to act as rebalancing events, not reversals.
⸻⸻⸻⸻⸻⸻⸻⸻⸻⸻
📊 Chart Explanation
Symbol → OANDA:AUDUSD
Timeframe → 1D
This chart illustrates how Smart Money Concepts blend with momentum indicators:
Clean HL → HH bullish structure
Fresh bullish FVG acting as primary discount zone
Secondary FVG present but lower probability in forex
RSI signaling temporary exhaustion before a pullback
MACD histogram confirming momentum slowdown into the FVG
Expected sequence:
displacement → inefficiency → retracement → mitigation → continuation
Price remains bullish unless structure breaks below the HL and the FVG fails to hold.
⸻⸻⸻⸻⸻⸻⸻⸻⸻⸻
📘How RSI & MACD Strengthen FVG Setups (Bullish & Bearish)
🔹 1. RSI + FVG
Bullish Setup:
RSI holding above 40 during the retracement confirms bullish structure.
Rising RSI from oversold strengthens the likelihood of continuation.
Bearish Setup:
RSI staying below 60 during the pullback confirms bearish structure.
Falling RSI from overbought increases the probability of downside continuation.
RSI shows whether the retracement is a healthy correction or a potential reversal.
🔹 2. MACD Histogram + FVG
Bullish Setup:
Decreasing histogram during the retracement = healthy cooldown.
Histogram turning upward inside or after the FVG = bullish continuation signal.
Bearish Setup:
Increasing histogram during the pullback = losing bearish momentum temporarily.
Histogram turning downward again at the FVG = bearish continuation confirmation.
MACD provides momentum timing for the reaction out of the FVG.
🔹 3. Combined Logic (Works Both Ways)
Displacement creates an FVG
Price retraces into the imbalance
RSI respects structural boundaries (bullish >40, bearish <60)
MACD momentum aligns with the trend direction
Price rejects the FVG and continues the trend
This combined approach filters low-quality FVG zones and identifies the highest-probability continuation setups in both bullish and bearish markets.
⸻⸻⸻⸻⸻⸻⸻⸻⸻⸻
⚠️ Disclaimer
📘 For educational purposes only
🙅 Not SEBI registered
❌ Not financial or investment advice
🧠 Smart-Money-Concepts explanation only
OBV + MACD Confirmed FVG📉 Bitcoin – Bearish FVG Retracement With EMA200, OBV & MACD Momentum Confluence
This chart highlights a clean bearish structure on BTC, defined by a consistent sequence of Lower Highs (LH) and Lower Lows (LL). Throughout this downtrend, multiple Fair Value Gaps (FVGs) have formed — each created by sharp institutional displacement that leaves behind inefficiencies in price.
As price continues trending below the EMA200, bearish order flow remains firmly intact. Each time BTC retraces into an unmitigated FVG, the market efficiently rebalances the imbalance before resuming downward continuation.
In this setup, the integration of FVGs + EMA200 + OBV + MACD Histogram builds a high-probability roadmap for identifying premium retracement zones and anticipating continuation moves.
The major FVG above current price sits directly under the EMA200 and aligns with weakening OBV momentum. This makes it the most structurally significant bearish reaction zone. A secondary FVG exists below it, but carries less importance due to weaker displacement and reduced confluence.
⸻⸻⸻⸻⸻⸻⸻⸻⸻⸻
📊 Key Observations
1️⃣ Prior Bearish FVG Reaction
A previously formed bearish FVG was cleanly mitigated, followed by immediate downside continuation.
This confirms that institutional order flow remains bearish and that FVG zones are functioning as efficient retracement magnets in the current trend.
2️⃣ High-Priority FVG Under EMA200 (Primary Zone)
This upper FVG has the strongest confluence:
Formed by strong bearish displacement
Sits directly below the EMA200, reinforcing trend direction
Aligns with market structure (LH → LL sequence)
OBV shows weakening buying pressure as price approaches the zone
MACD histogram is decreasing into FVG, signaling bearish momentum shift
This makes it the most likely level for a significant rejection if price retraces into it.
3️⃣ Secondary FVG Reaction Zone
A lower FVG also exists, but:
Formed during a smaller displacement
Does not align with EMA200 rejection
Carries weaker structural significance
It may still produce a minor reaction, but is lower probability compared to the primary FVG above.
4️⃣ OBV Momentum Context
OBV declines as price approaches the FVG, which is a critical confirmation.
When OBV decreases during a retracement, it signals absorption of buy-side pressure → strengthening the bearish continuation case.
5️⃣ MACD Histogram Confirmation
MACD histogram is rolling over and turning negative as price pushes toward the FVG.
This confirms bearish momentum returning, increasing the probability of a strong rejection from imbalance.
6️⃣ Structural Context
BTC maintains a clean LH–LL bearish sequence.
As long as price remains under the EMA200 and below the unmitigated FVGs, retracements are more likely to act as rebalancing moves rather than true reversal attempts.
⸻⸻⸻⸻⸻⸻⸻⸻⸻⸻
📊 Chart Explanation
Symbol → BITSTAMP:BTCUSD
Timeframe → 1D
This visualization demonstrates how Smart Money Concepts and momentum indicators align within a trending environment:
Clear LH → LL market structure
Multiple historical FVGs acting as premium retracement zones
A previously mitigated FVG confirming downside continuation
A high-confluence bearish FVG below the EMA200
OBV weakness during retracement phases
MACD histogram declining into FVG retest
Together, these elements create a textbook sequence:
displacement → inefficiency → retracement → mitigation → continuation
Price remains bearish unless BTC can break and close above the upper FVG with strong momentum and volume.
⸻⸻⸻⸻⸻⸻⸻⸻⸻⸻
📘 How EMA200, OBV & MACD Strengthen FVG Setups (Bullish + Bearish)
🔹 1. Trend Filter: EMA200
Below EMA200 → look for bearish FVG rejections
Above EMA200 → look for bullish FVG reactions
EMA200 acts as a dynamic mean-reversion anchor during trending markets.
🔹 2. OBV + FVG
OBV declining on FVG retest → bearish continuation
OBV rising into bullish FVG → bullish continuation
Volume trend strengthens or invalidates FVG reactions.
🔹 3. MACD Histogram + FVG
Falling histogram → bearish FVG confirmation
Rising histogram → bullish FVG confirmation
MACD shows whether momentum aligns with the imbalance.
🔹 Combined Logic (Works Both Ways)
Displacement creates an FVG
Price retraces into the FVG
Trend filter (EMA200) agrees
OBV + MACD confirm volume + momentum direction
Price rejects and continues trend.
⸻⸻⸻⸻⸻⸻⸻⸻⸻⸻
✅ Summary
Market structure remains bearish with LH → LL continuity
A previously filled FVG validated downside continuation
The upper FVG is the highest-probability zone (EMA200 + OBV + MACD alignment)
The secondary imbalance carries lower significance
OBV and MACD both confirm weakening buyer pressure into FVG
As long as BTC stays below EMA200, retracements into FVG are likely continuation setups
⸻⸻⸻⸻⸻⸻⸻⸻⸻⸻
⚠️ Disclaimer
📘 For educational purposes only
🙅 Not SEBI registered
❌ Not financial or investment advice
🧠 Smart-Money-Concepts explanation only

Weekly Gold analysis & 8R scenarioLast week gold closed positively with a strong candle showing positivity and approaching to a strong 4H FVG nested inside weekly quadrant level and making cluster. We may see both buying and selling scenarios.
Gold has also broken 4H trend line and retested it. So we can see a possible move till FVG.
We may also witness a breakout if price violates FVG and breaks all time high with strong volume support.
1. Price is creating higher highs in micro structure level and approaching towards 4hours FVG after breaking and retesting trend line at 4 Hours.
2. Trend line breakout is supported by strong volume.
3. Price is continuously running above EMAs confirming up move for now.
4. We may see a reversal scenario at 4 hour FVG level.
5. Most probably price will take liquidity of FVG/RDRB level and create MSS/CISD/TS/iFVG in LTF.
6. Price should show rejection/reversal in respective LTF (1h/15m) at FVG zone.
7. Take the trade only once clear entry model i.e. turtle soup. iFVG break, CDS or MSS happens on LTF
All these combinations are signalling a high probability and ~8R trade scenario.
Note – if you liked this analysis, please boost the idea so that other can also get benefit of it.
Also follow me for notification for incoming ideas.
Also Feel free to comment if you have any input to share.
Join me on live stream for real time update.
Disclaimer: This analysis is for educational purposes only and does not constitute investment advice. Please do your own research (DYOR) and check with your financial advisor before making any trading decisions.

FVG Retracement With EMA, RSI & Fib Confluence📈 Bitcoin Chart – FVG Retracement With EMA, RSI & Fib Confluence in a Bearish Market Structure
This chart showcases a sustained bearish sequence on BTC, defined by a clean continuation of Lower Highs (LH) and Lower Lows (LL). Throughout this decline, multiple Fair Value Gaps (FVGs) have formed both locally and at higher levels — each created by strong institutional sell-side displacement.
As price trends downward, these unmitigated FVGs above the market consistently act as magnet zones:price retraces into previous inefficiencies, rebalances them, and resumes the dominant bearish trend.
In the current setup, the integration of FVGs + Fibonacci Retracement(Point A to B) + EMA Levels + RSI Momentum provides a highly structured roadmap for anticipating retracements and continuation points.
The most significant imbalance sits near the major Fib retracement zone and under key EMAs — making it the highest-probability reaction area. Secondary FVGs below it may still induce a bounce, but carry lower structural relevance.
⸻⸻⸻⸻⸻⸻⸻⸻⸻⸻
📊 Key Observations
1️⃣ Prior FVG Mitigation
A previously formed FVG under the EMA was cleanly filled, followed by immediate downside continuation.
This confirms bearish order-flow control and validates the role of FVGs as efficient retracement targets in a downtrend.
2️⃣ High-Priority FVG (Primary Zone)
The upper FVG holds the strongest confluence:
Created by strong displacement
Sits below the EMA50
Aligns with the 38.2%–61.8% Fib retracement zone
This cluster makes it the most likely zone for a meaningful bearish rejection if price retraces into it.
3️⃣ Secondary FVG Reaction Zone
A lower FVG also exists beneath the main zone.
Although it can cause a minor corrective bounce, it formed during a smaller move and does not align with the key trend or Fib levels — giving it lower probability.
4️⃣ RSI Momentum Context
RSI remains below 50, confirming bearish momentum.
When RSI stays under mid-line, bearish FVG reactions tend to be more reliable and continuation setups form cleanly.
5️⃣ Structural Context
The broader structure remains decisively bearish as long as price trades below the EMAs and below the major upper FVG.
Retracements into these zones are more likely to serve as rebalancing moves rather than genuine reversal attempts.
⸻⸻⸻⸻⸻⸻⸻⸻⸻⸻
📊 Chart Explanation
Symbol → BTCUSDT
Timeframe → 1D
This visualization illustrates how Smart Money Concepts apply cleanly during strong trending conditions:
A clear LH–LL downtrend
Several historical FVGs acting as retracement magnets
A previously mitigated FVG confirming bearish control
A high-confluence FVG aligned with EMAs and Fib levels
A secondary imbalance that can still induce short-term reactions
RSI showing momentum remains bearish
Together, these elements outline a textbook sequence:
displacement → inefficiency → retracement → rebalancing → continuation.
Price remains under firm bearish control unless it breaks above the upper FVG with conviction.
⸻⸻⸻⸻⸻⸻⸻⸻⸻⸻
📘 Using Fib Retracement, EMA50, and RSI With FVGs (Bullish + Bearish)
🔹 1. Fibonacci Retracement + FVG
In a downtrend, draw Fib from swing high → low; in an uptrend, draw low → high
The 38.2%–61.8% zone is the prime retracement area in both directions.
If an FVG forms or sits inside this Fib zone, it becomes a high-probability reaction point (bearish rejection in downtrend, bullish bounce in uptrend).
🔹 2. EMA50 + FVG
In a bearish trend, price and FVGs forming below EMA50 act as stronger bearish retracement zones.
In a bullish trend, price and FVGs forming above EMA50 act as stronger bullish retracement zones.
EMA50 acts as a mean reversion point where price often returns to rebalance before continuation.
🔹 3. RSI + FVG
RSI below 50 → bearish momentum → bearish FVG reactions are more reliable.
RSI above 50 → bullish momentum → bullish FVG reactions are more reliable.
If RSI rises from oversold (or falls from overbought), it often signals a retracement phase toward nearby FVGs.
🔹 4. Combined Logic (Works for Bullish and Bearish)
Displacement creates an FVG (inefficiency).
Price retraces into the 38–61% Fib zone.
Retracement taps EMA50 or stays on the correct side of EMA50 (below for bearish, above for bullish).
RSI confirms momentum (below 50 for bearish continuation, above 50 for bullish continuation).
Price rejects from the FVG and continues the trend.
⸻⸻⸻⸻⸻⸻⸻⸻⸻⸻
✅ Summary
Market structure remains bearish with consistent LHs and LLs.
A previously filled FVG under the EMA validated the continuation move.
The upper FVG is the highest-strength level due to EMA + Fib + displacement confluence.
A lower FVG exists but carries reduced importance.
RSI below 50 reinforces bearish momentum and reliability of bearish FVG reactions.
⸻⸻⸻⸻⸻⸻⸻⸻⸻⸻
⚠️ Disclaimer
📘 For educational purposes only.
🙅 Not SEBI registered.
❌ Not investment advice.
🧠 Smart-Money-Concepts explanation only.

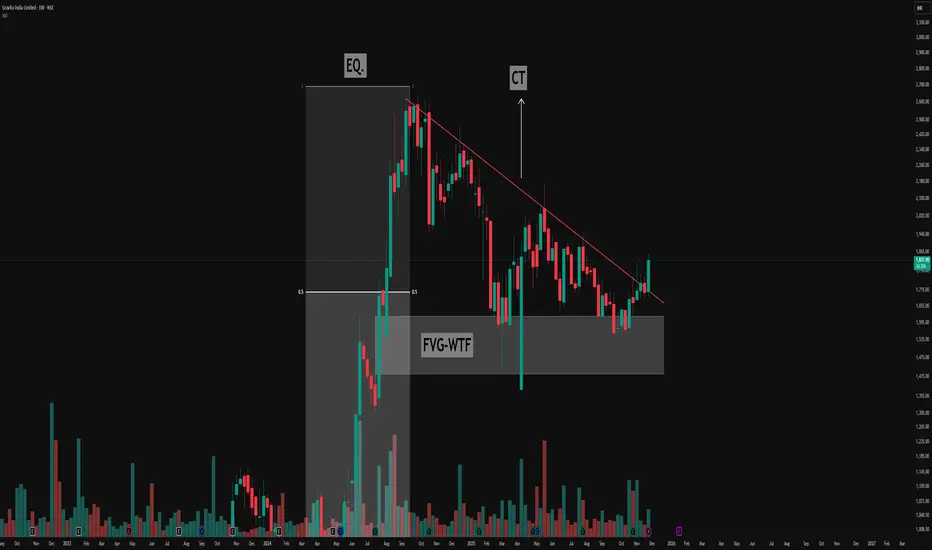
Decoding the Descending Triangle: Key Structure & FVG🔻Understanding the Pattern
- The chart above highlights a classic descending triangle pattern, easily visible by its series of lower highs (marked in red) and a relatively consistent demand zone acting as support.
- This resistance trendline (CT—Contraction Trendline) has been tested multiple times, confirming its significance as sellers consistently respond to price rallies by pushing back from lower levels.
🔻Equilibrium and Price Exploration
- Notice how price action moves from the equilibrium zone (EQ.)—the midpoint of the major move (from lows to all-time highs). This is a key area where supply and demand often rebalance
- The triangle structure forms as buyers continue to find value at support, while sellers become increasingly aggressive at lower highs, compressing price action over time.
🔻Weekly Fair Value Gap (FVG) in Focus
- A prominent Weekly Fair Value Gap (FVG-WTF) is identified, which price has tapped multiple times. This repeated interaction demonstrates its importance as a liquidity pocket where imbalances are re-tested and absorbed.
- Each revisit to this FVG offers a valuable lesson on how strong institutional levels serve as magnets, attracting price to resolve open liquidity.
This post is for educational purposes, highlighting how price structures can be interpreted without suggesting any forecast or trade.
FVG Retracement in a Downtrend📈 Solana Chart – Fair Value Gap Retracement in a Bearish Market Structure
This chart highlights a clear bearish sequence, defined by a repeated formation of Lower Highs (LH) and Lower Lows (LL) with some Higher Highs (HH) and Higher Lows (HL). Throughout this downtrend, multiple Fair Value Gaps (FVGs) have emerged — each representing price inefficiencies created by strong institutional sell-side displacement.
As price continues to decline, these historical FVGs above the current market reveal a consistent pattern:
price retraces into previous imbalances, rebalances them, and then resumes the downward trajectory.
In the current setup, two active bearish FVGs have formed. The upper zone carries greater priority due to its alignment with a major LH, while the lower FVG — although not high priority — can still generate a corrective pullback.
⸻⸻⸻⸻⸻⸻⸻⸻⸻⸻
📊 Key Observations
1️⃣ Prior FVG Mitigation
A previous FVG was cleanly filled, followed by a sharp rejection — a textbook example of institutional rebalancing.
The reaction confirms the efficiency of using FVGs to anticipate retracement zones in a downtrend.
2️⃣ High-Priority FVG
The upper FVG holds greater importance as it aligns with a major Lower High.
This confluence increases the likelihood of a meaningful rejection should price retrace into this imbalance.
3️⃣ Secondary FVG Reaction Zone
A lower FVG also exists beneath the primary one.
Though not a high-priority inefficiency, it may still trigger a pullback if price interacts with it during corrective movement.
4️⃣ Support Line Liquidity Zone
The descending trendline beneath price may function as a liquidity attractor.
Stops often accumulate below such diagonal structures, making it a potential sweep area before a reaction.
5️⃣ Structural Context
The broader price structure remains decisively bearish.
As long as price trades below the upper FVG, sellers maintain control and retracements serve primarily as rebalancing moves rather than reversal attempts.
⸻⸻⸻⸻⸻⸻⸻⸻⸻⸻
📊 Chart Explanation
Symbol → COINBASE:SOLUSD
Timeframe → 1D
This visualization demonstrates how Fair Value Gaps continue to guide price behavior throughout the downtrend.
Each historical FVG above current price acted as a magnet for retracement, followed by rejection once the inefficiency was filled.
The current structure shows:
A clean downtrend defined by Lower Highs and Lower Lows
A previously filled FVG leading to immediate continuation
A new high-priority FVG near a major LH
A secondary FVG capable of producing a corrective bounce
A descending support line acting as a liquidity pool
Together, these elements showcase classic Smart Money concepts:
inefficiency → retracement → rebalancing → continuation.
Price remains under bearish control unless a decisive break above the primary FVG occurs.
⸻⸻⸻⸻⸻⸻⸻⸻⸻⸻
✅ Summary
Market structure shows a series of LH–LL sequences, confirming a strong downtrend.
Previous FVGs were filled and rejected cleanly, validating order-flow-driven rebalancing.
The upper FVG is the highest-priority reaction zone due to its alignment with a major LH.
A lower FVG may still generate a pullback but carries less structural importance.
The descending support line highlights a potential liquidity sweep before any larger rebound.
⸻⸻⸻⸻⸻⸻⸻⸻⸻⸻
⚠️ Disclaimer
📘 For educational purposes only.
🙅 Not SEBI registered.
❌ Not a buy/sell recommendation.
🧠 Purely a learning resource.
📊 Not Financial Advice.

BTC is forming a 3R sell scenario.....BTC is in downtrend in daily timeframe and shown sniper delivery, now it is in pullback mode. We may anticipate a good short term trade around 102000 RDRB level
1. Price is continuously crating BOSs..
2. Sniper deliver is already done and price is pulling back slowly.
3. RSI has already shown bearish divergence on hourly TF.
4. Most probably price will take liquidity of FVG/RDRB level and create MSS/CISD/TS/iFVG in LTF.
5. Price should show rejection/reversal in respective LTF (5m/15m) at FVG zone.
6. Take the trade only once clear entry model i.e. turtle soup. iFVG break, CDS or MSS happens on LTF
All these combinations are signalling a high probability and ~8R trade scenario.
Note – if you liked this analysis, please boost the idea so that other can also get benefit of it.
Also follow me for notification for incoming ideas.
Also Feel free to comment if you have any input to share.
Disclaimer: This analysis is for educational purposes only and does not constitute investment advice. Please do your own research (DYOR) and check with your financial advisor before making any trading decisions.

ETH/USD - Fair Value Gap Retracement with Historical Reactions📈 ETH/USD – Fair Value Gap Retracement and Support Line Interaction
Ethereum’s daily chart showcases a clear bearish market structure, marked by a consistent series of lower highs and lower lows.
Throughout this decline, multiple Fair Value Gaps (FVGs) have emerged, each reflecting price inefficiencies created by strong institutional sell-side displacement.
These historical FVGs — now visible above the current price — reveal how ETH has repeatedly retraced to fill prior imbalances before resuming its downward trajectory.
The latest setup forms yet another bearish FVG, potentially acting as a retracement zone before continuation.
⸻⸻⸻⸻⸻⸻⸻⸻⸻⸻
📊 Key Observations
1️⃣ Historic FVG Reaction – The previous FVG (around the mid-October region) acted as a powerful supply zone. Price retraced deeply into that imbalance, filled it almost completely, and then reversed sharply — validating the concept of FVG-based rebalancing before continuation.
2️⃣ Current FVG Setup – A new bearish Fair Value Gap has now formed following another strong sell-side impulse. This zone represents a fresh inefficiency that may attract retracement before the next move down.
3️⃣ Optimal Confirmation Depth – The best confirmation typically occurs when price retraces toward the high of the FVG.
Reaching the upper boundary indicates that buy-side liquidity has been tapped and unfilled institutional sell orders have likely been triggered, often preceding a sharp rejection.
4️⃣ Descending Support Line – The trendline below price continues to act as a liquidity attractor. Stops often accumulate beneath it, making it a potential sweep zone before reversal.
5️⃣ Structural Context – The broader structure remains bearish. As long as price trades below the most recent FVG, sellers maintain full control.
⸻⸻⸻⸻⸻⸻⸻⸻⸻⸻
📊 Chart Explanation
Symbol → BINANCE:ETHUSD
Timeframe → 1D
This chart highlights the continuity of Fair Value Gap behavior throughout Ethereum’s bearish cycle.
The earlier FVGs (visible above current price) acted as magnets for retracement and then rejection — clear evidence of institutional rebalancing in action.
Each time ETH filled a previous FVG, the market found equilibrium before continuing downward.
Now, a fresh bearish FVG has formed, marking the next potential reaction area.
If price retraces deeper — ideally up to the high of this new FVG — it would offer the most reliable confirmation of a likely rejection. A shallower retracement, on the other hand, could signal weaker corrective intent.
Below current price, the descending support line identifies a possible liquidity pool. Price may sweep below this line to collect liquidity before any larger reversal attempt.
This confluence of historic and active FVGs, combined with the trendline structure, perfectly captures Smart Money’s rebalancing logic — inefficiency, retracement, rejection, and continuation.
The chart structure clearly displays a sequence of Lower Highs (LH) and Lower Lows (LL), confirming the ongoing bearish trend. This repeating HH–HL–LH–LL rhythm reflects controlled market structure and institutional rebalancing behavior.
⸻⸻⸻⸻⸻⸻⸻⸻⸻⸻
✅ Summary
• Ethereum continues to form lower highs and lower lows, maintaining its bearish structure.
• Historic FVGs show how price repeatedly retraced, filled inefficiencies, and reversed lower.
• A deeper retracement toward the high of the current FVG provides stronger confirmation for a rejection setup.
• The descending support line may act as a liquidity sweep zone before reversal.
• The overall sentiment remains bearish unless price closes above the FVG zone.
⸻⸻⸻⸻⸻⸻⸻⸻⸻⸻
⚠️ Disclaimer
📘 For educational purposes only.
🙅 Not SEBI registered.
❌ Not a buy/sell recommendation.
🧠 Purely a learning resource.
📊 Not Financial Advice.

EURUSD Trade Idea Shorts Tuesday/Wednesday WASUPPP LADSSS!
Yeah EU/GU are in a bhllish orderflow, I'm expecting them to continue higher but not before retracing back into the daily bullish Fair Value gap. So GU has printed a H4 Bearish FVG and there's smt between EU and GU on the Daily Time Frame. I'm expecting a second smt to push price lower into the daily fair value gap before continuing upwards, so short term i would be looking for sells.
So this is the plan, in London -
If price creates an smt divergence with DXY/GBP/USDCHF I would look for shorts to the daily bullish fair value gap, this is basically an ERL to IRL play.
This is just an idea, it has necessary conditions which need to be met to be acted upon, like smt and a bearish orderflow on the 15m timeframe. If these two conditions are met I would look for shorts, unless price decides to continue going higher. Thank you and keep winning!!!

ETHUSDT/BTCUSDT Short idea 11/11/2025Wassup Lads!
This looks like a very enticing short setup simply because
1. Price in a daily bearish fair value gap
2. We have SMT Divergence between BTC and ETH on the daily time frame
Switching over to the H1 time frame I'm clearly seeing price print out a bearish orderflow, I have not yet entered but will look to enter a sell postion on retracement to the H1 Bearish fair value gap, targeting a basic 1 to 2 risk to reward ratio. So basically, if price retraces to the h1 bearish fair value gap I'll look for shorts or I'm happy waiting on the sidelines for a new setup.
As always -
1. Manage your risk
2. Stay disciplined
3. Do your own research
One wrong trade can spoil months of discipline
Keep winning!!

Fair Value Gap Retracements in a Downtrend📈 BTC/USD – Understanding Fair Value Gap Retracements in a Downtrend
The current market structure on the daily timeframe highlights a clear bearish trend, where price continues to form lower highs and lower lows.
After a strong downward impulse, a Fair Value Gap (FVG) has formed — representing an area of imbalance that price may eventually retrace to before deciding its next move.
This setup reflects a potential rebalancing phase within the ongoing downtrend.
⸻⸻⸻⸻⸻⸻⸻⸻⸻⸻
📊 Key Observations
1️⃣ FVG Formation — A bearish Fair Value Gap has emerged following a strong sell-side move, signaling a region of inefficiency left behind by aggressive sellers.
2️⃣ Retracement Possibility — Price may attempt to retrace into the FVG zone to rebalance this inefficiency before continuing its primary downtrend.
3️⃣ Potential Rejection Zone — If price reacts negatively from the FVG, it could confirm continued bearish sentiment and lead to another lower low.
4️⃣ Trend Context — The overall market remains under a descending structure, with sellers maintaining control as long as price stays below the FVG zone.
⸻⸻⸻⸻⸻⸻⸻⸻⸻⸻
📊 Chart Explanation
Symbol → BINANCE:BTCUSD
Timeframe → 1D
This chart illustrates how a Fair Value Gap (FVG) functions as a key retracement zone within a broader bearish structure. The price action shows a sequence of lower highs and lower lows, confirming a prevailing downtrend.
After a strong downward impulse, price created a bearish FVG — highlighted in red — representing an imbalance area where institutional orders may remain unfilled. Price is now retracing upward, likely to fill this inefficiency.
If the market faces rejection from this FVG zone, it could signal the continuation of the ongoing bearish momentum. However, a clean break and close above it might hint at a short-term structural shift.
Below the current price, a liquidity pool zone is marked — an area where stop-losses likely reside. Price often sweeps such zones to collect liquidity before reversing, aligning with Smart Money behavior.
Overall, this setup showcases how identifying FVGs within market structure helps traders anticipate rebalancing phases, retracements, and potential reaction points in trending markets.
⸻⸻⸻⸻⸻⸻⸻⸻⸻⸻
✅ Summary
• The Fair Value Gap acts as a magnet zone where price may retrace to fill inefficiency.
• A rejection from the FVG could resume bearish continuation.
• A confirmed close above the FVG might hint at short-term strength or structural shift.
• Traders should observe price behavior within this zone for potential rebalancing reactions.
⸻⸻⸻⸻⸻⸻⸻⸻⸻⸻
⚠️ Disclaimer:
📘 For educational purposes only.
🙅 Not SEBI registered.
❌ Not a buy/sell recommendation.
🧠 Purely a learning resource.
📊 Not Financial Advice.

Trade Journal Trade 3 - EURUSD - 10/11/2025Wassup Lads!
Took this trade today and got a 2R win, good start to the trading week.
Coming to the trade, price was in a bullish orderflow on EURUSD and had tapped the 4H internal liquidity (FVG)
Confirmed the momentum by smt with USDCHF and also in London Open. Time and Price both Aligning.
Target was a simple 2R.
Good Trade. Keep Winning Boys.

Kotak buying scenario........Kotak Mahindra Bank is forming a wonderful scenario in buying side. It is ranging between trend lines for long time and now taking a reversal after a pullback. Below conditions are reflecting the situation of smart money to jump in…….
1. After pullback it is respecting cluster of 50/100 and 200 SMA and formed a rejection candle.
2. There is a daily FVG nested in OB, which is also being respected.
3. RSI is also at mid-level and showing a reversal..
4. We may see some choppy kind of situation for few days and later breakout.
Note – if you liked this analysis, please boost the idea so that other can also get benefit of it.
Also follow me for notification for incoming ideas.
Also Feel free to comment if you have any input to share.
Disclaimer – This analysis is just for education purpose not any trading suggestion. Please take the trade at your own risk and with the discussion with your financial advisor.

EURUSD Weekly Outlook - 10/11/205 to 14/11/2025Wassup Lads!
So this week we can see that EU closed sharply into the week rejecting the lows, there's a strong rejection candle on the weekly time frame and price has displaced higher forming a daily swing point and a daily fair value gap as well, so what I would be looking for price is to do this -
1. Price range on Monday
2. Manipulte into the daily fair value gap.
3. Look for smt divergence during key times
4. Would look for longs
This is my plan for EU this coming week.
Do your own research, manga risk and stay disciplined bois.
Let's win this week!

My Journal Trade 2 - ETHUSDT LONGThis was a counter trade in a downtrend, low probability and also weekend, however it looked super clean and I took it. Coming to the trade
1. SMT between PDLs b/w ETH and BTC
2. Price tapped into H4 FVG
3. Smt with BTC in the H4 FVG
4. Target a basic 1 to 2 Risk to Reward
So this was a success. A risky one in a downtrend though, took it because it has all the elements of a good trade setup barring the time.

CRYPTO WEEKLY OUTLOOK 10/11/25 - 17/11/25Wassup Lads! So crypto is clearly in a downtrend as of now targeting pending daily sell side liquidity but it's also in a monthly key level that is a fair value gap, so what I am expecting price to do now is take out the pending lows on the daily timeframe on BTCUSDT and inverse the daily fair value gap, this would also cause an SMT Divergence with ETHUSDT signalling a shift in orderflow. So right now it's headed lower.
This is my plan,
1. Sell to the lows
2. Wait for an inversion of the daily bearish fair value gap on BTCUSDT, to confirm a reversal for buys.
Remember to -
1. Manage Risk
2. Do your own research
3. Stay Disciplined
