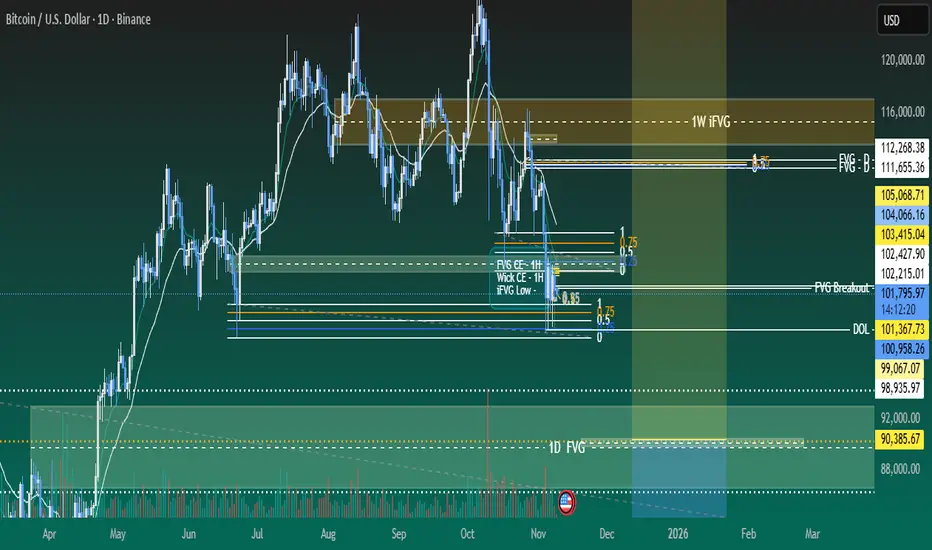
Weekly analysis BTC with 4R trade ideaLast weeks’ trade has performed well and already moved ~15K points and still going on. Further to this week analysis, we expect good reversal trade from the zone of 89700 to 90385. Still we have ~11k points movement pending to reach to this level. Price would be showing weakness in sell side and reversal pattern. We should patiently wait for entry model and confirmation as price is in sell side.
1. 1D FVG and wick is creating strong cluster of their relevant CE levels.
2. We would see exaction in sell side movement and reversal pattern.
3. RSI will also show oversold or bearish divergence on HTF.
4. Most probably price will take liquidity of FVG and create MSS/CISD/TS/iFVG in LTF.
5. Price should show rejection/reversal in respective LTF (1H/15m) at FVG zone.
6. Take the trade only once clear entry model i.e. turtle soup. iFVG break, CDS or MSS happens on LTF
All these combinations are signalling a high probability and ~4R trade scenario.
Note – if you liked this analysis, please boost the idea so that other can also get benefit of it.
Also follow me for notification for incoming ideas.
Also Feel free to comment if you have any input to share.
Disclaimer – This analysis is just for education purpose not any trading suggestion. Please take the trade at your own risk and with the discussion with your financial advisor.
,
Fvg
Fair Value Gap (FVG) — Support and Resistance (S/R)🔎 Overview
The Fair Value Gap (FVG) is a unique price imbalance or inefficiency on a price chart where the market rapidly moves, leaving one or more candles without overlapping wicks between highs and lows.
This signifies aggressive buying or selling, resulting in a “gap” of untraded prices.
Once spotted, FVGs often act as magnets, drawing price back to fill the gap — and later serve as dynamic support or resistance zones, depending on the market direction.
⸻⸻⸻⸻⸻⸻⸻⸻⸻⸻
📔 Concept
A Fair Value Gap forms when:
1️⃣ Resistance FVG -- A strong impulsive move causes the low of the first candle and the high of the third candle (in a three-candle sequence) to fail to overlap, leaving a visible gap.
2️⃣ Support FVG -- A strong impulsive move causes the high of the first candle and the low of the third candle (in a three-candle sequence) to fail to overlap, leaving a visible gap.
3️⃣ Imbalance -- This gap highlights an area where orders were skipped, signaling an imbalance between buyers and sellers.
4️⃣ Rebalance -- When revisited, a Bullish FVG often acts as support, while a Bearish FVG acts as resistance, as price reacts to rebalance the inefficiency before the trend continues.
⸻⸻⸻⸻⸻⸻⸻⸻⸻⸻
📌 How to Use
✅ Validation → A valid FVG exists as long as the gap remains unfilled, and traders watch for price to revisit and react to it.
🟩 Bullish FVG → Support: When price retraces into the gap and finds buying interest, the zone holds as support.
🔴 Bearish FVG → Resistance: When price rallies into a bearish gap and faces rejection, the zone holds as resistance.
❌ Devalidation → If price decisively closes inside the FVG, the gap is considered “filled,” and the setup loses significance.
Typically, the lowest unfilled bullish FVG below price in an uptrend (and the highest bearish FVG above in a downtrend) carries more weight and is prioritized for confluence.
⸻⸻⸻⸻⸻⸻⸻⸻⸻⸻
📊 Chart Explanation
Symbol → NSE:ITC
Timeframe → 1D
On the right-hand side, the Fair Value Gaps (FVGs) are illustrated in detail to give a closer look at how they form and function.
These visual examples explain how FVGs represent price inefficiencies — zones that later act as dynamic support or resistance once price revisits them.
On the left-hand side, you can see real-time examples of FVGs forming within live price action.
When a candle closes decisively inside a bullish FVG, it confirms price commitment, allowing the zone to act as support and potentially propel price upward.(These are plotted using open sourced indicator )
This setup beautifully demonstrates how understanding FVG structure helps identify high-probability reaction zones where the market seeks to rebalance itself.
⸻⸻⸻⸻⸻⸻⸻⸻⸻⸻
👀 Observation
Fair Value Gaps work best in volatile markets or during strong impulsive moves.
When price revisits an unfilled gap, the reaction helps define new support or resistance.
Combining FVGs with key structural levels, volume analysis, or momentum indicators (like RSI or Moving Averages) improves reliability.
Always prioritize clean, unfilled gaps aligned with the trend direction for higher conviction.
⸻⸻⸻⸻⸻⸻⸻⸻⸻⸻
💡 Conclusion
The Fair Value Gap not only signals where the market may “rebalance” itself after price inefficiencies but also identifies potential support and resistance zones.
Recognizing how bullish and bearish FVGs interact with price allows traders to anticipate reactions, manage risk, and refine entries and targets with greater accuracy.
⸻⸻⸻⸻⸻⸻⸻⸻⸻⸻
⚠️ Disclaimer
📘 For educational purposes only.
🙅 Not SEBI registered.
❌ Not a buy/sell recommendation.
🧠 Purely a learning resource.
📊 Not Financial Advice.
Weekly & Daily BTC analysis of 10R Opportunity........On HTF weekly and daily BTC is forming good scenarios for bearish trade. Price is consolidating at higher levels for last couple of weeks and showing value adjustment in BTC. Price already shot up a lot and we may see a short term pull back.
1. BTC has created CISD after taking liquidity at weekly level and tested weekly iFVG.
2. It has also created 1D FVG and 4H FVG and iFVG over lapping. creating cluster of CEs. Which might be a Good POI for sell side opportunity.
3. Technically we are already into a weekly down side scenario. Further price is approaching Daily and 4 Hourly FVGs for possible re-entry opportunities.
4. RSI has also already shown a bearish divergence on weekly level.
5. Most probably price will take liquidity of FVG and create MSS/CISD/TS/iFVG in LTF.
6. Price should show rejection/reversal in respective LTF (1H/15m) at FVG zone.
7. Take the trade only once clear entry model i.e. turtle soup. iFVG break, CDS or MSS happens on LTF
All these combinations are signalling a high probability and ~10R trade scenario.
Note – if you liked this analysis, please boost the idea so that other can also get benefit of it. Also follow me for notification for incoming ideas.
Also Feel free to comment if you have any input to share.
Disclaimer – This analysis is just for education purpose not any trading suggestion. Please take the trade at your own risk and with the discussion with your financial advisor.

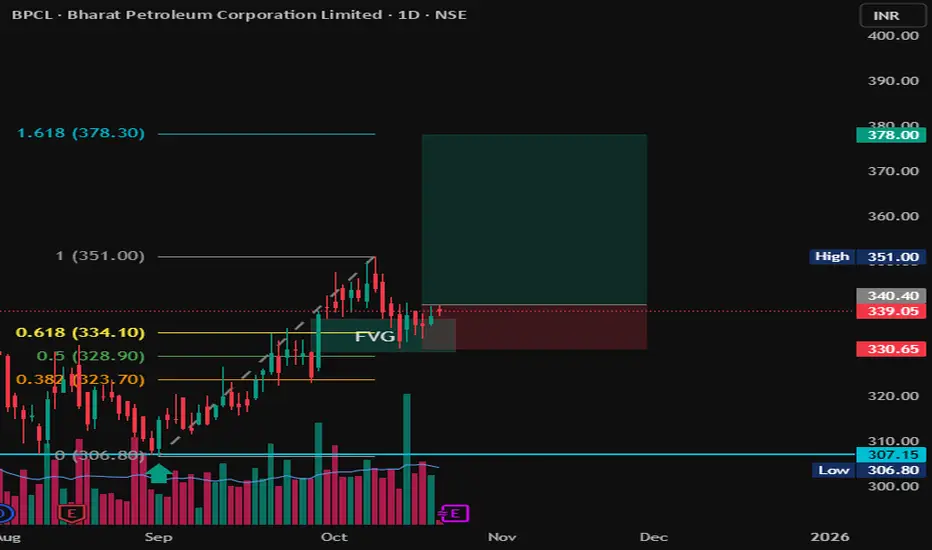
BPCL | FVG + Fibonacci COnfluence | Long Setup toward 378 💬 Description:
Chart Type: 1D (Daily)
Stock: BPCL – Bharat Petroleum Corporation Ltd.
🧩 Setup Overview
BPCL has completed a clean retracement into a Fair Value Gap (FVG) aligning with the 0.5–0.618 Fibonacci retracement zone from the previous upswing (306 → 351).
The zone around ₹334–₹340 acted as strong demand support, hinting at a possible continuation leg to the upside.
📊 Trade Plan
Entry Zone: ₹338–₹340
Stop Loss: ₹330
Target 1: ₹351
Target 2: ₹378 (1.618 Fib Extension)
Risk–Reward Ratio: ~1:3
📈 Technical Confluence
✅ FVG + 0.618 Fib alignment
✅ Retest & bounce confirmation
✅ Volume showing accumulation
✅ Clear higher-low structure maintained
🚨 Invalidation
Setup invalid if price closes below ₹330, which would break FVG and shift structure to bearish.
🧠 Bias: Bullish continuation
Time Horizon: Swing (2–4 weeks)
BTC forming wonderful scenarioBTC is forming good scenarios for bullish and subsequently bearish trade. It has created ABC pattern and retracing back to bullish FVG. We need to wait for price getting into right zones. We may also see a sell side trade once reaches to bearish FVG.
1. Currently price has broken ABC pattern neckline and retracing towards 1h FVG.
2. We may also see a sell side trade once price tap into bearish FVG and shows reversal pattern.
3. Most probably price will take liquidity of FVG and create MSS/CISD/TS/iFVG in LTF.
4. Price should show rejection/reversal in LTF (5m,1m) at FVG zone.
5. Take the trade only once clear entry model i.e. turtle soup. iFVG break, CDS or MSS happens on LTF
All these combinations are signalling a high probability and ~4R trade scenario.
Note – if you liked this analysis, please boost the idea so that other can also get benefit of it. Also follow me for notification for incoming ideas.
Also Feel free to comment if you have any input to share.
Disclaimer – This analysis is just for education purpose not any trading suggestion. Please take the trade at your own risk and with the discussion with your financial advisor.

ETHUSD 2.5R sell side trade scenarioETHUSD is forming sell side trades as current bias and draw on liquidity both are at down side. Price has also left SIBIs to attract price upside for a while and then return back to target. In weekend price may have low volatility and trade possibly generate on Monday or later.
1. There is a daily time frame bearish FVG.
2. There is bearish FVG in 4H TF. Now price is approaching it slowly.
3. These FVGs are forming inside OTE zone.
4. Order flow is bearish. And draw on liquidity is also at downside.
5. Most probably price will take liquidity of FVGs and create MSS/CISD/TS/iFVG in LTF.
6. Price should show rejection/reversal in LTF (5m,1m) at FVG zone.
7. BTC is also forming similar scenario.
All these combinations are signalling a high probability and 2.5R trade scenario.
Note – if you liked this analysis, please boost the idea so that other can also get benefit of it. Also follow me for notification for incoming ideas.
Also Feel free to comment if you have any input to share.
Disclaimer – This analysis is just for education purpose not any trading suggestion. Please take the trade at your own risk and with the discussion with your financial advisor.

BTCUSD 3R Sell side trade BTCUSD is forming sell side trade as current bias and draw on liquidity both are at down side. Price has also left SIBIs to attract price upside for a while and then return back to target. In weekend price may have low volatility and trade possibly generate on Monday or later.
1. There is a 4H time frame bearish FVG.
2. There is bearish FVG in 1H and 30m overlapping with 4H FVG. Now price is approaching it slowly.
3. These FVGs are forming inside Fib golden zone.
4. Order flow is bearish. And draw on liquidity is also at downside.
5. Most probably price will take liquidity of FVGs and create MSS/CISD/TS/iFVG in LTF.
6. Price should show rejection/reversal in LTF (5m,1m) at FVG zone.
All these combinations are signalling a high probability and 3R trade scenario.
Note – if you liked this analysis, please boost the idea so that other can also get benefit of it. Also follow me for notification for incoming ideas.
Also Feel free to comment if you have any input to share.
Disclaimer – This analysis is just for education purpose not any trading suggestion. Please take the trade at your own risk and with the discussion with your financial advisor.

BTCUSD 4.5R sell side beautiful scenarioBTCUSD is in range from last 5 days but now it is showing Smart Money’s interest. And it appears a down side trade is being developed as it has swept upside liquidity and forming CISD after displacement.
1. It has taken upside liquidity.
2. Formed CISD after displacement.
3. It has formed FVG and BPR on 1h time frame and price is inside POI.
4. POI is created inside OTE zone confirming good RnR.
5. Most probably price will take liquidity of FVG and OTE zone and create MSS/TS in LTF.
6. Price should show rejection/reversal in LTF (5m,1m) at FVG zone.
All these combinations are signalling a high probability and 4.5R trade scenario.
Note – if you liked this analysis, please boost the idea so that other can also get benefit of it. Also follow me for notification for incoming ideas.
Also Feel free to comment if you have any input to share.
Disclaimer – This analysis is just for education purpose not any trading suggestion. Please take the trade at your own risk and with the discussion with your financial advisor.

USDJPY Sell entry 1::5 RnRUSDJPY is forming a beautiful day trade for selling side. It can be a very good intraday trade if everything goes as per plan.
1. Price kissed 4H Iceberg Block and showed sniper liquidity and left bearish FVGs at both 30m and 15m.
2. 15m FVG is inside 30m FVG and upper side of OTE area.
3. Now it is moving toward FVG areas after taking reversal from bullish 15m BPR
4. Most probably price will take liquidity of FVG and OTE zone and create MSS in LTF.
5. Order flow confirming bearish bias.
6. Price should show rejection/reversal in LTF (5m,1m) at FVG zone.
All these combinations are signalling a high probability and high Risk and Reward (1:5) trade scenario.
Note – if you liked this analysis, please boost the idea so that other can also get benefit of it. Also follow me for notification for incoming ideas.
Also Feel free to comment if you have any input to share.
Disclaimer – This analysis is just for education purpose not any trading suggestion. Please take the trade at your own risk and with the discussion with your financial advisor.

Gold (XAUUSD) 1:4 intraday buy scenario.Gold is in up move and forming a good buy scenario on 30/15-minute chart. It can be a very good intraday trade if everything goes as per plan.
1. 30/15m bullish FVG is pending and price is showing pull back towards it.
2. Most probably price will take liquidity of FVG and OTE zone and create MSS in LTF.
3. Order flow confirming bullish bias.
4. Price should show rejection/reversal in LTF at FVG zone.
All these combinations are signalling a high probability and high Risk and Reward (1:4) trade scenario.
Note – if you liked this analysis, please boost the idea so that other can also get benefit of it. Also follow me for notification for incoming ideas.
Also Feel free to comment if you have any input to share.
Disclaimer – This analysis is just for education purpose not any trading suggestion. Please take the trade at your own risk and with the discussion with your financial advisor.

BTC developing a good sell opportunityBTC is moving in range for long time. Now it has shown a displacement after ChoCH and formed a bearish 15m FVG. There may be a good trade at sell side if price approach it. Well there are two trade scenarios are forming.
1. Price moves to 15m FVG and OTE overlap zone.
2. Most probably price will take liquidity of FVG and OTE zone and create MSS in LTF.
3. After breaking trend line it should pullback till FVG/trend line or any newly created OB/FVG.
All these combinations are signalling a high probability and high Risk and Reward (1:8) trade scenario.
Note – if you liked this analysis, please boost the idea so that other can also get benefit of it. Also follow me for notification for incoming ideas.
Also Feel free to comment if you have any input to share.
Disclaimer – This analysis is just for education purpose not any trading suggestion. Please take the trade at your own risk and with the discussion with your financial advisor.

ETH multiple Sell OpportunitiesETH is moving in range for almost a week time. Now it has shown a displacement after ChoCH and formed a bearish 15m FVG. There may be a good trade at sell side if price approach it. Well there are two trade scenarios are forming.
Trade # 1
1. Price is moving around a short term trend line and resistance.
2. If price breaks trend line and take the liquidity of resistance than it may be sell trade.
Trade # 2
3. Price moves to 15m FVG and OTE overlap zone.
4. Most probably price will take liquidity of FVG zone and break trend line.
5. After breaking trend line it should pullback till FVG/trend line or any newly created OB/FVG.
All these combinations are signaling a high probability and high Risk and Reward (1:8) trade scenario.
Note – if you liked this analysis, please boost the idea so that other can also get benefit of it. Also follow me for notification for incoming ideas.
Also Feel free to comment if you have any input to share.
Disclaimer – This analysis is just for education purpose not any trading suggestion. Please take the trade at your own risk and with the discussion with your financial advisor.
Gold (XAUUSD) forming wonderful sell scenarioGoldUSD price is moving at higher side and showing weakness. It is also forming double top kind of scenario. We may see a good short trade if liquidity sweep is witness at the resistance level with the additional confirmation of higher volume. Overall trend is still upside but buyers seems exhausted. We may find a good sell trade if Liquidity sweeps at resistance and everything goes as we planned.
1. Price is approaching 4H resistance zone. Which may act as a strong supply zone.
2. Buying is slow and weak.
3. Most probably price will take liquidity of resistance zone and break trend line.
4. After breaking trend line it should pullback till resistance/trend line or any newly created OB/FVG.
All these combinations are signalling a high probability and high Risk and Reward (1:8) trade scenario.
Note – if you liked this analysis, please boost the idea so that other can also get benefit of it. Also follow me for notification for incoming ideas.
Also Feel free to comment if you have any input to share.
Disclaimer – This analysis is just for education purpose not any trading suggestion. Please take the trade at your own risk and with the discussion with your financial advisor.

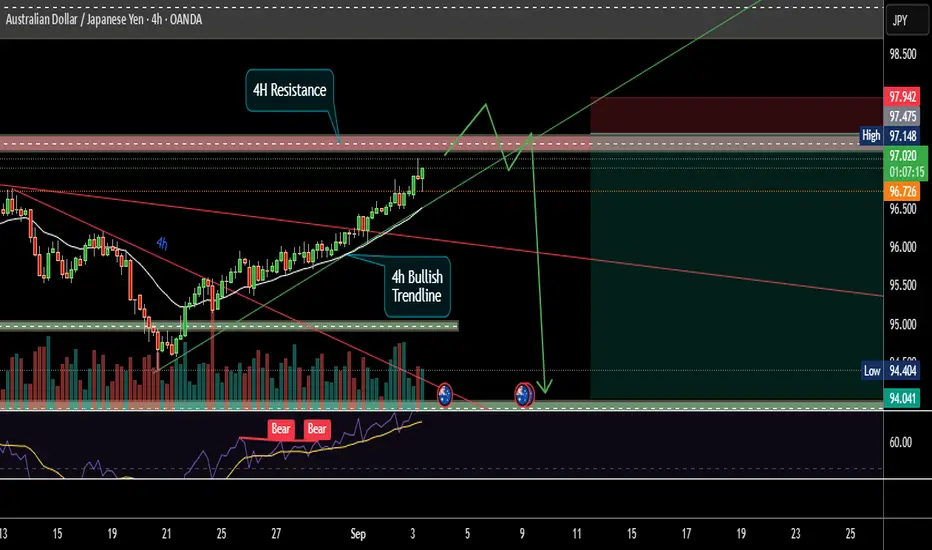
A beautiful AUDCHF high RnR scenarioAUDCHF is approaching 4H resistance zone which has already show rejection previously. There is also a steep bullish trend line creating a confluence. RSI has already shown Bearish Divergence. All these signaling a coming very good sell side opportunity. Below are points detailing the same.
1. Price is approaching 4H resistance zone. Which may act as a strong supply zone.
2. Very steep Bullish Trend line developing a confluence at resistance. Steep trend line are always prone for breakout/breakdown.
3. Most probably price will take liquidity of resistance zone and break trend line.
4. After breaking trend line it should pullback till resistance/trend line or any newly created OB/FVG.
5. RSI also already shown Bearish Divergence and running in oversold zone.
All these combinations are signaling a high probability and high Risk and Reward (1:8) trade scenario.
Note – if you liked this analysis, please boost the idea so that other can also get benefit of it. Also follow me for notification for incoming ideas.
Also Feel free to comment if you have any input to share.
Disclaimer – This analysis is just for education purpose not any trading suggestion. Please take the trade at your own risk and with the discussion with your financial advisor.
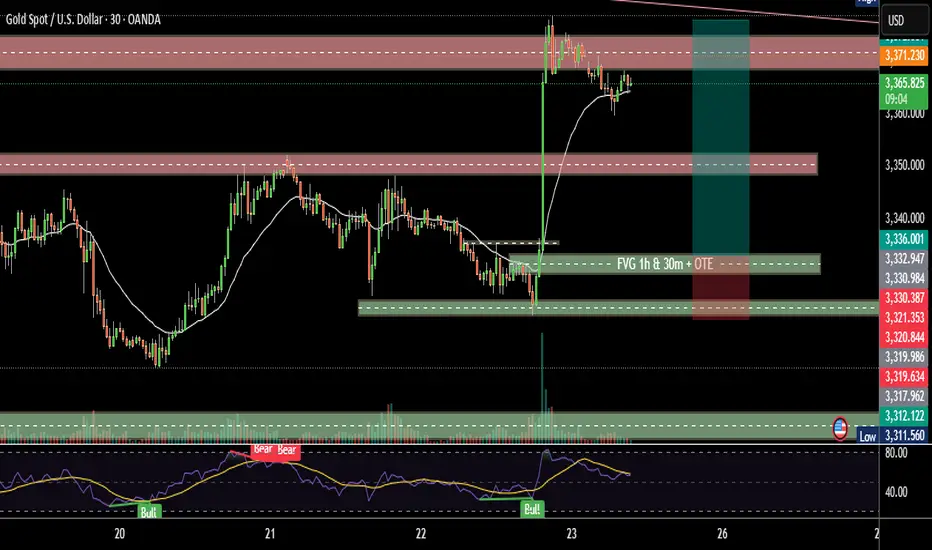
High probability 1:7 Gold buy scenario.Gold is developing nice scenario for upside move. Currently it is under consolidation. We are expecting manipulation toward FVG (1 and 15m overlapping) and then upward movement after liquidity sweep. Below is detail
1. Price has created Break of Structure.
2. Displacement happened, which created FVGs in 5 and 15m overlapping.
3. FVGs are formed in Discount and OTE zone.
4. FVGs are overlapping BB on 5m.
5. HTF bias is also upside.
All these combinations are signalling a high probability and high Risk and Reward (1:7) trade scenario.
Note – if you liked this analysis, please boost the idea so that other can also get benefit of it. Also follow me for notification for incoming ideas.
Also Feel free to comment if you have any input to share.
Disclaimer – This analysis is just for education purpose not any trading suggestion. Please take the trade at your own risk and with the discussion with your financial advisor.

1:7 RnR trade opportunity on GBPCADGBPCAD is forming a great price action and scenario. Which may lead to high risk and reward trade. Below are the signals noticed ...
1. Price has broken 10 days’ consolidation of trend line and nearby resistance as well.
2. Created BOS and FVG on 1-hour time frame in discount area.
3. Price is running above VWAP and 21 EMA. And 21 EMA crossing over VWAP.
4. Now we can expect a pullback till FVG area.
All these combinations are signalling a high probability and high RnR (1:7) trade scenario.
Note – if liked this analysis, please boost the idea so that other can also get benefit of it. Also follow me for notification for incoming ideas.
Disclaimer – This analysis is just for education purpose not any trading suggestion. Please take the trade at your own risk and with the discussion with your financial advisor.

XAUUSD SD + OTE Long Trade (Smart Money Logic)This is my recent LONG trade on OANDA:XAUUSD on the 15 min chart.
When everyone was waiting to SHORT , I was waiting patiently in my LONG position.
Entry :
$3378 - Order Block + FVG + 0.5 Optimal Trade Entry level
Exit :
1st Target - $3400 (Standard Deviation Target 1 + 3400 psychological level)
2nd Target - $3418 (Standard Deviation Target 2)
NOTE: Smart Money DOES NOT HUNT stoplosses , they trigger their positions slightly below where they find maximum liquidity, because their positions are WAY TOO HUGE and need all the anti-orders (buy/sell stops) basically buy side or sell side liquidity so that they can fill in their orders. They are literally there to HELP YOU push the price up or down, you just need to place your stoplosses right! not too tight not too far off which may cause market structure shifts. SLs need to be absolutely perfect
Trade Explanation :
OANDA:XAUUSD should have used the 1D Bearish Order Block and we should have seen a fall or at least a decent enough retracement, but only 1 thing saved us, that is 15 min Bullish INDUCMENT and 1H BIAS . I never entered in a short trade!
I hope everyone saw these liquidity pools at the bottom and waited for them to get swept, but yeah, not always will liquidity be hunted right? Pools are areas with the most number of orders + stops. So aren't they supposed to be a good thing? :)
So, yes, DAILY bias is good, but again, LTF bias is also very necessary. Markets won't always respect the DAILY bias. Else, they would always be stuck in a sideways momentum right?
Think about it!
Also, do let me know in the comments what you feel about this trade and also share your analysis!

EURJPY - SD + OTE + FVG Long EntryFX:EURJPY - Analysis on the 15min TimeFrame.
(Look at the charts for all the levels)
1. Bullish IDM
2. 15min Bullish FVG tapped
3. Optimal Trade Entry ( OTE ) level 0.5 tapped
4. Standard Deviation ( SD ) TP 1 will be used as Target
5. Bearish 15min Order Block is also aligned with SD and can be used as target as well
6. SL - just below last 15min Bullish Order Block
Entry is triggered, let's see if this trade hits TP or SL.
Also, I'd love to hear your analysis as well. What do you guys think? Let me know in the comments

ETH Buy at perfect zone.ETH Buy scenario at perfect zone. ETH is creating a perfect scenario for buy on 4H TF.
1. Price is at support, FVG and OB confluence in premium zone at OTE.
2. Also showing rejection in price action.
3. Trend line is faked out.
P.S. - it is just analysis not any trade recommendation.

A good scenario being devolved in Gold.A good scenario being devolved in Gold.
1. Displacement is done.
2. Overlapping FVGs in different time frames 1h, 30m and 15m are formed.
3. These FVGs are formed at OTE level.
4. OB is also kind of overlapping these FVGS.
There may be a good scenario of buying if MSS happens in lower time frame with this POI.
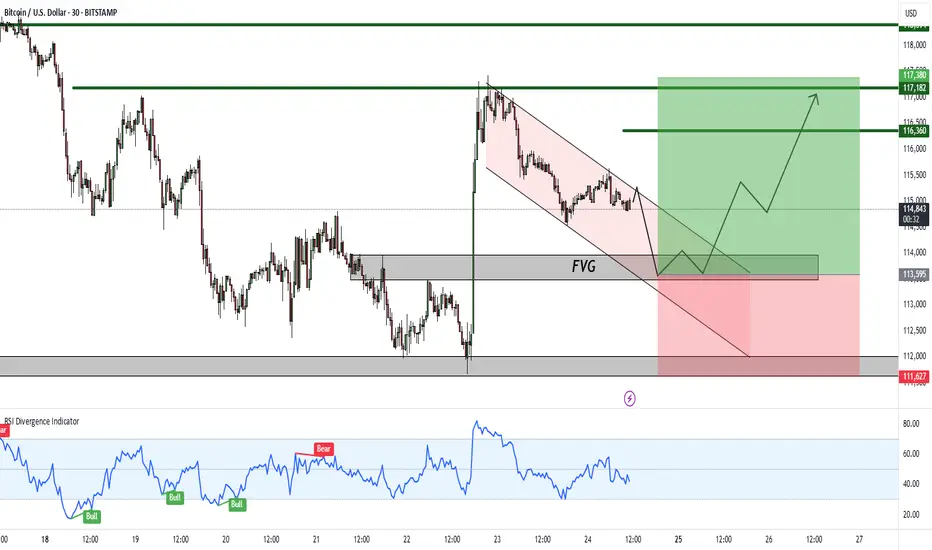
Bitcoin – Bullish Setup Forming After FVG Retest!Hello Traders!
Bitcoin is currently showing signs of forming a bullish setup after rejecting lower levels. The price has created a clean FVG (Fair Value Gap) zone and is moving within a falling channel, suggesting a possible accumulation before the next leg up.
Key Observations:
FVG Support: Price is likely to retest the FVG zone before a strong upward move.
Falling Channel: The structure indicates potential breakout to the upside.
RSI Divergence: Momentum indicators are showing signs of strength, supporting a bullish reversal case.
Targets: The upside targets are marked at 116,360 – 117,380 – 118,394 levels.
Invalidation: A breakdown below 111,627 would negate this bullish setup.
Rahul’s Tip:
Always wait for confirmation around the FVG zone. Entering too early may expose you to false breakouts. Risk management is crucial, especially in volatile assets like Bitcoin.
Disclaimer:
This analysis is for educational purposes only and not financial advice. Please do your own research before making any trading decisions.
XAU/USD SD + OTE + Fractal Reversal TradeHey traders!
Here you can see all the trades taken by me in accordance with some major concepts of ICT.
1. OTE - Optimal Trade Entry
2. SD - Standard Deviation
3. Fractal Nature - If you can't find a pattern on the HTF, you'll surely find something on the LTF and vice versa. For example:
- The SELL entry over here, we had an FVG on the 5 min TF , there was no other valid level to short the markets.
- The other BUY Entries were taken on HTFs , and gave us very good targets as well!
Standard Deviations when combined with PD arrays , work like a charm and can be used as targets for LTF trades and reversals for HTF trades.
Hope you learned something today!
Share your analysis as well in the comments!

XAUUSD - SD + OTE + PD Array Entry/ExitThis long trade in XAUUSD includes cumulative entry and exit models.
1. SD - Standard Deviation Target 1 - 3274
Standard Deviation Target 2 - 3408
2. OTE - Optimal Trade Entry ( Equilibrium + 40 pips)
3. PD Array - 4H/15m FVG (caused due to CPI news)
PD array + OTE overlapping perfectly, so there's double confirmation.
Last manipulative leg before IDM (Inducement) and MSS (Market Structure Shift) taken for predicting Standard Deviation Targets.
This is a 1D + 4H PD array at play, with Liquidity of previous weekly candle already taken. So it's very possible that trade hits both of our targets.
Already 333pips captured in this trade, waiting for more, let's see what happens!
Share your thoughts and analysis below in the comments.
I'd honestly like to know about your opinion :)
