Weekly Analysis with buy/Sell scenarios in BTC👋👋👋 Friends, What's your view on BTC???
Last week, Bitcoin (BTC) traded with high volatility and a corrective bias, briefly dropping toward the critical $60,000 support zone before staging a sharp rebound toward $68,000–$70,000, but failing to sustain above $70K and closing the week slightly negative; the decline was driven by profit booking and long liquidation, leading to a sharp drawdown of nearly 15–20% at one stage, indicating leveraged positions being flushed out. Key developments included cooling momentum in spot Bitcoin ETF inflows, signaling reduced institutional buying, along with macro uncertainty around US inflation and interest rate expectations, which pressured risk assets, while capital rotation toward safe havens like gold further impacted sentiment. Additionally, declining trading volumes and increased hedging activity reflected cautious participation and lack of strong bullish conviction.
Structurally, BTC remains in a range between $60K–$70K, with lower highs indicating supply on rallies. For the coming week, two key scenarios emerge: bullish case – a sustained move above $70K–$72K can trigger short covering and push BTC toward $75K+; bearish case – failure to reclaim $70K may lead to a retest of $60K support, and a breakdown below this level could accelerate downside toward $55K–$58K. Overall, BTC remains range-bound with downside risk, and the next move will largely depend on macro data, ETF flows, and overall risk sentiment.
Critical Points
1. Price is ranging between ~$60K-~$70K.
2. Pressure is clear downside and we can expect some moves between the identified range.
3. We should expect any big movement out of this range only.
4. Price may approach POI identified in last week once lower zone is broken with volume and sustained below it.
5. Price may consolidate at this level and form MSS at this POI and possibly reverse for further highs.
6. Most probably price will take liquidity of FVG/RDRB level and create MSS/CISD/TS/iFVG in LTF.
7. Price should show rejection/reversal in respective LTF (4H/1H) at Key Level/FVG zone.
8. Take the trade only once clear entry model i.e. turtle soup. iFVG break, CDS or MSS happens on LTF
All these combinations are signalling a high probability and high reward trade scenario.
Note – if you liked this analysis, please boost the idea so that other can also get benefit of it.
Also follow me for notification for incoming ideas.
Also Feel free to comment if you have any input to share.
Disclaimer: This analysis is for educational purposes only and does not constitute investment advice. Please do your own research (DYOR) and check with your financial advisor before making any trading decisions.
Fvg_strategy

Weekly Analysis with buy/Sell scenarios in BTCAnother selling week. Price made low of 59977 and closed above ~70K. Overall BTC is still bearish and we may see further downfall after some pullback. ~74500 is critical level for pullback. ~55K is critical next level. We may witness a consolidation and reversals on 50K – 55K zone.
Price will remain bearish till delivery changes at 4-hour time frame. Currently price has formed double top in 4H time frame which is a good signal for further downside move.
Weeks back we analyzed down fall toward 65K and further ~50K and price made the low of 60K so far. So our overall analysis is still stands good.
Critical Points
1. Price has created double top in 4H TF and targeting further low.
2. Price may hit the zone of 50K-55K and show the delivery change.
3. Next POI is second quadrant of weekly time frame.
4. Price may consolidate at this level and form MSS at this POI and possibly reverse for further highs.
5. Most probably price will take liquidity of FVG/RDRB level and create MSS/CISD/TS/iFVG in LTF.
6. Price should show rejection/reversal in respective LTF (4H/1H) at Key Level/FVG zone.
7. Take the trade only once clear entry model i.e. turtle soup. iFVG break, CDS or MSS happens on LTF.
All these combinations are signalling a high probability and high reward trade scenario.
Note – if you liked this analysis, please boost the idea so that other can also get benefit of it.
Also follow me for notification for incoming ideas.
Also Feel free to comment if you have any input to share.
Disclaimer: This analysis is for educational purposes only and does not constitute investment advice. Please do your own research (DYOR) and check with your financial advisor before making any trading decisions.

Weekly Analysis with buy/Sell scenarios in Nifty👋👋👋 Friends, What's your view on Nifty???
Nifty was in big pressure during previous weeks because of global events and higher tariffs from US. But last week was good recover week because of big events of IndoEU trade deal and more importantly confirmation on IndoUS FTA. These events pushed positivity in the market and price shown upside move of ~1500 points and finally closed above 25600 (@25693)
On Tuesday Price gaped up ~1200 points and fell sharply losing ~ 600 points from high of the day. Price went on range bound for remaining three days, however price closed in slightly positive mode on Friday.
FIIs/DIIs both were net buyer at the end of week. FIIs - 2,645.53 and DIIs - 2,892.14.
Considering all these factors Nifty should move up side. Our first target level should be 26000 and then all-time high.
Critical points ……………….
1. Price closed positively after sharp fall from the high of Tuesday.
2. Currently price at critical level and most probably it will go upside.
3. Critical Support level is 25500.
4. We should see some really good bullish price formation if price willing to go upside.
5. We should patiently wait for the formation of entry model at least at 1H/15m)
6. If Global sentiments are positive and price gets support from volume at key level, we may see some really good buy scenarios.
Note – if you liked this analysis, please boost the idea so that other can also get benefit of it.
Also follow me for notification for incoming ideas.
Also Feel free to comment if you have any input to share.
Disclaimer: This analysis is for educational purposes only and does not constitute investment advice. Please do your own research (DYOR) and check with your financial advisor before making any trading decisions.

Weekly Analysis with buy/Sell scenarios in Gold/XAUUSD👋👋👋 Friends, What's your view on Gold ???
Week on Week basis price of Gold shown too much volatility. Price opened ~ $55 gap down and sharply fell and made low of day and week. Next day it showed recover and further three days it was range bound.
Now price is showing change in state of delivery. We may expect slightly slip/consolidation on Monday and later on it may further take the rout of POI/Key Level of 4500. Which is again a very strong round number as well. At this level we may witness reversal pattern/entry model which may further take the price upside to make new highs.
Critical notes.
1. Price may show some consolidation on early sessions or Monday/Tuesday.
2. High probably we will witness KOD and move into lower quadrant of weekly time frame.
3. There should be a proper entry model formation at identified POI/Key level
4. Most probably price will take liquidity of Key Level/FVG/RDRB level and create MSS/CISD/TS/iFVG in LTF.
5. Price should show rejection/reversal in respective LTF (1h/15m) at Key Level/FVG zone.
6. Take the trade only once clear entry model i.e. turtle soup. iFVG break, CDS or MSS happens on LTF
All these combinations are signalling a high probability and high RnR trade scenario.
Note – if you liked this analysis, please boost the idea so that other can also get benefit of it.
Also follow me for notification for incoming ideas.
Also Feel free to comment if you have any input to share.
Disclaimer: This analysis is for educational purposes only and does not constitute investment advice. Please do your own research (DYOR) and check with your financial advisor before making any trading decisions.

Weekly Analysis of BTC - Detailed Another week and price still moved as expected in same range. No major view change since last prediction for long term trades.
Further short-term view.
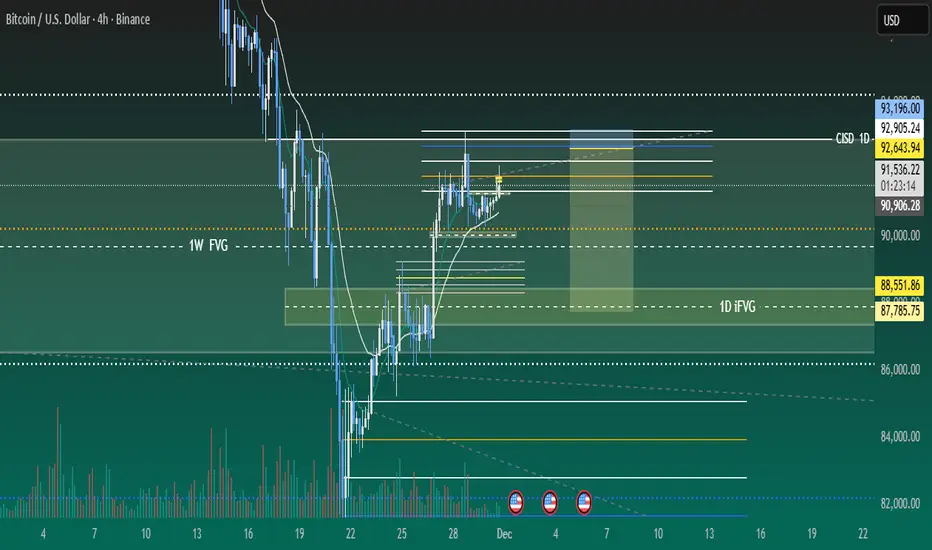
Week is closed bearish and may target recent draw on liquidities of ~84K. Price may move in choppy mode for some time. So, the best idea is to look for small trade rather than long swing trades.
As the market in rangebound/Choppy, so we should keep eye on both side Opps but focus on down side as next high-level draw on liquidity is at downside.
Refer previous details below for larger perspective…
We analysed three weeks back that BTC would be in range for some time before taking any further move, And BTC is following same analysis and trapped within a small range since then. BTC prediction of last week also worked perfectly well and market kept in consolidation mode itself. BTC is still in consolidation zone and may spend some more days. It may develop ABC pattern or reversal at identified daily FVG level, if price has to change its delivery and take turn from here. This zone is kind of make or break. If price is not able to sustain and breakdown, then it may witness ~65-70K levels as well.
We hope for reversal from this level as price is developing the pattern at higher time frame.
1. Price has taken liquidity or 82K and almost touched 80K.
2. It has inversed 1Day FVG and now price is consolidating in the range between EMAs.
3. We may expect price retracement till 1D iFVG and then reversal.
4. Before to that we may see sweep of 92900 (1D CISD) level and then a retracement short trade till 1D FVG
5. Most probably price will take liquidity of FVG/RDRB level and create MSS/CISD/TS/iFVG in LTF.
6. Price should show rejection/reversal in respective LTF (5m/15m) at FVG zone.
7. Take the trade only once clear entry model i.e. turtle soup. iFVG break, CDS or MSS happens on LTF
All these combinations are signalling a high probability trade scenario.
Note – if you liked this analysis, please boost the idea so that other can also get benefit of it.
Also follow me for notification for incoming ideas.
Also Feel free to comment if you have any input to share.
Disclaimer: This analysis is for educational purposes only and does not constitute investment advice. Please do your own research (DYOR) and check with your financial advisor before making any trading decisions.

Weekly Analysis with buy/Sell scenarios in BTCAnother week and price is moved as expected in same range. No view change since last prediction.
Refer previous details below…
We analyzed three weeks back that BTC would be in range for some time before taking any further move, And BTC is following same analysis and trapped within a small range since then. BTC prediction of last week also worked perfectly well and market kept in consolidation mode itself. BTC is still in consolidation zone and may spend some more days. It may develop ABC pattern or reversal at identified daily FVG level, if price has to change its delivery and take turn from here. This zone is kind of make or break. If price is not able to sustain and breakdown, then it may witness ~65-70K levels as well.
We hope for reversal from this level as price is developing the pattern at higher time frame.
1. Price has taken liquidity or 82K and almost touched 80K.
2. It has inversed 1Day FVG and now price is consolidating in the range between EMAs.
3. We may expect price retracement till 1D iFVG and then reversal.
4. Before to that we may see sweep of 92900 (1D CISD) level and then a retracement short trade till 1D FVG
5. Most probably price will take liquidity of FVG/RDRB level and create MSS/CISD/TS/iFVG in LTF.
6. Price should show rejection/reversal in respective LTF (5m/15m) at FVG zone.
7. Take the trade only once clear entry model i.e. turtle soup. iFVG break, CDS or MSS happens on LTF
All these combinations are signalling a high probability trade scenario.
Note – if you liked this analysis, please boost the idea so that other can also get benefit of it.
Also follow me for notification for incoming ideas.
Also Feel free to comment if you have any input to share.
Disclaimer: This analysis is for educational purposes only and does not constitute investment advice. Please do your own research (DYOR) and check with your financial advisor before making any trading decisions.

Weekly Analysis BTC with Sell and Buy scenarios..Here is the weekly analysis of BTC including various topics of ICT, Price action etc.
Note – if you liked this analysis, please boost the idea so that other can also get benefit of it.
Also follow me for notification for incoming ideas.
Also Feel free to comment if you have any input to share.
Join me on live stream for real time update.
Disclaimer: This analysis is for educational purposes only and does not constitute investment advice. Please do your own research (DYOR) and check with your financial advisor before making any trading decisions.

Weekly Analysis of Nifty.....This is the weekly analysis of Nifty covering various topics of ICT, Price action.. Please do watch and repeat watch to learn these...
Note – if you liked this analysis, please boost the idea so that other can also get benefit of it.
Also follow me for notification for incoming ideas.
Also Feel free to comment if you have any input to share.
Join me on live stream for real time update.
Disclaimer: This analysis is for educational purposes only and does not constitute investment advice. Please do your own research (DYOR) and check with your financial advisor before making any trading decisions.

Weekly analysis Gold Multi RnR sell and Buy scenarioThis is weekly analysis of gold providing detailed analysis and educational topics i.e. ICT, Price action, support and resistance etc.
Note – if you liked this analysis, please boost the idea so that other can also get benefit of it.
Also follow me for notification for incoming ideas.
Also Feel free to comment if you have any input to share.
Join me on live stream for real time update.
Disclaimer: This analysis is for educational purposes only and does not constitute investment advice. Please do your own research (DYOR) and check with your financial advisor before making any trading decisions.

Weekly analysis BTC with high RnR scenariosBTC is now in consolidation zone and may spend some more days. It may also develop ABC pattern or reversal at daily level, if price has to change its delivery and take turn from here. This zone is kind of make or break. If price is not able to sustain and breakdown, then it may witness ~65-70K levels as well.
We hope for reversal from this level as price is developing the pattern at higher time frame.
1. Price has taken liquidity or 82K and almost touched 80K.
2. It has inversed 1Day FVG and now price is consolidating in the range between EMAs.
3. We may expect price retracement till 1D iFVG and then reversal.
4. Before to that we may see sweep of 92900 (1D CISD) level and then a retracement short trade till 1D FVG
5. Most probably price will take liquidity of FVG/RDRB level and create MSS/CISD/TS/iFVG in LTF.
6. Price should show rejection/reversal in respective LTF (5m/15m) at FVG zone.
7. Take the trade only once clear entry model i.e. turtle soup. iFVG break, CDS or MSS happens on LTF
All these combinations are signalling a high probability and high RnR trade scenario.
Note – if you liked this analysis, please boost the idea so that other can also get benefit of it.
Also follow me for notification for incoming ideas.
Also Feel free to comment if you have any input to share.
Join me on live stream for real time update.
Disclaimer: This analysis is for educational purposes only and does not constitute investment advice. Please do your own research (DYOR) and check with your financial advisor before making any trading decisions.
BTC strong down trend and high RnR sell scenario..BTC is in strong down trend and broke ~ 90K level and targeting further downside levels of 82K and 75K. Price is continuously forming lower highs and BoS. Price has formed a BOS on hourly chart and approaching 1h FVG. We may expect a rejection pattern in LTF inside FVG and further downfall.
1. Price is in strong down trend and formed 1H FVG after creating BOS.
2. FVG is formed on weekly quadrant level, making it more significant,
3. Price is now approaching FVG
4. Most probably price will take liquidity of FVG/RDRB level and create MSS/CISD/TS/iFVG in LTF.
5. Price should show rejection/reversal in respective LTF (5m/15m) at FVG zone.
6. Take the trade only once clear entry model i.e. turtle soup. iFVG break, CDS or MSS happens on LTF
All these combinations are signalling a high probability and ~8R trade scenario.
Note – if you liked this analysis, please boost the idea so that other can also get benefit of it.
Also follow me for notification for incoming ideas.
Also Feel free to comment if you have any input to share.
Join me on live stream for real time update.
Disclaimer: This analysis is for educational purposes only and does not constitute investment advice. Please do your own research (DYOR) and check with your financial advisor before making any trading decisions.

BTC Swing 8R reversal scenario....BTC moved as per our plan throughout last 10-15 days and crashed to ~ 90K levels, now it has reached to its critical level of reversal, which is weekly FVG CE area. Price has already shown change in delivery at 4H level. All these making it a really good contender for a long swing trade which may even lead to all time high.
1. Price has tested CE of weekly strong FVG and formed CISD at 4-hour level.
2. Now it is testing CISD imbalance area to form proper entry model…
3. We may wait for MSS to occur in this area in 15 minutes for more precise entries.
4. Most probably price will take liquidity of FVG/RDRB level and create MSS/CISD/TS/iFVG in LTF.
5. Price should show rejection/reversal in respective LTF (5m/15m) at FVG zone.
6. Take the trade only once clear entry model i.e. turtle soup. iFVG break, CDS or MSS happens on LTF
All these combinations are signalling a high probability and ~8R trade scenario.
Note – if you liked this analysis, please boost the idea so that other can also get benefit of it.
Also follow me for notification for incoming ideas.
Also Feel free to comment if you have any input to share.
Join me on live stream for real time update.
Disclaimer: This analysis is for educational purposes only and does not constitute investment advice. Please do your own research (DYOR) and check with your financial advisor before making any trading decisions.

Gold/XAUSSD weekly analysis and possible sell/buy scenarios....Currently gold is showing pressure and generating sell signals. There are multiple sell opportunities developed in Gold in different time frames. And we can anticipate couple of opportunities out of these will trigger. Gold has already created CISD on HTF and tested daily FVG and changed delivery and showing down fall in price. There is already one sell scenario executed. And we can see few more in coming week.
1. Price has already changed delivery in daily time frame and tasted daily FVG and price is falling now.
2. Currently price is holding at daily FVG and we may see slight pull back around the levels of 424152 & 4205 and then further fall till ~3888 level.
3. We can see another higher probability sell scenario at 4300 level if aforementioned levels are breached.
4. RSI is also showing sell side pressure, giving another confluence.
5. Most probably price will take liquidity of FVG/RDRB level and create MSS/CISD/TS/iFVG in LTF.
6. Price should show rejection/reversal in respective LTF (1h/15m) at FVG zone.
7. Take the trade only once clear entry model i.e. turtle soup. iFVG break, CDS or MSS happens on LTF
All these combinations are signalling a high probability and ~10R trade scenario.
Note – if you liked this analysis, please boost the idea so that other can also get benefit of it.
Also follow me for notification for incoming ideas.
Also Feel free to comment if you have any input to share.
Join me on live stream for real time update.
Disclaimer: This analysis is for educational purposes only and does not constitute investment advice. Please do your own research (DYOR) and check with your financial advisor before making any trading decisions.

BTC Weekly analysis and sell/Buy scenarios....BTC moved as per our plan throughout last week more than 13K points so far, and still in down trend. Price is continuously creating BOSs and moving toward our target of 90K. Meanwhile during sniper delivery, it has created some pull back zones, which can be tested before reaching to our target. So we have few possible multi RnR trades scenarios before seeing possible reversal.
1. Sniper deliver is already done and price is pulling back slowly.
2. We may see possible pullback sell trade opportunity around 100K and 103.5k levels.
3. RSI is also showing sell side pressure, giving another confluence.
4. Most probably price will take liquidity of FVG/RDRB level and create MSS/CISD/TS/iFVG in LTF.
5. Price should show rejection/reversal in respective LTF (5m/15m) at FVG zone.
6. Take the trade only once clear entry model i.e. turtle soup. iFVG break, CDS or MSS happens on LTF
All these combinations are signalling a high probability and ~7R trade scenario.
Note – if you liked this analysis, please boost the idea so that other can also get benefit of it.
Also follow me for notification for incoming ideas.
Also Feel free to comment if you have any input to share.
Disclaimer: This analysis is for educational purposes only and does not constitute investment advice. Please do your own research (DYOR) and check with your financial advisor before making any trading decisions.

Axis bank is forming a good buy scenario.Axis Bank is in slow selling for weeks after a strong rally and now forming a bullish scenario.
It is taking reversal from protection trendline and braking out bearish trendline.
It is also taking support from daily order block.
it is also taking rejection from 21 EMA
All other Higher duration EMAs are synced in upside direction.
Rejection point is forming a cluster of multiple parameters .
All these in combination making it an attractive buying scenario....
Note – if you liked this analysis, please boost the idea so that other can also get benefit of it.
Also follow me for notification for incoming ideas.
Also Feel free to comment if you have any input to share.
Disclaimer: This analysis is for educational purposes only and does not constitute investment advice. Please do your own research (DYOR) and check with your financial advisor before making any trading decisions.

BTC 8R Sell scenario.........BTC is in downtrend in daily timeframe and shown sniper delivery, now it is in pullback mode. We may anticipate a good short term trade on hourly time frame around hourly FVG
1. HTF MSS is already done and price is reverting to FVG after BOS.
2. Daily quadrant cluster is also falling around FVG. Which is giving us some more critical levels of price reversal.
3. RSI has already shown bearish divergence on hourly TF.
4. Most probably price will take liquidity of FVG and create MSS/CISD/TS/iFVG in LTF.
5. Price should show rejection/reversal in respective LTF (5m/15m) at FVG zone.
6. Take the trade only once clear entry model i.e. turtle soup. iFVG break, CDS or MSS happens on LTF
All these combinations are signalling a high probability and ~8R trade scenario.
Note – if you liked this analysis, please boost the idea so that other can also get benefit of it.
Also follow me for notification for incoming ideas.
Also Feel free to comment if you have any input to share.
Disclaimer – This analysis is just for education purpose not any trading suggestion. Please take the trade at your own risk and with the discussion with your financial advisor.

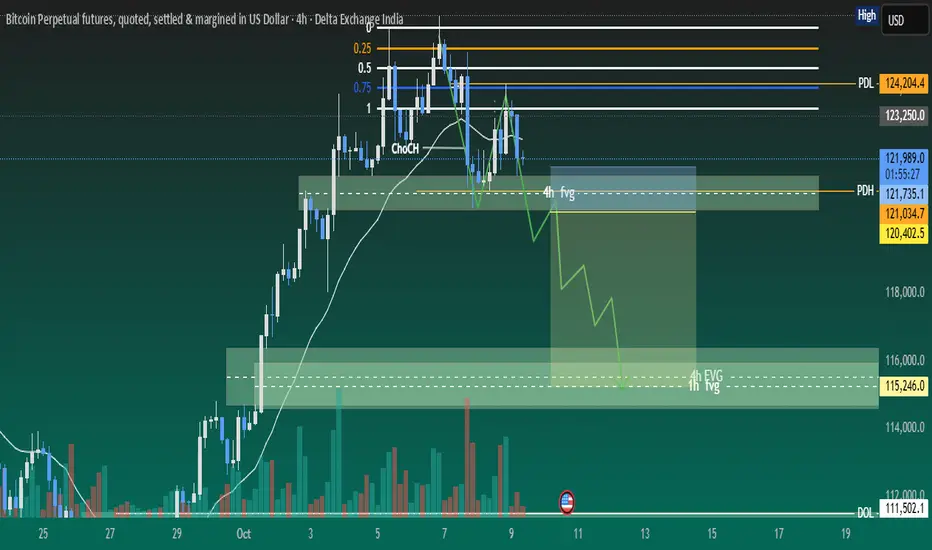
BTC is developing ~4R down side tradeBTC has done MSS on 4h time frame and showing rejection at 4H FVG after displacement. We can see a good downside trade once below FVG is mitigated and changed to iFVG. We need to wait for price getting into right zones.
1. Currently price is moving inside 4H FVG after displacement and showing rejection as well.
2. Price should break below FVG and retest.
3. There are several SIBIs which may be target for it and further buy side reversal trade.
4. RSI has already shown bearish divergence. Which support coming down move.
5. Most probably price will take liquidity of FVG and create MSS/CISD/TS/iFVG in LTF.
6. Price should show rejection/reversal in LTF (5m,1m) at FVG zone.
7. Take the trade only once clear any of the entry model i.e. turtle soup. iFVG break, CDS or MSS happens on LTF
All these combinations are signalling a high probability and ~4R trade scenario.
Note – if you liked this analysis, please boost the idea so that other can also get benefit of it. Also follow me for notification for incoming ideas.
Also Feel free to comment if you have any input to share.
Disclaimer – This analysis is just for education purpose not any trading suggestion. Please take the trade at your own risk and with the discussion with your financial advisor.
Beautiful 6R BTC trade scenariosBTC is forming both buy and sell side trades as the price is in critical zone. BTC will possibly give us both side good trades. We need to wait for price getting into right zones.
1. Currently price is moving around daily and 4H gradient levels.
2. 125275 level is creating a gradient cluster of both 1d and 4h time frame. Which may give us a good sell side trade if price show clear reversal signals.
3. There is an 1hour iFVG if price takes liquidity of it, most probably it will touch gradient cluster level and good sell scenario may be confirmed.
4. There are several SIBIs which may be target for it and further buy side reversal trade.
5. Buy side reversal trade may be good trade as overall BTC order flow is upside.
6. Most probably price will take liquidity of FVGs and create MSS/CISD/TS/iFVG in LTF.
7. Price should show rejection/reversal in LTF (5m,1m) at FVG zone.
All these combinations are signalling a high probability and 5.5R trade scenario.
Note – if you liked this analysis, please boost the idea so that other can also get benefit of it. Also follow me for notification for incoming ideas.
Also Feel free to comment if you have any input to share.
Disclaimer – This analysis is just for education purpose not any trading suggestion. Please take the trade at your own risk and with the discussion with your financial advisor.

XAUUSD At Critical PRZ: Will Gold Reverse or Break to New Highs?Hello Traders And Investors
XAUUSD At Critical PRZ: Will Gold Reverse or Break to New Highs? 🔥”
The recent price action on Gold (XAUUSD) has reached a very critical level near $3,586 – $3,600, which aligns with a strong resistance zone. This area is marked as a Potential Reversal Zone (PRZ), where sellers may step back into the market.
🔍 Market Structure Breakdown:
Previous Liquidity Sweep
Price collected liquidity below the July lows before forming a Higher Low at the start of August.
This move gave the market strength to push higher, creating a clean bullish structure.
Strong Impulsive Rally
From mid-August onwards, gold showed a strong bullish impulse, breaking through minor resistance levels without much pullback.
However, such parabolic moves often lack sustainability, making them vulnerable to a healthy correction.
Resistance & PRZ Reaction
The current resistance zone has historically acted as a strong rejection level.
Price tapping into this zone suggests exhaustion in bullish momentum, increasing the probability of a short-term pullback.
🎯 Target Zones for Downside Move:
1st Target: $3,480 – $3,500
This area coincides with a previous demand block and will act as the first reaction point.
Final Target: $3,330 – $3,320 (Key Support)
If bearish momentum sustains, price could revisit this major support, completing the correction phase before potentially resuming the broader uptrend.

XAUUSD Alert| Liquidity Grab or Trend Reversal?”XAUUSD Alert 🚨 | Liquidity Grab or Trend Reversal?”
Gold has recently pushed into the 3525 – 3550 rejection zone, a level that has historically acted as strong supply. After this extended bullish rally, price is now showing early signs of exhaustion. This could be a liquidity grab above resistance before the market corrects lower.
My expectation here is a short-term pullback. The first key area I’ll be watching is around 3450, which lines up with a smaller demand zone and could act as a temporary support. If buyers fail to defend that level, then I expect continuation toward the 3330 – 3320 zone, which is my final target and also a major higher-timeframe support point.
This level is very important because it was previously a strong base for accumulation, and if tested again, it could provide a potential long opportunity. However, if price breaks below 3320 decisively, it would open the door for a much deeper correction.
Overall, my short-term outlook is bearish retracement, but I’ll be closely watching how price reacts once we reach the deeper support levels.

Liquidity Grab Completed – Bulls Back in Control?Liquidity Grab Completed – Bulls Back in Control?
Key Technical Insights:
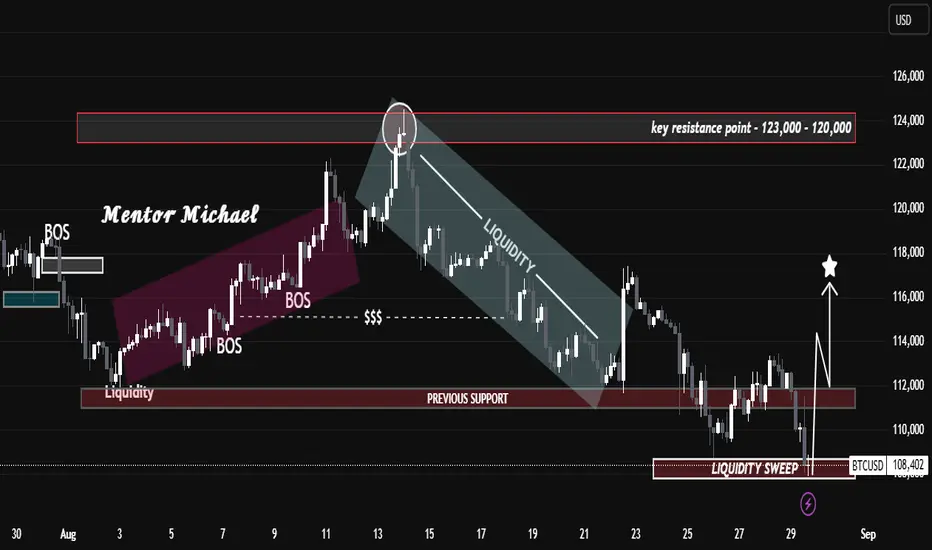
Resistance Rejection: Price sharply rejected the 120K – 123K resistance zone, confirming this area as a key supply level.
Bearish Liquidity Flow: After rejection, BTC flowed within a descending liquidity channel, continuously taking out internal supports before finding a base.
Previous Support → Liquidity Sweep: Around 108K, price executed a strong liquidity sweep, triggering stop hunts below prior support, then showing a bullish reaction.
Market Structure Shift Incoming: The sweep suggests a potential accumulation phase, where institutions collect orders before pushing price higher.
Upside Targets: If price holds above the reclaimed support at 112K, bullish momentum could aim for 116K – 118K in the near term ⭐.
⚠️ Risk Consideration: A failure to sustain above 108K would invalidate the bullish outlook, opening room for deeper downside.
📌 Summary:
BTCUSD is transitioning from a liquidity-driven decline into a possible reversal phase. The liquidity sweep at 108K could mark the start of a bullish leg if structure confirms with higher highs. Traders should monitor 112K as the short-term pivot point.
“The Art of Traps: Understanding Fake Breakouts in XAUUSD”“The Art of Traps: Understanding Fake Breakouts in XAUUSD”
This chart illustrates how gold (XAUUSD) is currently navigating a critical battle between resistance and support.
At the top, the resistance zone (3440–3460) has already shown signs of rejection, hinting at a possible fake breakout scenario. Such traps are common in financial markets—they draw traders into buying late, only for price to reverse and capture liquidity.
On the downside, the chart highlights two important stages:
The first target lies around 3400, where short-term buyers may start taking profits.
The final target sits at the key support zone (3330–3320), which has acted as a structural backbone in past moves. If this level holds, we can expect another bullish leg; if broken, deeper downside pressure could unfold.
The sequence of higher lows in recent weeks demonstrates strength in the broader trend, but it also warns that markets are building energy before a larger move. Liquidity sweeps (marked in the chart) serve as reminders that price does not move randomly—it often seeks zones where orders are concentrated.
🔑 Educational Takeaway:
Trading is not just about spotting breakouts; it’s about understanding whether those moves are genuine or deceptive. By studying price behavior at resistance and support, traders can avoid falling into liquidity traps and position themselves with the “smart money.”

Buy Opportunity in USOILAn upside opportunity is being developed. Scenario.
1. Choch has happened and price retracing towards FVG.
2. it is also taking support from trendlines.
3. If price rejects with volume in FVG zone, it may lead to good upside trade.
P.s. - It is just analysis not trading recommendation.
