XAUUSD At Critical PRZ: Will Gold Reverse or Break to New Highs?Hello Traders And Investors
XAUUSD At Critical PRZ: Will Gold Reverse or Break to New Highs? 🔥”
The recent price action on Gold (XAUUSD) has reached a very critical level near $3,586 – $3,600, which aligns with a strong resistance zone. This area is marked as a Potential Reversal Zone (PRZ), where sellers may step back into the market.
🔍 Market Structure Breakdown:
Previous Liquidity Sweep
Price collected liquidity below the July lows before forming a Higher Low at the start of August.
This move gave the market strength to push higher, creating a clean bullish structure.
Strong Impulsive Rally
From mid-August onwards, gold showed a strong bullish impulse, breaking through minor resistance levels without much pullback.
However, such parabolic moves often lack sustainability, making them vulnerable to a healthy correction.
Resistance & PRZ Reaction
The current resistance zone has historically acted as a strong rejection level.
Price tapping into this zone suggests exhaustion in bullish momentum, increasing the probability of a short-term pullback.
🎯 Target Zones for Downside Move:
1st Target: $3,480 – $3,500
This area coincides with a previous demand block and will act as the first reaction point.
Final Target: $3,330 – $3,320 (Key Support)
If bearish momentum sustains, price could revisit this major support, completing the correction phase before potentially resuming the broader uptrend.
Fvg_strategy

XAUUSD Alert| Liquidity Grab or Trend Reversal?”XAUUSD Alert 🚨 | Liquidity Grab or Trend Reversal?”
Gold has recently pushed into the 3525 – 3550 rejection zone, a level that has historically acted as strong supply. After this extended bullish rally, price is now showing early signs of exhaustion. This could be a liquidity grab above resistance before the market corrects lower.
My expectation here is a short-term pullback. The first key area I’ll be watching is around 3450, which lines up with a smaller demand zone and could act as a temporary support. If buyers fail to defend that level, then I expect continuation toward the 3330 – 3320 zone, which is my final target and also a major higher-timeframe support point.
This level is very important because it was previously a strong base for accumulation, and if tested again, it could provide a potential long opportunity. However, if price breaks below 3320 decisively, it would open the door for a much deeper correction.
Overall, my short-term outlook is bearish retracement, but I’ll be closely watching how price reacts once we reach the deeper support levels.

Liquidity Grab Completed – Bulls Back in Control?Liquidity Grab Completed – Bulls Back in Control?
Key Technical Insights:
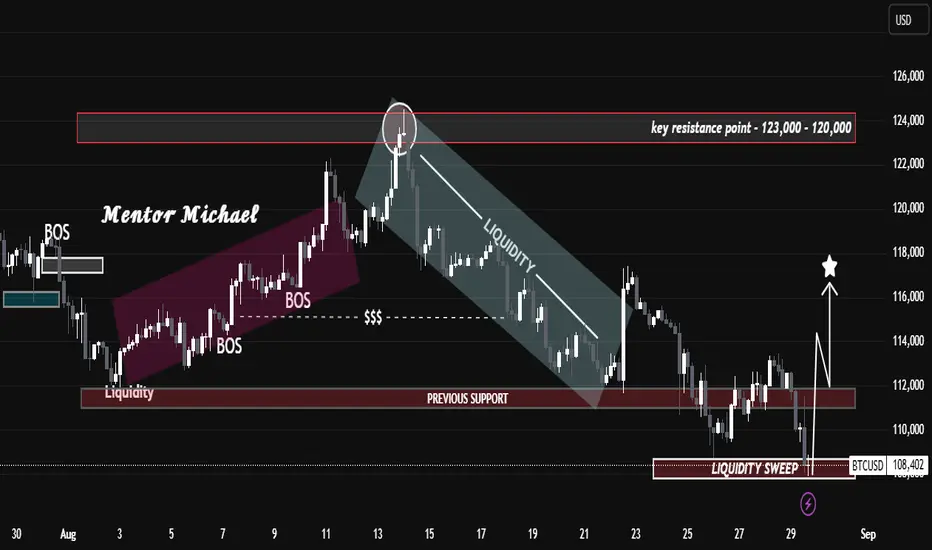
Resistance Rejection: Price sharply rejected the 120K – 123K resistance zone, confirming this area as a key supply level.
Bearish Liquidity Flow: After rejection, BTC flowed within a descending liquidity channel, continuously taking out internal supports before finding a base.
Previous Support → Liquidity Sweep: Around 108K, price executed a strong liquidity sweep, triggering stop hunts below prior support, then showing a bullish reaction.
Market Structure Shift Incoming: The sweep suggests a potential accumulation phase, where institutions collect orders before pushing price higher.
Upside Targets: If price holds above the reclaimed support at 112K, bullish momentum could aim for 116K – 118K in the near term ⭐.
⚠️ Risk Consideration: A failure to sustain above 108K would invalidate the bullish outlook, opening room for deeper downside.
📌 Summary:
BTCUSD is transitioning from a liquidity-driven decline into a possible reversal phase. The liquidity sweep at 108K could mark the start of a bullish leg if structure confirms with higher highs. Traders should monitor 112K as the short-term pivot point.
“The Art of Traps: Understanding Fake Breakouts in XAUUSD”“The Art of Traps: Understanding Fake Breakouts in XAUUSD”
This chart illustrates how gold (XAUUSD) is currently navigating a critical battle between resistance and support.
At the top, the resistance zone (3440–3460) has already shown signs of rejection, hinting at a possible fake breakout scenario. Such traps are common in financial markets—they draw traders into buying late, only for price to reverse and capture liquidity.
On the downside, the chart highlights two important stages:
The first target lies around 3400, where short-term buyers may start taking profits.
The final target sits at the key support zone (3330–3320), which has acted as a structural backbone in past moves. If this level holds, we can expect another bullish leg; if broken, deeper downside pressure could unfold.
The sequence of higher lows in recent weeks demonstrates strength in the broader trend, but it also warns that markets are building energy before a larger move. Liquidity sweeps (marked in the chart) serve as reminders that price does not move randomly—it often seeks zones where orders are concentrated.
🔑 Educational Takeaway:
Trading is not just about spotting breakouts; it’s about understanding whether those moves are genuine or deceptive. By studying price behavior at resistance and support, traders can avoid falling into liquidity traps and position themselves with the “smart money.”

Buy Opportunity in USOILAn upside opportunity is being developed. Scenario.
1. Choch has happened and price retracing towards FVG.
2. it is also taking support from trendlines.
3. If price rejects with volume in FVG zone, it may lead to good upside trade.
P.s. - It is just analysis not trading recommendation.

ETH Buy at perfect zone.ETH Buy scenario at perfect zone. ETH is creating a perfect scenario for buy on 4H TF.
1. Price is at support, FVG and OB confluence in premium zone at OTE.
2. Also showing rejection in price action.
3. Trend line is faked out.
P.S. - it is just analysis not any trade recommendation.

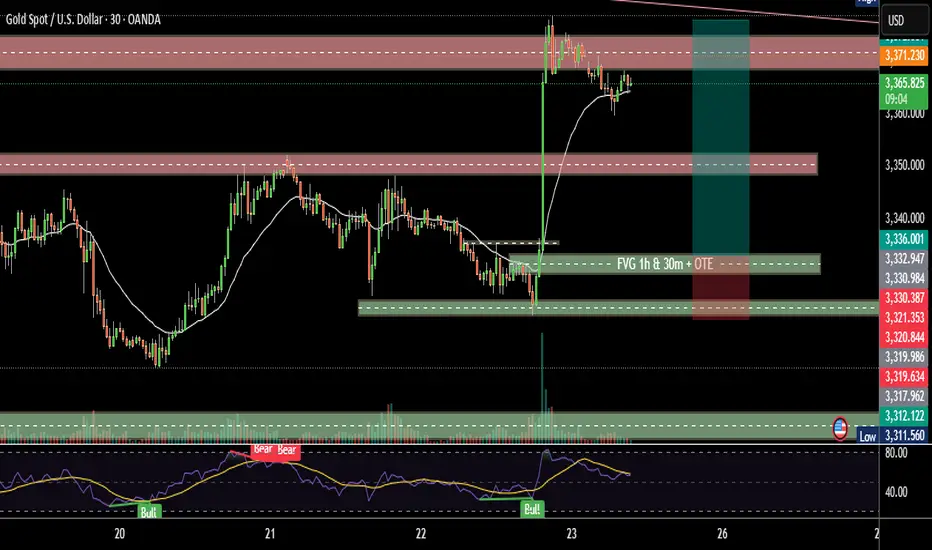
A good scenario being devolved in Gold.A good scenario being devolved in Gold.
1. Displacement is done.
2. Overlapping FVGs in different time frames 1h, 30m and 15m are formed.
3. These FVGs are formed at OTE level.
4. OB is also kind of overlapping these FVGS.
There may be a good scenario of buying if MSS happens in lower time frame with this POI.
"BTC Hits Premium Zone – Is $117K the Next Stop?""BTC Hits Premium Zone – Is $117K the Next Stop?"
Bitcoin has rallied into the $121,000–$123,000 resistance zone, aligning with a Fair Value Gap (FVG) and a Breaker Block, both of which are high-probability reversal points in Smart Money Concepts (SMC). This region represents a premium pricing area, where institutions often take profits and trigger retracements.
Key Observations:
Liquidity Sweep: Prior highs have been taken, potentially fulfilling buy-side liquidity objectives.
Breaker Block Resistance: Price is currently reacting to this zone, indicating sellers stepping in.
Fair Value Gap: The unfilled imbalance between $121,000–$123,000 is acting as a short-term supply area.
Projected Retracement: A move down toward $117,000 is anticipated, coinciding with prior structure support and a liquidity pocket.
Technical Levels:
Resistance Zone: $121,000–$123,000
Target Zone: $117,000 (first key support)
Major Support: $112,000–$113,000 range
Bias: Short-term bearish toward $117,000 before potential continuation, unless price closes strongly above $123,000, invalidating the reversal thesis.

$BTC Weekly Bearish Divergence is Screaming!BTC has been moving up nicely on the weekly, no doubt. But right now, it’s literally sitting on a major trendline support. I mean, this is make-or-break territory. If we lose this level and drop below $109K, I’m telling you — it could flush straight down to $95K–$90K. That’s a clean gap zone, no real structure there.
And here’s what’s bugging me — RSI is throwing up a bearish divergence, and the Stochastic RSI is also screaming the same thing. Just waiting on that MACD crossover confirmation... if that happens and the trendline breaks, this thing might not even wait for a proper retest. Could dump hard.
I’m not buying the $150K narratives right now. Personally, I don’t see it going past $125K in this cycle unless something wild happens.
Keeping it real — this is the level I’m watching like a hawk. If we break, strap in.

TARC: Swing Pick (Breakout Candidate)#Tarc #swingtrade #threewhitesoldiers #fvg #fairvaluegaps #trendingstock #breakoutstock
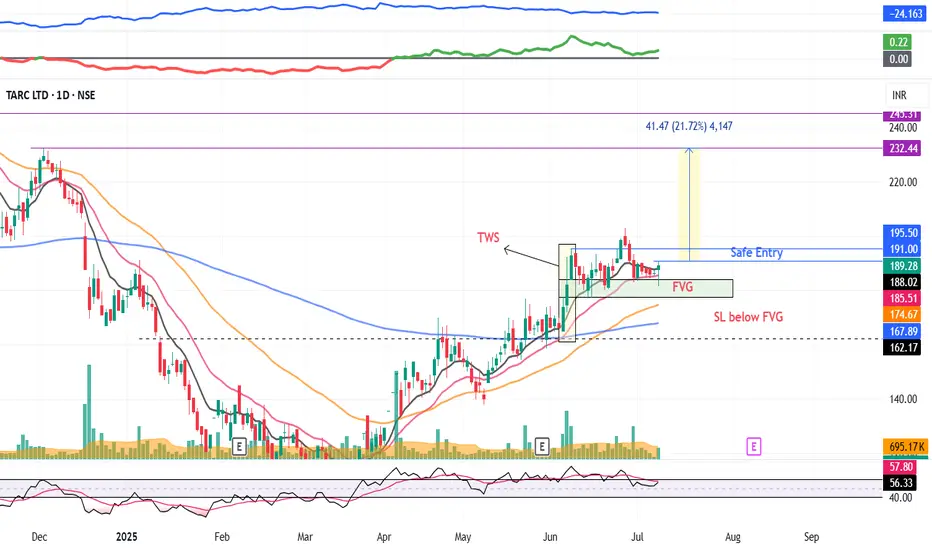
TARC : Breakout Candidate
>> Up-trending stock
>> TWS Visible
>> Bounce back from FVG
>> Trending setup
>> Good Volume & Strength
>> Risk Reward Favorable
Swing Traders can lock profit at 10% and keep Trailing
Please Boost, comment and follow us for more Learnings.
Disc : Charts shared are for learning purpose only, not a Trade recommendation. Do your own research and consult your financial advisor before taking any position.
GOLD BULLISH PATTERN AND TREND CONTINNUE ALERT!Hey to all my followers.
there is the scenerio for now gold is going to the level of 2950 level and 2955 so wait for gold fake out and then market is fall down and if you see there is FVG in H1 so market goes for sell and then we see again GOLD pump.
TODAY is PPI news so we see big move in market so maybe gold respect this FVG and buy side target areas
2970 2980 3000
follow my idea and use proper risk management 1:2 ratio

PARAGMILK By KRS Charts24th Feb 2025 / 11:42 AM
Why PARAGMILK?
1. Fundamentally Undervalued Stock with Good Financial figures. 🎯
2. Technically, Wave counts wise It is in last leg of correction.🔥
3. After Wave count it is showing Higher Low as per Dow Theory. ✅
4. +OB with FVG is visible, most importantly reversal is confirmed by Green Candle from 50% Encroachment. 📈
5. RSI is above 40. which is good for swing Trade buy side.
Expected Target Short and Med T is posted in Chart 👆
SL as per Closing basis in 1D.
