EUR/USD – Trap or Trend Continuation?EUR/USD – Trap or Trend Continuation?
The market has recently transitioned from a strong directional advance into a phase of hesitation and balance. After a sustained upward expansion marked by clear momentum and orderly price progression, buying pressure has begun to slow. This slowdown is evident through reduced follow-through, shorter price extensions, and increased overlap between successive price movements.
Current price action reflects a state of consolidation rather than continuation. The market is no longer accelerating higher, but it is also not showing aggressive selling. This suggests that participants who benefited from the prior move are reassessing exposure, while new buyers are less willing to commit at current levels. As a result, price is fluctuating within a relatively narrow range, indicating temporary equilibrium between demand and supply.
Attempts to push higher have been met with limited acceptance, hinting at exhaustion in the recent upward move. Momentum appears to be waning, and price behavior shows signs of distribution, where activity becomes choppy and directional conviction weakens. This phase often precedes either a corrective move or a renewed expansion, depending on which side regains control.
If downside pressure increases, price is likely to seek lower valuation areas where participation previously increased. Such a move would be considered a corrective adjustment within the broader context of the prior advance rather than an outright reversal, unless selling becomes impulsive and sustained. Conversely, if buyers regain confidence and price is accepted above the recent consolidation zone, the market could resume its prior expansion with renewed strength.
Overall, the market is at an inflection point. The dominant move that brought price to current levels has lost momentum, and the next meaningful direction will depend on whether balance resolves in favor of continuation or correction. Patience is warranted until price demonstrates clear acceptance in one direction, as trading during this phase carries elevated risk of false moves.
Fxtrading

EUR/USD Decision PhaseEUR/USD Decision Phase
Recent candles indicate a slowdown in upside follow-through, implying that short-term positioning may be crowded. This pause does not immediately invalidate the broader constructive tone but introduces the risk of a corrective rotation as liquidity is rebalanced. The projected move on the chart highlights a scenario where price may seek efficiency before determining the next directional leg.
Overall conditions suggest the market is transitioning from expansion into evaluation. Continuation higher would require renewed participation, while failure to attract follow-through could lead to a deeper reset driven by profit-taking and short-term repricing. Patience is advised as the market reveals whether this phase resolves through continuation or corrective realignment.
Price action reflects a market that has recently expanded after a prolonged phase of balanced participation. The sequence of higher intraday pushes shows growing initiative from buyers, supported by repeated structure continuation and shallow pullbacks, suggesting confidence rather than urgency. Momentum has remained constructive, with price spending more time advancing than correcting, a sign of controlled accumulation rather than emotional buying.
Recent candles indicate a slowdown in upside follow-through, implying that short-term positioning may be crowded. This pause does not immediately invalidate the broader constructive tone but introduces the risk of a corrective rotation as liquidity is rebalanced. The projected move on the chart highlights a scenario where price may seek efficiency before determining the next directional leg.
Overall conditions suggest the market is transitioning from expansion into evaluation. Continuation higher would require renewed participation, while failure to attract follow-through could lead to a deeper reset driven by profit-taking and short-term repricing. Patience is advised as the market reveals whether this phase resolves through continuation or corrective realignment.

Plan BUY Gold of ngohungsky941 for you, welcome f.l w.e!Plan BUY Gold of ngohungsky941 for you
3955-3960 to 4050, STP 3940
Lest 'go!

EURUSD – Wave 5 Long SetupIdea: EURUSD has completed a clean Elliott Wave (1-2-3-4) structure on the 1H chart and is now setting up for the final Wave (5) push to the upside. Price has broken above short-term resistance and is aiming for the next liquidity zone.
🔹 Entry: 1.16609
🔹 Target: 1.17015 🎯
🔹 Stop Loss: 1.16271 ❌
✅ Reasons for Long Bias:
Clear Elliott Wave progression with Wave 5 in play.
Strong recovery from Wave 4 support zone.
Next resistance aligns with Wave 5 target around 1.1700 psychological level.
Favorable R:R ratio, keeping risk well defined.
⚠️ Risk Management: Always trade with position sizing that suits your account. Stop loss is placed below Wave 4 to protect from invalidation.
📌 Disclaimer
This is purely for educational purposes and not financial advice. Please do your own research before entering any trades.

GOLD SELL RECOMMENDATION (XAU/USD)🔴 GOLD SELL RECOMMENDATION (XAU/USD)
🕒 Timeframe: 15 minutes (M15)
📆 Date: July 16, 2025
✅ Trade Parameters:
Sell Entry Zone: 3,341 – 3,342 USD/oz
Stop Loss (SL): 3,351 USD
Take Profit (TP): 3,307 USD
📊 Technical Analysis:
Price is retracing to test a dynamic resistance zone, near the 200 EMA and upper Bollinger Band.
A bearish candle with high volume signals a potential return of selling pressure.
The 3,341–3,342 zone aligns with the Fibonacci 0.5–0.618 retracement from the recent move, a strong confluence for a sell setup.
Risk-to-Reward (RR) ratio is approximately 1:3.5, indicating a favorable trade.
📌 Suggested Strategy:
Sell within the 3341–3342 range. Place a stop loss at 3351 and target 3307 for take profit. Once the price moves halfway to the target, consider trailing your stop to breakeven to secure profits.
fl me and ytb

Trade Setup – SELL GOLD (XAU/USD)✅ Trade Setup – SELL GOLD (XAU/USD)
📅 Date: July 7–10, 2025
🕒 Timeframe: 1H (Hourly)
🎯 Trade Parameters:
Sell Entry Zone: 3,322 – 3,330 USD/oz (previous support turned resistance + MA20 + Fibonacci 0.236)
Stop Loss (SL): 3,336 USD (above local resistance and moving average)
Take Profit (TP):
• TP1: 3,260 USD (near Fibonacci 0.618 and historical support)
• TP2: 3,168 – 3,160 USD (deeper support zone and Fibo 0.786)
📊 Technical Analysis:
Price has broken the short-term ascending trendline and is testing from below — suggesting a potential bearish continuation.
Recent candles closed below the 20 & 50-period moving averages, showing weak upside momentum.
Volume rises during bearish moves, and shrinks on retracements — indicating sellers are in control.
Bollinger Bands are expanding downward, confirming momentum is building to the downside.
🧭 Trading Strategy:
Wait for price to retest the 3,322–3,330 zone with bearish confirmation (e.g., engulfing, pin bar).
Partial take profit at 3,260, and hold remainder for TP2 if breakdown continues.
Place strict SL at 3,336 to minimize risk if resistance breaks.

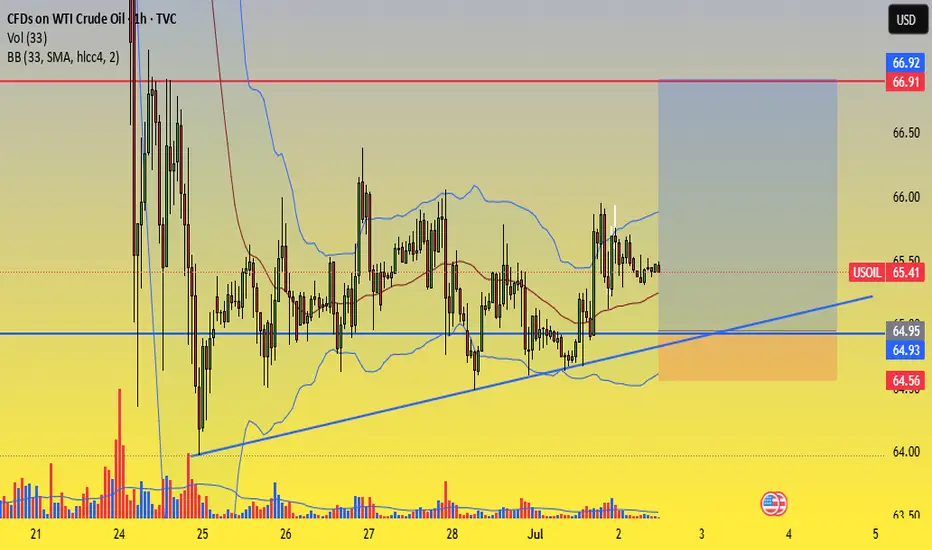
Trade Setup – BUY WTI Crude Oil (USOIL)✅ Trade Setup – BUY WTI Crude Oil (USOIL)
📅 Date: July 2–3, 2025
🕒 Timeframe: 1H
🎯 Trade Parameters:
Buy Zone (Entry): 65.00 – 64.90 USD/barrel
Stop Loss (SL): 64.55 USD (below rising trendline and lower Bollinger Band)
Take Profit (TP):
• TP1: 66.50 USD
• TP2: 67.00 USD
📊 Technical Analysis Highlights:
Rising trendline from June 24 continues to hold, forming a solid support area around 64.9–65.0.
Bollinger Bands are narrowing, indicating potential volatility expansion. Price is consolidating near the mid-band (MA20), often a precursor to bullish breakout.
Volume shows signs of accumulation around the trendline, suggesting buying interest at key support.
Multiple rejections from 64.90 without breakdown reinforces this level as near-term support.
🧭 Strategy Notes:
Enter on price pullback to the 65.00–64.90 zone with confirmation (e.g. bullish pin bar, engulfing pattern, volume spike).
Suggested position management:
• Take 50% profit at 66.50
• Hold the remaining 50% toward 67.00 if momentum is strong.
If price breaks below 64.55 with strong volume, exit the trade to preserve capital.
Good luck Everybody! Fl me here and ytb ! Thanks
USDJPY Trade Recommendation – Second SELL Entry (15-Min Chart)🔻 Strategy: Continue selling with the short-term downtrend, entering on technical pullback
🎯 Trade Setup:
Sell Entry Zone: 143.94 – 144.00
Stop Loss (SL): 144.45 (just above SMA89 and minor resistance zone)
Take Profit (TP): 143.28 – 143.36
Risk:Reward Ratio: Approx. 1:2.5 to 1:3
📊 Technical Analysis:
1. Trend Direction:
The market is clearly in a short-term downtrend on the 15-minute timeframe.
Price has been forming lower highs and lower lows, indicating strong bearish pressure.
2. Dynamic Resistance – SMA89:
SMA89 (red line) is acting as dynamic resistance, consistently rejecting price.
The entry zone aligns with previous minor resistance and the down-sloping SMA, making it ideal for re-entry short positions.
3. Target Zone – Technical Support:
TP zone (143.28 – 143.36) is a recent swing low/support level, likely to be revisited if bearish momentum continues.
=> Fl and tradding with me!

Trade Recommendation – USDCAD Buy Position (30-Minute Chart)PAIR: USDCAD
TRADE TYPE: BUY
TIMEFRAME: 30-Minute (M30)
ANALYSIS TIME: 10:35 AM, April 25, 2025 (UTC+7)
STRATEGY: Trend-following + EMA33 (High/Low) + Pullback Signal
✅ Trade Setup:
Entry: BUY around 1.3865
Stop Loss (SL): 1.3838
Take Profit (TP): 1.3957
Risk-Reward Ratio: 1:3.2 (high reward-to-risk setup)
🔍 Technical Analysis:
Short-term trend: Price is in a mild uptrend, forming higher lows.
EMA 33 (High/Low): Price is hovering near EMA33, showing a potential pullback bounce.
Price Structure: After a short-term correction, USDCAD is consolidating and showing signs of a potential breakout above recent highs.
Volume: Increased buying volume during bullish moves indicates strong buying interest.
📌 Trade Management Tips:
Hold the position if price breaks above 1.3885 with strong volume.
Consider trailing stop or move SL to breakeven once price hits 1.3900.
This setup is suitable for short-term swing trading within M30–H1 timeframe.

ETH/USD BUY Recommendation 1620-1625 – April 21, 2025🔔 ETH/USD BUY Recommendation – April 21, 2025
(Based on short-term technical analysis)
📌 Current Price: 1,625 USD
✅ Entry Zone: Around 1,625 – 1,618 USD
🔰 Stop Loss: Below the strong support zone at 1,608 USD
🎯 Take Profit Target 1: 1,774 USD
🎯 Take Profit Target 2: 1,826 USD
📈 Risk:Reward Ratio: Approximately 4:1 – 5:1
🧠 Technical Analysis:
ETH has broken above the 50 and 100 Moving Averages, signaling a bullish momentum after a consolidation phase.
The breakout candle on April 21 was supported by a strong spike in volume, confirming renewed buying interest.
The 1,618 – 1,608 USD zone is a key support area and previous local bottom.
The 200 MA (black curve) is still sloping downward but remains at a safe distance, allowing room for short-term upside.
📣 Trading Strategy:
Traders may consider opening a Long position around 1,618 – 1,625 USD, targeting the resistance zones at 1,774 USD and potentially 1,826 USD.
Apply strict risk management; avoid risking more than 2% of your portfolio on a single trade.
⚠️ Note: The crypto market is highly volatile — stay updated to adjust your trading plan. This is best suited for short-term Swing Trading over 3–5 days.
FL me now! Gook Luck!

XAU#3: Gold Rises and Trading Plan💎 💎 💎 Plan ahead to help you make a profit. Leave a comment and tag your friends to share. 💎 💎 💎
Today I will continue to bring everyone a perspective on XAU and the next trading plan.
1️⃣ **Fundamental analysis:**
📊 🔴 US inflation accelerated in December and the Fed is facing a new challenge. This increases risk sentiment for the market.
▫️ In addition, some analysts are pointing out that Trump's job cut plan could push the unemployment rate up. The US economy faces more risks, causing money to flow into secured assets such as: Gold, BTC ....
2️⃣ **Technical Analysis:**
🔹 **D Frame:** Yesterday's closing showed a strong increase in gold after the announcement of the inflation index. The price will continue to find the resistance area above.
🔹 **H4 Frame:** The bullish price structure remains intact.
🔹 **H1 Frame:** The price has completely broken through the resistance area of 269x. The next target will be the area of 2725~2752
3️⃣ **Trading Plan:**
Thanks to the previous plan, we have made a small profit. You can see that planning in advance gives us an overview and shapes our trading psychology
⛔ **Absolutely do not SELL** at the present time, when the price structure shows an upward trend in both the short and long term
✅** If you want to BUY in the right direction to make a profit**, we can completely wait until the price returns to the support zone below as I have drawn on the chart. Or if you cannot be patient, remember that you should trade with a small volume and accept that you will lose that amount of money
📌 For any questions, please contact us directly. I am ready to answer you for free
💪 **Wish you successful trading!** 🚀

Euro Weekly SetupEURUSD weekly setup suggesting major short.
charts shows some rally on long expected just to enter short from level 1.05900 for target 1.03350

Torrent PharmaAll important points are marked.
𝐃𝐢𝐬𝐜𝐥𝐚𝐢𝐦𝐞𝐫: 𝐈𝐧𝐯𝐞𝐬𝐭𝐦𝐞𝐧𝐭 𝐢𝐧 𝐬𝐞𝐜𝐮𝐫𝐢𝐭𝐢𝐞𝐬 𝐦𝐚𝐫𝐤𝐞𝐭 𝐚𝐫𝐞 𝐬𝐮𝐛𝐣𝐞𝐜𝐭 𝐭𝐨 𝐦𝐚𝐫𝐤𝐞𝐭 𝐫𝐢𝐬𝐤𝐬, 𝐫𝐞𝐚𝐝 𝐚𝐥𝐥 𝐭𝐡𝐞 𝐫𝐞𝐥𝐚𝐭𝐞𝐝 𝐝𝐨𝐜𝐮𝐦𝐞𝐧𝐭𝐬 𝐜𝐚𝐫𝐞𝐟𝐮𝐥𝐥𝐲 𝐛𝐞𝐟𝐨𝐫𝐞 𝐢𝐧𝐯𝐞𝐬𝐭𝐢𝐧𝐠. 𝐒𝐭𝐨𝐜𝐤𝐬 𝐬𝐮𝐠𝐠𝐞𝐬𝐭𝐞𝐝 𝐢𝐧 𝐭𝐡𝐢𝐬 𝐠𝐫𝐨𝐮𝐩 𝐚𝐫𝐞 𝐟𝐨𝐫 𝐞𝐝𝐮𝐜𝐚𝐭𝐢𝐨𝐧 𝐩𝐮𝐫𝐩𝐨𝐬𝐞. 𝐖𝐞 𝐝𝐨𝐧𝐭 𝐦𝐚𝐤𝐞 𝐚𝐧𝐲 𝐩𝐫𝐨𝐟𝐢𝐭𝐬 𝐟𝐫𝐨𝐦 𝐭𝐡𝐢𝐬 𝐫𝐞𝐜𝐨𝐦𝐦𝐞𝐧𝐝𝐚𝐭𝐢𝐨𝐧𝐬 𝐞𝐯𝐞𝐫𝐲𝐭𝐡𝐢𝐧𝐠 𝐬𝐡𝐚𝐫𝐞𝐝 𝐡𝐞𝐫𝐞 𝐚𝐫𝐞 𝐜𝐨𝐦𝐩𝐥𝐞𝐭𝐞𝐥𝐲 𝐨𝐟 𝐟𝐫𝐞𝐞 𝐨𝐟 𝐜𝐨𝐬𝐭.

GRANULES INDIA LTDBuy above 595
All important points are marked.
𝐃𝐢𝐬𝐜𝐥𝐚𝐢𝐦𝐞𝐫: 𝐈𝐧𝐯𝐞𝐬𝐭𝐦𝐞𝐧𝐭 𝐢𝐧 𝐬𝐞𝐜𝐮𝐫𝐢𝐭𝐢𝐞𝐬 𝐦𝐚𝐫𝐤𝐞𝐭 𝐚𝐫𝐞 𝐬𝐮𝐛𝐣𝐞𝐜𝐭 𝐭𝐨 𝐦𝐚𝐫𝐤𝐞𝐭 𝐫𝐢𝐬𝐤𝐬, 𝐫𝐞𝐚𝐝 𝐚𝐥𝐥 𝐭𝐡𝐞 𝐫𝐞𝐥𝐚𝐭𝐞𝐝 𝐝𝐨𝐜𝐮𝐦𝐞𝐧𝐭𝐬 𝐜𝐚𝐫𝐞𝐟𝐮𝐥𝐥𝐲 𝐛𝐞𝐟𝐨𝐫𝐞 𝐢𝐧𝐯𝐞𝐬𝐭𝐢𝐧𝐠. 𝐒𝐭𝐨𝐜𝐤𝐬 𝐬𝐮𝐠𝐠𝐞𝐬𝐭𝐞𝐝 𝐢𝐧 𝐭𝐡𝐢𝐬 𝐠𝐫𝐨𝐮𝐩 𝐚𝐫𝐞 𝐟𝐨𝐫 𝐞𝐝𝐮𝐜𝐚𝐭𝐢𝐨𝐧 𝐩𝐮𝐫𝐩𝐨𝐬𝐞. 𝐖𝐞 𝐝𝐨𝐧𝐭 𝐦𝐚𝐤𝐞 𝐚𝐧𝐲 𝐩𝐫𝐨𝐟𝐢𝐭𝐬 𝐟𝐫𝐨𝐦 𝐭𝐡𝐢𝐬 𝐫𝐞𝐜𝐨𝐦𝐦𝐞𝐧𝐝𝐚𝐭𝐢𝐨𝐧𝐬 𝐞𝐯𝐞𝐫𝐲𝐭𝐡𝐢𝐧𝐠 𝐬𝐡𝐚𝐫𝐞𝐝 𝐡𝐞𝐫𝐞 𝐚𝐫𝐞 𝐜𝐨𝐦𝐩𝐥𝐞𝐭𝐞𝐥𝐲 𝐨𝐟 𝐟𝐫𝐞𝐞 𝐨𝐟 𝐜𝐨𝐬𝐭.

AJANTA PHARMA LTDBuy Ajanta above: 3351 only.
All important points are marked.
𝐃𝐢𝐬𝐜𝐥𝐚𝐢𝐦𝐞𝐫: 𝐈𝐧𝐯𝐞𝐬𝐭𝐦𝐞𝐧𝐭 𝐢𝐧 𝐬𝐞𝐜𝐮𝐫𝐢𝐭𝐢𝐞𝐬 𝐦𝐚𝐫𝐤𝐞𝐭 𝐚𝐫𝐞 𝐬𝐮𝐛𝐣𝐞𝐜𝐭 𝐭𝐨 𝐦𝐚𝐫𝐤𝐞𝐭 𝐫𝐢𝐬𝐤𝐬, 𝐫𝐞𝐚𝐝 𝐚𝐥𝐥 𝐭𝐡𝐞 𝐫𝐞𝐥𝐚𝐭𝐞𝐝 𝐝𝐨𝐜𝐮𝐦𝐞𝐧𝐭𝐬 𝐜𝐚𝐫𝐞𝐟𝐮𝐥𝐥𝐲 𝐛𝐞𝐟𝐨𝐫𝐞 𝐢𝐧𝐯𝐞𝐬𝐭𝐢𝐧𝐠. 𝐒𝐭𝐨𝐜𝐤𝐬 𝐬𝐮𝐠𝐠𝐞𝐬𝐭𝐞𝐝 𝐢𝐧 𝐭𝐡𝐢𝐬 𝐠𝐫𝐨𝐮𝐩 𝐚𝐫𝐞 𝐟𝐨𝐫 𝐞𝐝𝐮𝐜𝐚𝐭𝐢𝐨𝐧 𝐩𝐮𝐫𝐩𝐨𝐬𝐞. 𝐖𝐞 𝐝𝐨𝐧𝐭 𝐦𝐚𝐤𝐞 𝐚𝐧𝐲 𝐩𝐫𝐨𝐟𝐢𝐭𝐬 𝐟𝐫𝐨𝐦 𝐭𝐡𝐢𝐬 𝐫𝐞𝐜𝐨𝐦𝐦𝐞𝐧𝐝𝐚𝐭𝐢𝐨𝐧𝐬 𝐞𝐯𝐞𝐫𝐲𝐭𝐡𝐢𝐧𝐠 𝐬𝐡𝐚𝐫𝐞𝐝 𝐡𝐞𝐫𝐞 𝐚𝐫𝐞 𝐜𝐨𝐦𝐩𝐥𝐞𝐭𝐞𝐥𝐲 𝐨𝐟 𝐟𝐫𝐞𝐞 𝐨𝐟 𝐜𝐨𝐬𝐭.

Chambal Fertilizers & Chemicals LimitedBuy above 550
All important points are marked.
𝐃𝐢𝐬𝐜𝐥𝐚𝐢𝐦𝐞𝐫: 𝐈𝐧𝐯𝐞𝐬𝐭𝐦𝐞𝐧𝐭 𝐢𝐧 𝐬𝐞𝐜𝐮𝐫𝐢𝐭𝐢𝐞𝐬 𝐦𝐚𝐫𝐤𝐞𝐭 𝐚𝐫𝐞 𝐬𝐮𝐛𝐣𝐞𝐜𝐭 𝐭𝐨 𝐦𝐚𝐫𝐤𝐞𝐭 𝐫𝐢𝐬𝐤𝐬, 𝐫𝐞𝐚𝐝 𝐚𝐥𝐥 𝐭𝐡𝐞 𝐫𝐞𝐥𝐚𝐭𝐞𝐝 𝐝𝐨𝐜𝐮𝐦𝐞𝐧𝐭𝐬 𝐜𝐚𝐫𝐞𝐟𝐮𝐥𝐥𝐲 𝐛𝐞𝐟𝐨𝐫𝐞 𝐢𝐧𝐯𝐞𝐬𝐭𝐢𝐧𝐠. 𝐒𝐭𝐨𝐜𝐤𝐬 𝐬𝐮𝐠𝐠𝐞𝐬𝐭𝐞𝐝 𝐢𝐧 𝐭𝐡𝐢𝐬 𝐠𝐫𝐨𝐮𝐩 𝐚𝐫𝐞 𝐟𝐨𝐫 𝐞𝐝𝐮𝐜𝐚𝐭𝐢𝐨𝐧 𝐩𝐮𝐫𝐩𝐨𝐬𝐞. 𝐖𝐞 𝐝𝐨𝐧𝐭 𝐦𝐚𝐤𝐞 𝐚𝐧𝐲 𝐩𝐫𝐨𝐟𝐢𝐭𝐬 𝐟𝐫𝐨𝐦 𝐭𝐡𝐢𝐬 𝐫𝐞𝐜𝐨𝐦𝐦𝐞𝐧𝐝𝐚𝐭𝐢𝐨𝐧𝐬 𝐞𝐯𝐞𝐫𝐲𝐭𝐡𝐢𝐧𝐠 𝐬𝐡𝐚𝐫𝐞𝐝 𝐡𝐞𝐫𝐞 𝐚𝐫𝐞 𝐜𝐨𝐦𝐩𝐥𝐞𝐭𝐞𝐥𝐲 𝐨𝐟 𝐟𝐫𝐞𝐞 𝐨𝐟 𝐜𝐨𝐬𝐭.

Exide IndustriesBuy above 515.
All important points are marked.
𝐃𝐢𝐬𝐜𝐥𝐚𝐢𝐦𝐞𝐫: 𝐈𝐧𝐯𝐞𝐬𝐭𝐦𝐞𝐧𝐭 𝐢𝐧 𝐬𝐞𝐜𝐮𝐫𝐢𝐭𝐢𝐞𝐬 𝐦𝐚𝐫𝐤𝐞𝐭 𝐚𝐫𝐞 𝐬𝐮𝐛𝐣𝐞𝐜𝐭 𝐭𝐨 𝐦𝐚𝐫𝐤𝐞𝐭 𝐫𝐢𝐬𝐤𝐬, 𝐫𝐞𝐚𝐝 𝐚𝐥𝐥 𝐭𝐡𝐞 𝐫𝐞𝐥𝐚𝐭𝐞𝐝 𝐝𝐨𝐜𝐮𝐦𝐞𝐧𝐭𝐬 𝐜𝐚𝐫𝐞𝐟𝐮𝐥𝐥𝐲 𝐛𝐞𝐟𝐨𝐫𝐞 𝐢𝐧𝐯𝐞𝐬𝐭𝐢𝐧𝐠. 𝐒𝐭𝐨𝐜𝐤𝐬 𝐬𝐮𝐠𝐠𝐞𝐬𝐭𝐞𝐝 𝐢𝐧 𝐭𝐡𝐢𝐬 𝐠𝐫𝐨𝐮𝐩 𝐚𝐫𝐞 𝐟𝐨𝐫 𝐞𝐝𝐮𝐜𝐚𝐭𝐢𝐨𝐧 𝐩𝐮𝐫𝐩𝐨𝐬𝐞. 𝐖𝐞 𝐝𝐨𝐧𝐭 𝐦𝐚𝐤𝐞 𝐚𝐧𝐲 𝐩𝐫𝐨𝐟𝐢𝐭𝐬 𝐟𝐫𝐨𝐦 𝐭𝐡𝐢𝐬 𝐫𝐞𝐜𝐨𝐦𝐦𝐞𝐧𝐝𝐚𝐭𝐢𝐨𝐧𝐬 𝐞𝐯𝐞𝐫𝐲𝐭𝐡𝐢𝐧𝐠 𝐬𝐡𝐚𝐫𝐞𝐝 𝐡𝐞𝐫𝐞 𝐚𝐫𝐞 𝐜𝐨𝐦𝐩𝐥𝐞𝐭𝐞𝐥𝐲 𝐨𝐟 𝐟𝐫𝐞𝐞 𝐨𝐟 𝐜𝐨𝐬𝐭.

HCL TechnologiesBreakout at 1830 will create new highs.
Positive candle closing above 1830 will be a buy Target will be 1899.
All important points are marked.
𝐃𝐢𝐬𝐜𝐥𝐚𝐢𝐦𝐞𝐫: 𝐈𝐧𝐯𝐞𝐬𝐭𝐦𝐞𝐧𝐭 𝐢𝐧 𝐬𝐞𝐜𝐮𝐫𝐢𝐭𝐢𝐞𝐬 𝐦𝐚𝐫𝐤𝐞𝐭 𝐚𝐫𝐞 𝐬𝐮𝐛𝐣𝐞𝐜𝐭 𝐭𝐨 𝐦𝐚𝐫𝐤𝐞𝐭 𝐫𝐢𝐬𝐤𝐬, 𝐫𝐞𝐚𝐝 𝐚𝐥𝐥 𝐭𝐡𝐞 𝐫𝐞𝐥𝐚𝐭𝐞𝐝 𝐝𝐨𝐜𝐮𝐦𝐞𝐧𝐭𝐬 𝐜𝐚𝐫𝐞𝐟𝐮𝐥𝐥𝐲 𝐛𝐞𝐟𝐨𝐫𝐞 𝐢𝐧𝐯𝐞𝐬𝐭𝐢𝐧𝐠. 𝐒𝐭𝐨𝐜𝐤𝐬 𝐬𝐮𝐠𝐠𝐞𝐬𝐭𝐞𝐝 𝐢𝐧 𝐭𝐡𝐢𝐬 𝐠𝐫𝐨𝐮𝐩 𝐚𝐫𝐞 𝐟𝐨𝐫 𝐞𝐝𝐮𝐜𝐚𝐭𝐢𝐨𝐧 𝐩𝐮𝐫𝐩𝐨𝐬𝐞. 𝐖𝐞 𝐝𝐨𝐧𝐭 𝐦𝐚𝐤𝐞 𝐚𝐧𝐲 𝐩𝐫𝐨𝐟𝐢𝐭𝐬 𝐟𝐫𝐨𝐦 𝐭𝐡𝐢𝐬 𝐫𝐞𝐜𝐨𝐦𝐦𝐞𝐧𝐝𝐚𝐭𝐢𝐨𝐧𝐬 𝐞𝐯𝐞𝐫𝐲𝐭𝐡𝐢𝐧𝐠 𝐬𝐡𝐚𝐫𝐞𝐝 𝐡𝐞𝐫𝐞 𝐚𝐫𝐞 𝐜𝐨𝐦𝐩𝐥𝐞𝐭𝐞𝐥𝐲 𝐨𝐟 𝐟𝐫𝐞𝐞 𝐨𝐟 𝐜𝐨𝐬𝐭.

SHREE RENUKA SUGARAll important points are marked.
𝐃𝐢𝐬𝐜𝐥𝐚𝐢𝐦𝐞𝐫: 𝐈𝐧𝐯𝐞𝐬𝐭𝐦𝐞𝐧𝐭 𝐢𝐧 𝐬𝐞𝐜𝐮𝐫𝐢𝐭𝐢𝐞𝐬 𝐦𝐚𝐫𝐤𝐞𝐭 𝐚𝐫𝐞 𝐬𝐮𝐛𝐣𝐞𝐜𝐭 𝐭𝐨 𝐦𝐚𝐫𝐤𝐞𝐭 𝐫𝐢𝐬𝐤𝐬, 𝐫𝐞𝐚𝐝 𝐚𝐥𝐥 𝐭𝐡𝐞 𝐫𝐞𝐥𝐚𝐭𝐞𝐝 𝐝𝐨𝐜𝐮𝐦𝐞𝐧𝐭𝐬 𝐜𝐚𝐫𝐞𝐟𝐮𝐥𝐥𝐲 𝐛𝐞𝐟𝐨𝐫𝐞 𝐢𝐧𝐯𝐞𝐬𝐭𝐢𝐧𝐠. 𝐒𝐭𝐨𝐜𝐤𝐬 𝐬𝐮𝐠𝐠𝐞𝐬𝐭𝐞𝐝 𝐢𝐧 𝐭𝐡𝐢𝐬 𝐠𝐫𝐨𝐮𝐩 𝐚𝐫𝐞 𝐟𝐨𝐫 𝐞𝐝𝐮𝐜𝐚𝐭𝐢𝐨𝐧 𝐩𝐮𝐫𝐩𝐨𝐬𝐞. 𝐖𝐞 𝐝𝐨𝐧𝐭 𝐦𝐚𝐤𝐞 𝐚𝐧𝐲 𝐩𝐫𝐨𝐟𝐢𝐭𝐬 𝐟𝐫𝐨𝐦 𝐭𝐡𝐢𝐬 𝐫𝐞𝐜𝐨𝐦𝐦𝐞𝐧𝐝𝐚𝐭𝐢𝐨𝐧𝐬 𝐞𝐯𝐞𝐫𝐲𝐭𝐡𝐢𝐧𝐠 𝐬𝐡𝐚𝐫𝐞𝐝 𝐡𝐞𝐫𝐞 𝐚𝐫𝐞 𝐜𝐨𝐦𝐩𝐥𝐞𝐭𝐞𝐥𝐲 𝐨𝐟 𝐟𝐫𝐞𝐞 𝐨𝐟 𝐜𝐨𝐬𝐭.

EURUSD fades bounce off 200-SMA as EU/US inflation clues loomEURUSD marked the biggest daily gain in a week the previous day while bouncing off the 200-SMA as the Eurozone data came in overall positive while the US statistics mostly disappointed. Also allowing the Euro pair to rebound from the key SMA level is the consolidation ahead of today’s first readings of the EU inflation data and the US Core Personal Consumption Expenditure (PCE) Price Index, also known as the Federal Reserve’s (Fed) favorite inflation gauge. That said, the quote’s inability to defend the previous day’s rebound joins the bearish MACD signals and unimpressive RSI conditions to lure the bears. However, a daily closing beneath the 200-SMA support of 1.0787 becomes necessary for the seller’s return. It’s worth noting that a five-month-old resistance-turned-support line near 1.0790 and an upward-sloping trend line stretched from mid-April, close to 1.0750, act as additional downside filters. Should the pair sellers keep control past 1.0750, February’s low of 1.0694 and the yearly bottom marked in April around 1.0600 will be in the spotlight.
Alternatively, the EURUSD pair’s recovery remains elusive beneath a downward-sloping resistance line from early January, close to 1.0885 at the latest. That said, the 1.0900 threshold also stands tall to test the Euro bulls before directing them toward March’s peak of near 1.0980 and the 1.1000 psychological magnet. Furthermore, the quote’s successful trading beyond the 1.1000 mark allows the bulls to challenge the late 2023 top surrounding 1.1140, as well as the previous yearly peak of 1.1275.
To sum up, the EURUSD pair remains weak within a short-term trading range ahead of the key EU/US data.

EURUSD bounces off 1.0810 support confluence ahead of key PMIsEURUSD portrays a corrective bounce from the lowest level in a week, snapping a three-day losing streak, as traders await the first readings of the Eurozone and the US PMIs for May early Thursday. In doing so, the Euro pair also takes a U-turn from a convergence of the 100-SMA and previous resistance line stretched from late December 2023, close to 1.0810. The recovery also takes clues from the upbeat RSI (14) line and the bullish MACD signals, allowing buyers to remain hopeful. With this, the quote is likely to extend the latest rebound toward the 50% Fibonacci retracement of the December 2023 to April 2024 downturn, near 1.0870. However, a 4.5-month-old descending resistance line surrounding 1.0890 and the 61.8% Fibonacci ratio near 1.0940 could test the pair’s further upside. It’s worth noting that the highs marked in March and mid-January, respectively near 1.0980 and 1.1000, act as the final defense of the bears.
Alternatively, the EURUSD bears need validation from the EU/US PMIs, the 1.0810 support confluence, and the 1.0800 threshold to keep the reins. Following that, the Euro pair’s gradual decline toward the 23.6% Fibonacci retracement level of 1.0730 and then to February’s bottom of around 1.0695 can’t be ruled out. In a case where the sellers dominate past 1.0695, the prices become vulnerable to slump toward the yearly low marked in April around 1.0600.
To sum up, EURUSD is likely to witness recovery but the upside move hinges on a successful break of 1.0890 and the scheduled data points.

EURUSD bulls keep control ahead of ECB Minutes, US dataEURUSD pares the biggest daily gains of the week while posting mild losses early Friday. Even so, the Euro pair remains on the way to posting a four-week uptrend as traders prepare for the European Central Bank (ECB) Monetary Policy Meeting Accounts, also known as the ECB Minutes, as well as the preliminary readings of the US UoM Consumer Sentiment Index and Inflation Expectations. It should be noted that upbeat RSI and MACD conditions keep the buyers hopeful but a downward-sloping resistance line from early March, close to 1.0790 at the latest, guards the immediate upside of the pair. Apart from the oscillators like RSI and MACD, the looming “Golden Cross”, a bullish moving average crossover, also keep the buyers hopeful. However, a clear upside of the 5.5-month-old descending resistance line, near 1.0825 as we write, becomes necessary for the bulls to retake control. In that case, the gradual run-up toward March’s high of 1.0980 and then to the 1.1000 threshold can’t be ruled out.
Meanwhile, a pullback move remains uninteresting beyond the 50-SMA support of 1.0735. Following that, the lows marked in April and February, respectively around 1.0725 and 1.0695, could test the EURUSD bears before directing them to the yearly low marked in April around 1.0600. It’s worth noting that the Euro pair’s sustained weakness past 1.0600 makes it vulnerable to challenge the previous yearly bottom surrounding 1.0450-45 but the same needs validation from the strong US fundamentals, as well as downbeat EU catalysts.
Overall, EURUSD bulls are likely to retake control after staying off the grid for some time.
However, the fundamentals need to back the pair’s bullish technical details to support the upside bias.

100-SMA prods GBPUSD bears on BoE Super ThursdayGBPUSD stays defensive at the lowest level in a week, snapping a two-day losing streak, as the pair traders await the Bank of England’s (BoE) Monetary Policy Announcements, as well as the quarterly monetary policy report that makes the day a “Super Thursday”. It’s worth noting that the 100-SMA puts a short-term trading floor under the prices near 1.2480, especially amid the downbeat RSI suggesting a pause in the previous fall. However, the bearish MACD signals and the quote’s sustained downside break of a two-week-old support line, now immediate resistance surrounding 1.2515, and clear trading beneath a downward-sloping trend line resistance stretched since mid-March, at 1.2585 at the latest, keeps the sellers hopeful. Even if the Pound Sterling gains support from the BoE and rises past 1.2585, the monthly high of 1.2634 will be the last defense of the bears before giving control to the bulls.
Meanwhile, a downside break of the 100-SMA support of 1.2480, as well as the BoE’s inability to convince the GBPUSD bulls, will resume a south run targeting the 1.2400 threshold. In a case where the Cable bears keep the reins past 1.2400, the yearly bottom marked in April surrounding 1.2300 and the 61.8% Fibonacci Extension (FE) of the quote’s March-May moves, near 1.2265, will be in the spotlight ahead of the late 2023 bottom of near 1.2067.
Overall, the GBPUSD pair remains in a bearish trend on the BoE Super Thursday despite the latest consolidation. Hence, even a surprise rebound should not be considered a bullish sign.
