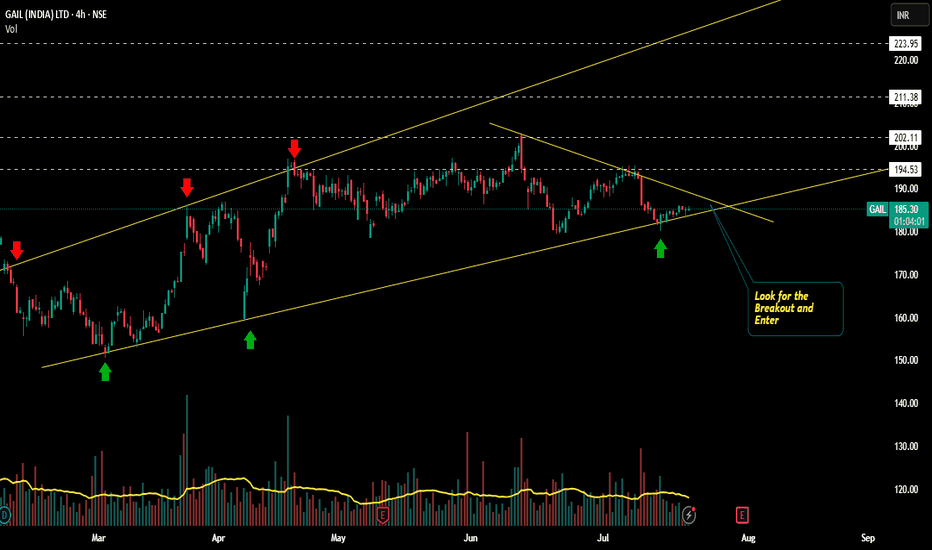
GAIL Bullish way ahead?!!!Chart patterns suggest me the above titled opinion
1. Its is travelling in a Ascending channel pattern making Higher highs and higher lows .
2. Now it is at the bottom support loading for the explosive move ahead.
3. Let's wait for the Breakout and enter.
Target levels mentioned in chart...SL update after breakout.
Longer time frames also shows the bullish edge in GAIL
This is just my opinion..... not a tip nor advice!!!!
Thank you!!!
GAIL
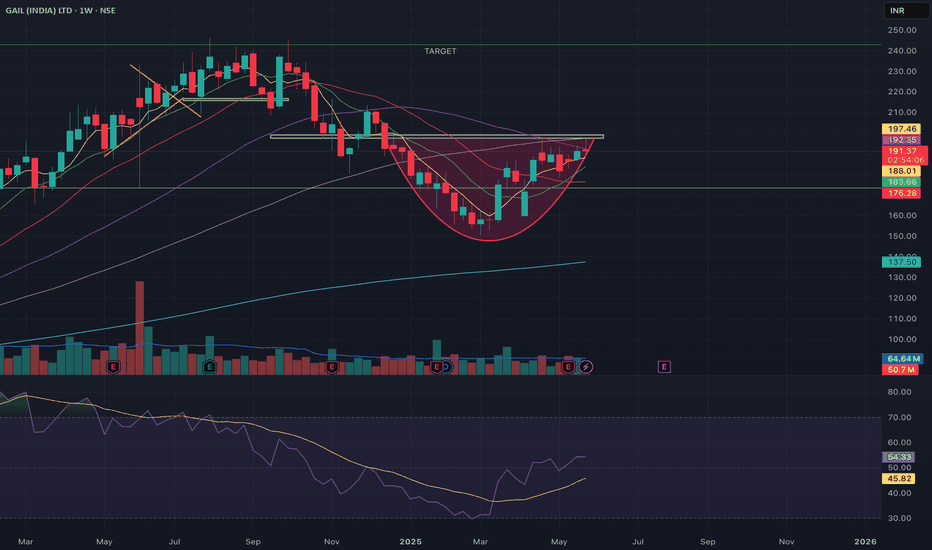
GAIL | Cup and Handle | Breakout | Daily
### 🏺 **Pattern Overview:**
✅ **Cup and Handle Breakout:**
* **Cup bottom:** \~₹152.51
* **Handle breakout level:** ₹196.00 (recently crossed)
* **Current price:** ₹200.09
The **measured move** (height of the cup) suggests a **target price of ₹240.50**.
---
### 📊 **Key Chart Levels:**
* **Resistance/Target:** ₹240.50–₹246.30
* **Immediate support:** ₹196.55 (breakout level)
* **Volume surge:** Volume picked up on breakout – strong confirmation.
* **RSI:** Clear breakout of downtrend line (marked in yellow), indicating momentum shift.
---
### 🔍 **What’s Next?**
* If price holds above ₹196.00, the move towards ₹240.50 is probable.
* A retest of ₹196.00 (handle breakout level) can be an opportunity for confirmation.
---
### 💡 **Key Takeaway:**
GAIL has completed a **Cup & Handle breakout** pattern. The breakout is confirmed with price and volume action, and RSI supporting strength. A medium-term target of **₹240.50–₹246** is on the cards.
Would you like me to draft a **video script** or **write-up** for these insights? Let me know! 🚀
GAIL - EXPECTING A BOUNCESymbol - GAIL
CMP - 158.10
GAIL Ltd. has been following a downward trend over recent months, with the overall technical structure remaining bearish. However, the stock has recently reached a crucial support zone, which lies between the 154-162 range, a level that has held strong since January 2024. This area serves as a key support zone, and it could offer the stock a potential bounce from its current bearish trend.
The stock is currently forming a rounding top pattern, a classic bearish formation that indicates a possible continuation of bearish trend at current levels or even trend reversal. Despite the overall bearish pattern, the price is consolidating near this important support level, which increases the probability of a bounce. While a short-term upward move is possible, the stock may resume its downtrend after this bounce.
In the short term, the trend is still slightly bearish. The stock has encountered some selling pressure near its support zone but is testing the resilience of this critical level. For me, The current market price around 158 offers an opportunity for a long position. It may be prudent to add more to this position as the price moves toward 153-152, while keeping a stop loss at 148 to manage risk.
However, if the stock breaks below 150 and sustains below this level, the current bounce scenario would be invalidated, and the stock would likely face further selling pressure, accelerating the downtrend.
Disclaimer - Do not consider this as a buy/sell recommendation. I'm sharing my analysis & my trading position. You can track it for educational purposes. Thanks!
GAIL cmp 192.42 by Daily Chart viewGAIL cmp 192.42 by Daily Chart view
- Price Band 183 to 188 Support Zone
- Daily basis Support at 182 > 171 > 160 with Resistance at 203 > 214 > 225
- Stock is assumed to be taking a fresh upside movement from Support Zone
- Volumes seen to be rising above the average traded qty over the past few days
- Price sustaining above Support Zone for few days may trigger upside momentum
GAIL: Key Levels to Watch for Potential Downside MovementDescription:
In this analysis of GAIL, we observe a potential bearish setup
Trigger Level: If the price breaks today's low, it may indicate further downside movement.
Stop Loss: Today's high serves as a prudent SL to manage risk.
Target: Monitor the mentioned levels or adjust based on price action dynamics.
⚠️ Disclaimer:
This analysis is for educational purposes only and is not a trading or investment recommendation. Please do your own research and consult a financial advisor before making any decisions.
GAIL 1D TFNSE:GAIL has retraced from a demand zone and has gained liquidity and is coming down again. We could take entry with a R;R of 1:1.5. And the possibility of this trade winning is more as there are many confirmations associated with this one.
Disclaimer:- This analysis is only for educational purpose. Please always do your own analysis or consult with your financial advisor before taking any kind of trades
BEL IS LOOKING BULLISHBEL is looking bullish as its reacted from strong zone. If if closes above 295 more bullishness will be added. These all views are my personal and posting here only for educational purposes. These are not buy/sell recommendations. Better contact your personal financial advisor before go are investing into any stock.
GAIL -Symmetrical Triangle -Near BreakoutGAIL -Symmetrical Triangle -Near Breakout
Name - GAIL
Pattern - Symmetrical triangle
Timeframe - Daily
Status - Near breakout
Cmp - 237
Target - 266 - need to close above 240
SL - 232
Pattern:
A symmetrical triangle pattern is a common chart pattern in technical analysis that indicates a period of consolidation before the price breaks out, either upward or downward.
Fundamental:
Here are some key fundamental ratios and metrics for GAIL (India) Ltd.:
Market Cap: ₹156,284 Cr
Current Price: ₹235.00
Price-to-Earnings (P/E) Ratio: 13.84
Price-to-Book (P/B) Ratio: 2.03
Return on Equity (ROE): 13.96%
Dividend Yield: 2.31%
Net Profit Margin: 22.88%
Debt-to-Equity Ratio: 0.248
GAIL is a leading natural gas company in India, with extensive infrastructure including over 11,500 km of natural gas pipelines and multiple LPG gas-processing units.
GAIL - Ichimoku Breakout📈 Stock Name - Gail (india) Limited
🌐 Ichimoku Cloud Setup:
1️⃣ Today's close is above the Conversion Line.
2️⃣ Future Kumo is Turning Bullish.
3️⃣ Chikou span is slanting upwards.
All these parameters are shouting BULLISH at the Current Market Price and even more bullishness anticipated AFTER crossing 238.
🚨Disclaimer: This is not a Buy or Sell recommendation. It's for educational purposes and a guiding light to learn trading in the market.
#CloudTrading
#IchimokuCloud
#IchimokuFollowers
#Ichimokuexpert
Excited about this analysis? Share your thoughts in the comments below!
👍 Like, Share, and Subscribe for daily market insights! 🚀
#StockAnalysis #MarketWatch #TradingEducation #ichimoku #midcap #smallcap #gail
Large Rectangle Breakout Seen in GAIL India Ltd.Hello Traders, i have brought another analysis on a pattern breakout which called (Rectangle Pattern). Well i have marked and written most of the things on chart, but still i am gonna to teach you here guy's about this pattern so if you see this next time, at least you guy's will be able to trade. So Let's start:-
Q:- What is Rectangle Pattern and How to Use Rectangle Chart Patterns to Trade Breakouts?
Rahul:-
A rectangle is a chart pattern formed when the price is bounded by parallel support and resistance levels.
A rectangle exhibits a period of consolidation or indecision between buyers and sellers as they take turns throwing punches but neither has dominated.
The price will “test” the support and resistance levels several times before eventually breaking out.
From there, the price could trend in the direction of the breakout, whether it is to the upside or downside.
we can clearly see Above in GAIL chart that the pair was bounded by two key price levels which are parallel to one another.
So, Traders, i hope you Guy's have learned today how to Trade Rectangle Pattern, but Mates We just have to wait until one of these levels breaks and go along for the ride!
Remember, when you spot a rectangle: THINK OUTSIDE THE BOX! That's it.
So now let's focus about company background.
Incorporated in 1984, GAIL, a Government of India undertaking, is an integrated natural gas company in India. It owns over 11,500 km of natural gas pipelines, over 2300 km of LPG pipelines, six LPG gas-processing units and a petrochemicals facility. It also has a joint-venture interest in Petronet LNG Ltd, Ratnagiri Gas and Power Pvt Ltd, and in the CGD business in several cities. GAIL has wholly owned subsidiaries in Singapore and the US for expanding its presence outside India in the segments of LNG, petrochemical trading and shale gas assets.
Market Cap
₹ 76,074 Cr.
Current Price
₹ 116
High / Low
₹ 123 / 83.0
Stock P/E
18.4
Book Value
₹ 98.8
Dividend Yield
3.46 %
ROCE
9.79 %
ROE
8.69 %
Face Value
₹ 10.0
Debt
₹ 17,816 Cr.
EPS
₹ 6.32
PEG Ratio
5.93
Promoter holding
51.9 %
Intrinsic Value
₹ 309
Pledged percentage
0.00 %
EVEBITDA
10.8
PROS
Stock is trading at 1.17 times its book value
Stock is providing a good dividend yield of 3.46%.
Company is expected to give good quarter
Company has been maintaining a healthy dividend payout of 43.6%
CONS
Company has a low return on equity of 13.8% over last 3 years.
Earnings include an other income of Rs.2,947 Cr.
Important levels for GAIL India Ltd.
Buy in between 112-117.
Targets we can see 130/140+
Keep Stop loss at 108.5
Price is above 200 EMA
We have seen Proper Breakout of Large Rectangle Pattern in weekly timeframe.
with Good Volume
Price is sustaining above breakout trendline and it has given pull back to retest the levels
MACD and RSI has given bullish crossover (I have not placed RSI here as i want chart neat and clean but i have analysed already)
Disclaimer:- Please always do your own analysis or consult with your financial advisor before taking any kind of trades.
Dear traders, If you like my work then do not forget to hit like and follow me, and guy's let me know what do you think about this idea in comment box, i would be love to reply all of you guy's.
Thankyou.
GAIL - Multi-year breakout in Monthly TimeframeGAIL has showcased a remarkable multi-year (16 years) breakout, establishing itself as a standout performer in the financial markets. This breakthrough is not merely a fleeting uptick but signifies a strategic ascent by successfully breaching key resistance levels that had acted as formidable barriers for 16 years.
Worth noting - VOLUMES Surge: What sets this breakout apart is the substantial surge in trading volumes accompanying the upward move. The volume increase provides a compelling validation of the market's confidence and reinforces the conviction behind the stock's newfound trajectory.
GAIL - SWING TRADE - 24th December #stocks#GAIL (1D TF)
Swing Trade Analysis given on 24th December, 2023 (Sunday)
Pattern: NECKLINE BREAKOUT
- Volume Spike at Resistance - Done ✓
- Breakout of Neckline Resistance - Done ✓
- Retracement & Consolidation - In Progress
#stocks #swingtrade #chartanalysis #traderyte
GAIL | Investment Pick📊 Details
Incorporated in 1984, GAIL, a Government of India undertaking, is an integrated natural gas company in India. It owns over 11,500 km of natural gas pipelines, over 2300 km of LPG pipelines, six LPG gas-processing units and a petrochemicals facility. It also has a joint-venture interest in Petronet LNG Ltd, Ratnagiri Gas and Power Pvt Ltd, and in the CGD business in several cities. GAIL has wholly owned subsidiaries in Singapore and the US for expanding its presence outside India in the segments of LNG, petrochemical trading and shale gas assets.
Disclaimer: This analysis is solely for educational purposes and does not make me a SEBI registered analyst.
If you found this analysis helpful, I encourage you to like and share it. Your observations and comments are also welcomed below. Your support, likes, follows, and comments motivate me to consistently share valuable insights with you.
🔍 More Analysis & Trade Setups 🔍
For more technical analysis and trade setups, make sure to follow me on TradingView: www.tradingview.com


