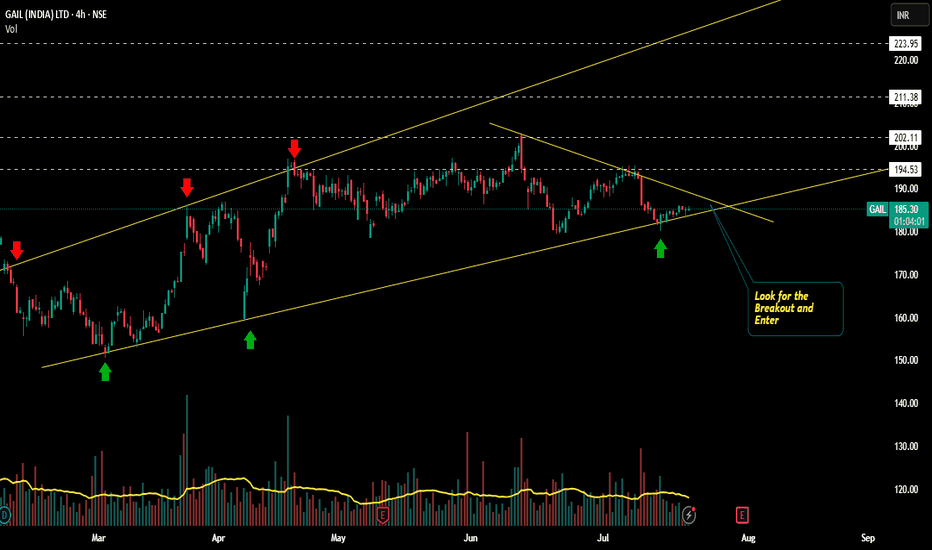
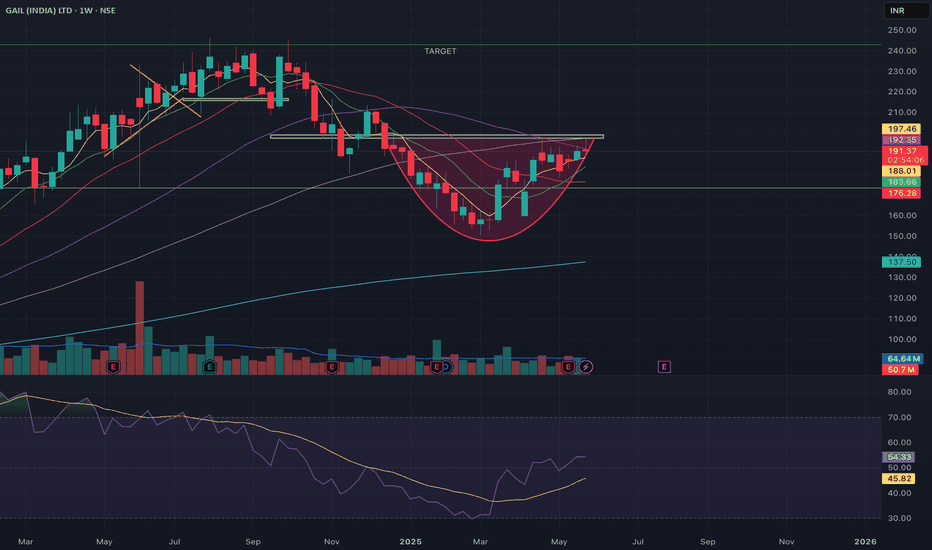
GAIL Bullish way ahead?!!!Chart patterns suggest me the above titled opinion
1. Its is travelling in a Ascending channel pattern making Higher highs and higher lows .
2. Now it is at the bottom support loading for the explosive move ahead.
3. Let's wait for the Breakout and enter.
Target levels mentioned in chart...SL update after breakout.
Longer time frames also shows the bullish edge in GAIL
This is just my opinion..... not a tip nor advice!!!!
Thank you!!!
Gailindia
GAIL – Daily Timeframe , about to boomFollow us for more such content.
GAIL is showing strong signs of a bullish breakout, with price holding steadily above key moving averages and positive trend indicators. Institutional accumulation appears to be behind this move, and a close above resistance could see significant upside.
There is a high chances for upcoming move in bullish side
GAIL - EXPECTING A BOUNCESymbol - GAIL
CMP - 158.10
GAIL Ltd. has been following a downward trend over recent months, with the overall technical structure remaining bearish. However, the stock has recently reached a crucial support zone, which lies between the 154-162 range, a level that has held strong since January 2024. This area serves as a key support zone, and it could offer the stock a potential bounce from its current bearish trend.
The stock is currently forming a rounding top pattern, a classic bearish formation that indicates a possible continuation of bearish trend at current levels or even trend reversal. Despite the overall bearish pattern, the price is consolidating near this important support level, which increases the probability of a bounce. While a short-term upward move is possible, the stock may resume its downtrend after this bounce.
In the short term, the trend is still slightly bearish. The stock has encountered some selling pressure near its support zone but is testing the resilience of this critical level. For me, The current market price around 158 offers an opportunity for a long position. It may be prudent to add more to this position as the price moves toward 153-152, while keeping a stop loss at 148 to manage risk.
However, if the stock breaks below 150 and sustains below this level, the current bounce scenario would be invalidated, and the stock would likely face further selling pressure, accelerating the downtrend.
Disclaimer - Do not consider this as a buy/sell recommendation. I'm sharing my analysis & my trading position. You can track it for educational purposes. Thanks!
GAIL: Pullback swing trade📊 Analysis :
Price trying to structure shift from Down trend to uptrend. Taking support on 21EMA with hammer candle. looking good for bullish move.
📈 Trading Plan :
Entry: Buy above 205.75 (wait for a breakout above candle at least 15-30 min with strong volume confirmation).
Target 1: 222
Target 2: 233 and so on...
Stop-Loss: 199 (Weekly closing basis)
Will update further price direction once price starts moving in bullish direction.
GAIL: Key Levels to Watch for Potential Downside MovementDescription:
In this analysis of GAIL, we observe a potential bearish setup
Trigger Level: If the price breaks today's low, it may indicate further downside movement.
Stop Loss: Today's high serves as a prudent SL to manage risk.
Target: Monitor the mentioned levels or adjust based on price action dynamics.
⚠️ Disclaimer:
This analysis is for educational purposes only and is not a trading or investment recommendation. Please do your own research and consult a financial advisor before making any decisions.
Fake Breakdown and Now PullbackNSE:GAIL Gave a Fake Breakdown from the Parallel Channel and Took Support on 100 EMA and again faked the 100 EMA Breakdown closing below it but in the past three days it has shown reversal trying to respect the 100 EMA and getting back into the rising Channel a close above 243 will give more strength to it when it reaches the midpoint of the channel.
Disclaimer: This analysis is intended solely for informational and educational purposes and should not be interpreted as financial advice. It is advisable to consult a qualified financial advisor or conduct thorough research before making investment decisions.
GAIL - Ichimoku Breakout📈 Stock Name - Gail (india) Limited
🌐 Ichimoku Cloud Setup:
1️⃣ Today's close is above the Conversion Line.
2️⃣ Future Kumo is Turning Bullish.
3️⃣ Chikou span is slanting upwards.
All these parameters are shouting BULLISH at the Current Market Price and even more bullishness anticipated AFTER crossing 238.
🚨Disclaimer: This is not a Buy or Sell recommendation. It's for educational purposes and a guiding light to learn trading in the market.
#CloudTrading
#IchimokuCloud
#IchimokuFollowers
#Ichimokuexpert
Excited about this analysis? Share your thoughts in the comments below!
👍 Like, Share, and Subscribe for daily market insights! 🚀
#StockAnalysis #MarketWatch #TradingEducation #ichimoku #midcap #smallcap #gail
Gail going for a dip after ATH. Bearish move expected.Gail has given a nice bullish rally after crossing the previous ATH of 131.5.
There has been a 30% bullish rally. It has formed a double top and once it starts trading below 155.80 level it will confirm a "M" pattern too,
Today there was a nice sell of in the stock and it closed 5.5% lower with good volumes.
Even the RSI indicator is showing a bearish divergence on the daily charts. Chances are thereof it testing the lower levels around 151 and 147.
Target levels :- 151.7, 147.5, 142
It has closed below 38.2% fibonacci level, will come to test 50% and further targets of 61.8%.
Wait for the stock to cross today's low after a flat or slight gap up opening.
The retracement after forming a new high is remaining in the stock. And profits will be booked by the swing trades.
Keep in mind the R:R ratio and SL while entering the trade.
GAIL - SWING TRADE - 24th December #stocks#GAIL (1D TF)
Swing Trade Analysis given on 24th December, 2023 (Sunday)
Pattern: NECKLINE BREAKOUT
- Volume Spike at Resistance - Done ✓
- Breakout of Neckline Resistance - Done ✓
- Retracement & Consolidation - In Progress
#stocks #swingtrade #chartanalysis #traderyte
GAIL: IMPULSE UNFOLDINGStock is rising in a uptrend channel forming HH HL which is the basic definition of an Uptrend. The current price action suggests that prices are unfolding into a primary wave-3.
One should buy the stock on current levels, keeping SL of 105 look for the target of 140 in the coming days and weeks ahead.
GAIL AT ATH LEVELS GAIL @ CMP 136. Highly cyclical stock. Touched ATH 104 on 1-Jan-2008 which was breached on 1-Sept-2017 only. Made new ATH 133 on1-Aug-2018 which was breached on 1-Nov-2023. The stock with CMP 136 is sailing within an ascending channel having its probably resistance at 155. The stock has been in uptrend since last 1yr, so some correction or profit booking is more
likely at new ATH levels. May correct upto 110-115 which is good support level.
Intraday 26 April_ GAIL_ LONGIntraday Trade setup for 26 April
I have selected 4 stocks for intraday, not all the trades will get executed.
I always place Stop Loss Market Buy/Sell order above or below (for LONG and SHORT) the high/low of the reference candle to make an entry.
Entry: 130.3
SL: 128.4
Target: 134.1
Disclaimer: The analysis or trade setup is of my own. Please do your own analysis before jumping into the trade. I shall not be responsible for the profit/loss in either way.
Looking Good - Long term ViewHi All…
Greetings!
Today I’m sharing with you Gail India Ltd. Weekly Chart. I think if GAIL breaks 133 & 148 level we might see good upcoming move. The targets mentioned are Long term TGT so keep patience.
In the coming time I think it should give good returns.
Thanking You
Important Things
1. This is only for educational purposes only.
2. Never over trade.
3. Always keep Stop Loss.
4. Trade in limited quantity.
5. Taking a small loss is better than wiping up your whole capital.
I hope you found this idea helpful.
Please like and comment.
Share with Your Friends.
Keep Learning,
Happy & Safe Trading
Disclaimer – These ideas shared by me to all are my personal analysis / views. Im not a SEBI registered technical analyst.
Ready to blast!Chart -> GAIL Weekly
Looks like everything is cooked and ready to blast.
In daily and weekly both charts show symmetrical triangle breakout.
CMP: 111
Target: 121, 130
SL: 102 weekly close
Above 130 new and crazy targets will be there.
Disclaimer: This is for educational purposes only, not any recommendations to buy or sell. As I am not SEBI registered, please consult your financial advisor before taking any action.


