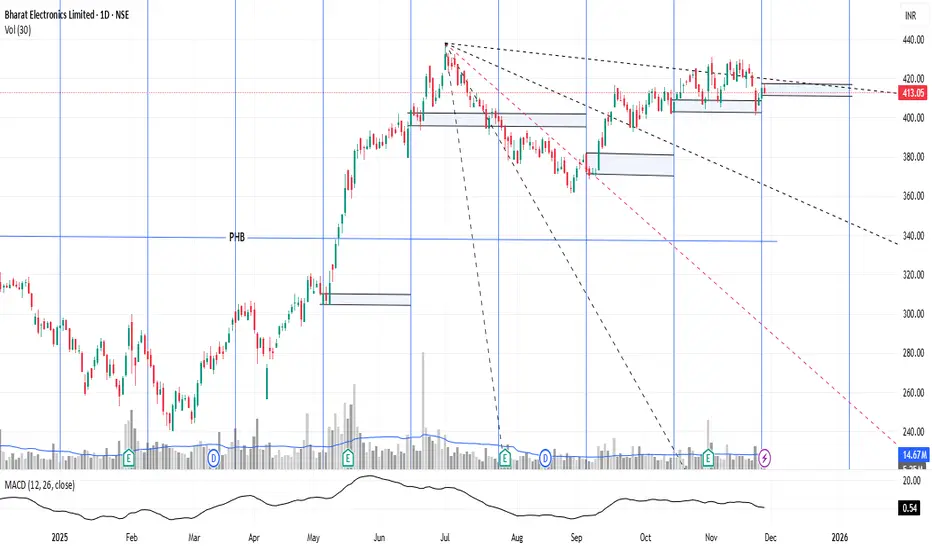
Bharat Electronics Ltd. (BEL)If you understand the time cycles of a particular stock, you can easily create your position on the chart by observing its nature and behavior. This is probably a very good way to manage your investments.
Time Cycle is a routine that allows you to map the movement of a stock by measuring the high and low levels of the stock on a day or period. However, it does not prove whether a reversal will occur in the next time cycle; it is only a probability. But it makes you profitable 80% of the time.
Regardless of the outcome, the candle formed on the day of the time cycle carries significant significance. The market respects this candle, whether it goes up or down, which is very important. Time Cycle often stops short near the candle. You will notice on the chart that it often looks like a support or resistance area.
Time Cycle candles also tell you about continuation or reversal, but you have to forgive the high and low of the candle formed in the time cycle.
You do not have to make any decisions yourself. This is its specialty.
Gann
L&T Finance Ltd.(LTF)If you understand the time cycles of a particular stock, you can easily create your position on the chart by observing its nature and behavior. This is probably a very good way to manage your investments.
Time Cycle is a routine that allows you to map the movement of a stock by measuring the high and low levels of the stock on a day or period. However, it does not prove whether a reversal will occur in the next time cycle; it is only a probability. But it makes you profitable 80% of the time.
Regardless of the outcome, the candle formed on the day of the time cycle carries significant significance. The market respects this candle, whether it goes up or down, which is very important. Time Cycle often stops short near the candle. You will notice on the chart that it often looks like a support or resistance area.
Time Cycle candles also tell you about continuation or reversal, but you have to forgive the high and low of the candle formed in the time cycle.
You do not have to make any decisions yourself. This is its specialty.

Fortis Healthcare Ltd. (FORTIS)If you understand the time cycles of a particular stock, you can easily create your position on the chart by observing its nature and behavior. This is probably a very good way to manage your investments.
Time Cycle is a routine that allows you to map the movement of a stock by measuring the high and low levels of the stock on a day or period. However, it does not prove whether a reversal will occur in the next time cycle; it is only a probability. But it makes you profitable 80% of the time.
Regardless of the outcome, the candle formed on the day of the time cycle carries significant significance. The market respects this candle, whether it goes up or down, which is very important. Time Cycle often stops short near the candle. You will notice on the chart that it often looks like a support or resistance area.
Time Cycle candles also tell you about continuation or reversal, but you have to forgive the high and low of the candle formed in the time cycle.
You do not have to make any decisions yourself. This is its specialty.

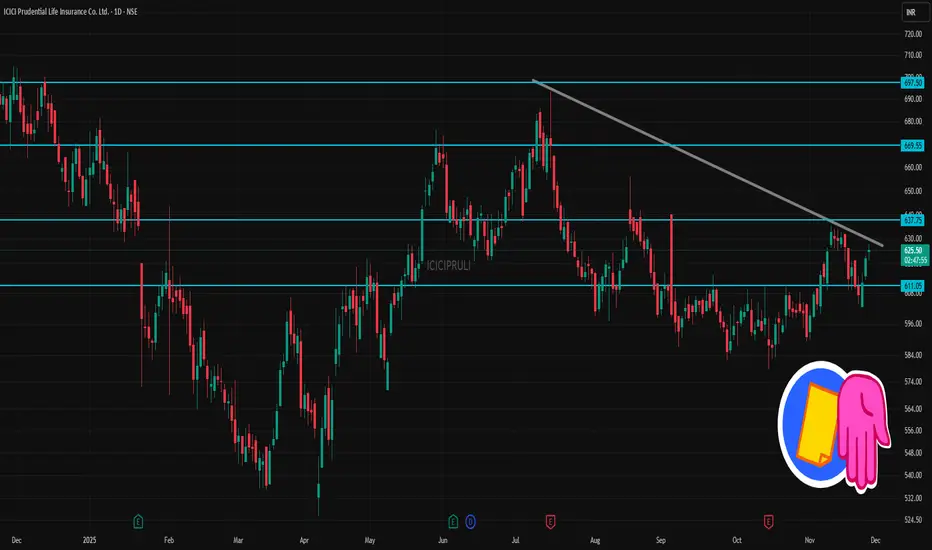
ICICIPRULI 1 Day Time Frame 📌 Latest Price & Context
Recent traded price: ~ ₹ 625–626.
52‑week range: Low ~ ₹525.80 — High ~ ₹704.70.
📈 What It Suggests (For 1‑Day / Short‑Term View)
As long as price remains above ~₹ 623–625, there is a short‑term bullish bias — next target could be ~₹ 630–635.
Dip toward ~₹ 615–620 could offer a buy‑on‑dip type entry (for traders), if volume and overall market sentiment stay supportive.
If price breaks below ~₹ 605–600, it may head toward the lower support zone — then caution/adapt strategy.
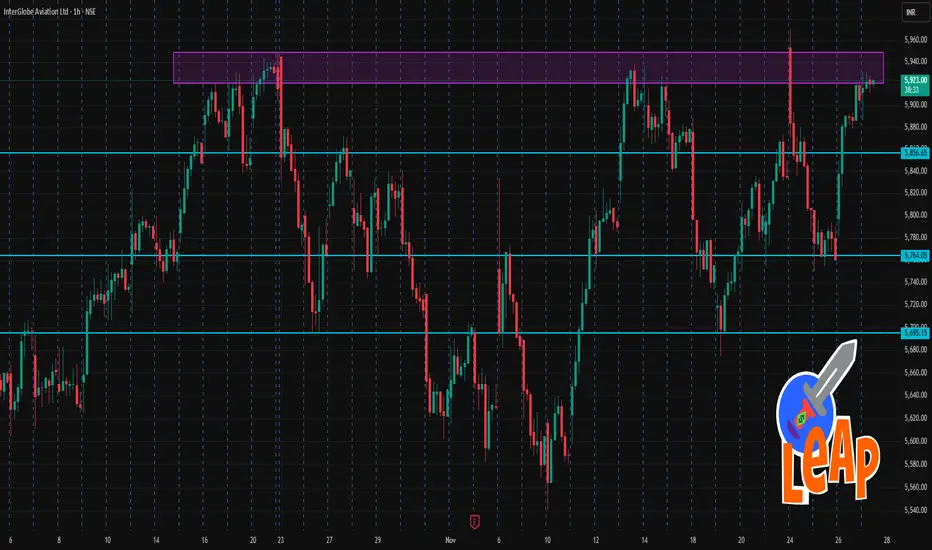
INDIGO 1 Hour Time Frame ✅ Current Price & Broad Trend
1. Latest publicly quoted price: around ₹5,916–₹5,923.
2. On a daily/mid‑term view, most technical indicators remain bullish: moving averages (50‑day, 200‑day) are supportive, and technical‑rating screens (on several platforms) show a “Strong Buy”.
📌 What it means on 1‑hour chart / near term
As long as price stays above the pivot (~₹5,872), the near‑term bias remains slightly bullish / range‑to‑upside.
A dip toward ~₹5,870–₹5,820 could act as a buyable support, while the ~₹5,730–₹5,820 zone is more “secondary buffer.”
On upside — a clear break above ~₹6,015–₹6,020 could target ₹6,100–₹6,200+ (near 52‑week high zone).
If price falls below ~₹5,820 decisively, then the risk increases of a deeper pullback toward ~₹5,730 or lower — but that’s a deeper intraday/swing‑trade scenario, not a baseline expectation.
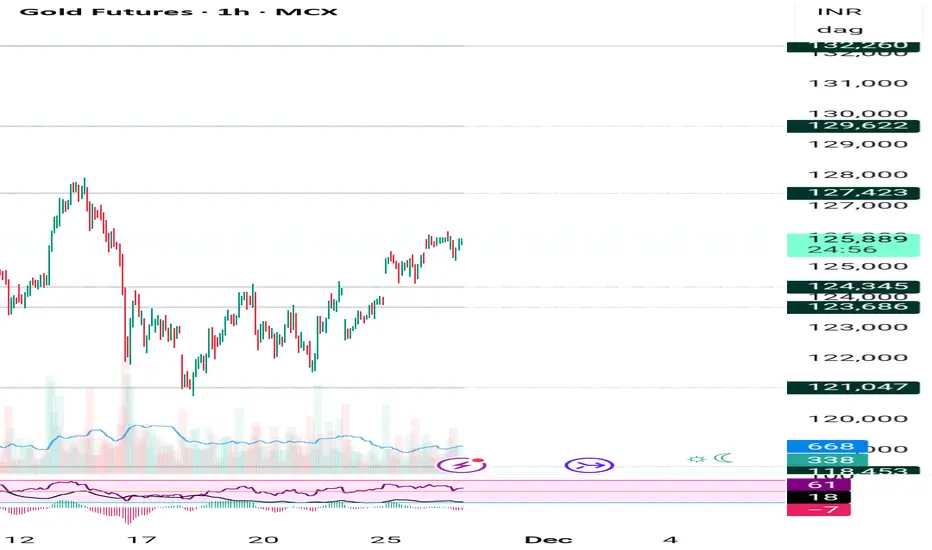
Gold mcx today booked 600 points weekly 4000 points ,buy on dipParameters Data
Asset Name Gold MCX
Reason 🟩 Global Fed cut expectations, strong YTD performance, aur ₹1,25,800 ka resistance breakout.
R:R 🟩 1:1.50 (Favorable for T2/T3 targets. High momentum trading required.) / Threshold: Breakout above - & Breakdown below
Current Trade 🟩 BUY Active ⬆️ Target T1 - 126500.00 , T2 - 127200.00 , T3 - 128000.00 , Stop loss - 125000.00
Probability 🟩 85%
Confidence 🟩 25/30 (Resistance breakout aur strong fundamental backing.)
Price Movement Buy side: 126500.00, 127200.00, 128000.00. If break 125000.00 then downside possible towards 124500.00, 124000.00, 123500.00.
FNO Data (OI/PCR) 🟩 Fresh long positions add ho rahi hain (Long Buildup).
Liquidity Zones 🟩 Liquidity ₹1,25,500 par strong support de rahi hai.
Max Pain 🟨 N/A
Gamma Exposure 🟩 Gamma spike ho raha hai, jo acceleration ka signal hai.
Supports 🟩 S1: 125220.00 (Immediate Pivot) | S2: 125000.00 (Psychological) | S3: 124500.00 (Minor Technical)
Resistances 🟥 R1: 126500.00 (Next Key Supply Zone) | R2: 127200.00 | R3: 128000.00
DEMA Levels 🟩 Price 20/50/100 DEMA se substantially upar hai.
ADX/RSI/DMI 🟩 RSI (14) \sim 78.00 (Highly Overbought, par momentum extremely strong).
Cross‑Asset Correlation 🟩 Global Gold COMEX mein bhi tezi hai.
Sentiment Index 🟩 Extreme Greed Zone (High institutional interest).
Source Ledger 🟩 MCX, TradingView (Image Data), CME Group, Bloomberg (Verified & Triangulated).
Silver today booked 3400 points profit,buy given yesterday alsoSilver today booked 3400 points profin on 2 traded , continuesly buying recommended from Friday evening.
Parameters Data
Asset Name Silver MCX
Reason 🟩 Global rate cut hopes aur strong technical momentum ke chalte aggressive buying.
R:R 🟩 R:R ratio is favourable for a target near R2. / Threshold: Breakout above - & Breakdown below
Current Trade 🟩 BUY Active ⬆️ Target T1 - 161800.00 , T2 - 163200.00 , T3 - 165000.00 , Stop loss - 158500.00
Probability 🟩 75% (Global tailwinds aur strong breakout ke aadhar par.)
Confidence 🟩 20/30 (Dominant bullish signals from multiple indicators.)
Price Movement Buy side: 161800.00, 163200.00, 165000.00. If break 158500.00 then downside possible towards 157500.00, 156000.00, 155000.00.
FNO Data (OI/PCR) 🟩 OI Buildup: Long Buildup (Heavy volume and price rise). PCR: Neutral to slightly bullish trend.
Liquidity Zones 🟩 Strong demand zone (Liquidity) ₹1,59,000 - ₹1,60,000 ke aas-paas shift ho gayi hai.
Max Pain 🟨 ₹1,60,000 ke kareeb (Option sellers ₹1,60,000 par max pain chahte hain.)
Gamma Exposure 🟩 Positive Gamma shift, jo upside momentum ko support kar raha hai.
Supports 🟩 S1: 159000.00 (Previous Resistance turned Support) | S2: 157500.00 (20-Day EMA) | S3: 156000.00 (Major Pivot)
Resistances 🟥 R1: 161800.00 (Next Short-Term High) | R2: 163200.00 (Major Supply Zone) | R3: 165000.00 (Recent High/All-time High Zone)
DEMA Levels 🟩 Price 20/50/100 DEMA se kaafi upar hai, jo strong Bullish trend confirm karta hai.
ADX/RSI/DMI 🟩 RSI (14) \sim 70+ (Overbought, but Strong Buy signal) aur ADX \sim 40+ (Strong Trend).
Cross‑Asset Correlation 🟩 Gold (Comex) aur Crude Oil (Comex) ke saath positive correlation.
COT Positioning 🟩 Managed Money long positions badha rahe hain (Bullish signal).
Source Ledger 🟩 MCX, Comex, Bullions.co.in, Investing.com, Groww (Verified & Triangulated).

Bajaj Auto Ltd. (BAJAJ-AUTO)If you understand the time cycles of a particular stock, you can easily create your position on the chart by observing its nature and behavior. This is probably a very good way to manage your investments.
Time Cycle is a routine that allows you to map the movement of a stock by measuring the high and low levels of the stock on a day or period. However, it does not prove whether a reversal will occur in the next time cycle; it is only a probability. But it makes you profitable 80% of the time.
Regardless of the outcome, the candle formed on the day of the time cycle carries significant significance. The market respects this candle, whether it goes up or down, which is very important. Time Cycle often stops short near the candle. You will notice on the chart that it often looks like a support or resistance area.
Time Cycle candles also tell you about continuation or reversal, but you have to forgive the high and low of the candle formed in the time cycle.
You do not have to make any decisions yourself. This is its specialty.

Long NaturalgasNatural gas is looking good in current scenario.
If it will do breakout from 430 zone then we can see 432 and 468
1st Dec is date for 432 and 24 dec 468
This is as per my sqroot calculation from previous top formation.
For downside you must hedge the trade by buying Bullish Put spread or bullish call spread

Introduction to DivergenceShould You Trade Options?
Options are powerful tools, but they require:
Understanding of market structure
Technical or quantitative edge
Patience and discipline
Clear strategy
Risk management
If you want leverage and flexibility, options are excellent.
If you want consistency and low risk, focus on credit spreads or hedged selling.

Swing Trading Secrets1. The Secret of Trend Recognition
The biggest secret of profitable swing trading is identifying the dominant trend of the market. Most novices try to pick tops and bottoms, but professionals follow the path of least resistance. Trend recognition means:
Uptrend: Higher highs (HH) + higher lows (HL)
Downtrend: Lower highs (LH) + lower lows (LL)
Range: Price oscillates between support and resistance
Swing traders do not predict; they react. They align trades with the existing trend.
For example:
In an uptrend, they wait for pullbacks to key levels.
In a downtrend, they short the rallies.
In a range, they buy at support and sell at resistance.
Knowing the trend keeps traders on the right side of probability.
2. The Secret of Patience and Timing
Effective swing traders don’t enter randomly. They wait for specific conditions:
A. The market must be near a key level
Trendline touch
Moving average support (e.g., 20-EMA, 50-EMA)
Fibonacci retracement (38.2%, 50%, 61.8%)
Previous swing high/low
Volume clusters
B. Price must confirm the reversal or continuation
Patience allows the market to “show its hand” before entering.
The secret: wait for the candle close, not the candle forming.
Many traders lose because they enter too early. Timing matters more than direction.
3. The Secret of Multi-Timeframe Confluence
Professional swing traders use multiple timeframes:
Higher timeframe (HTF): 1-week or 1-day → Trend direction
Trading timeframe (TTF): 4-hour or 1-day → Entry zones
Lower timeframe (LTF): 1-hour or 15-min → Entry trigger refinement
This is called top-down analysis.
If the weekly chart shows an uptrend, the daily chart shows a pullback, and the 4-hour chart shows a bullish reversal pattern, the probability of success becomes extremely strong.
Multi-timeframe alignment is a powerful edge.
4. The Secret of High-Probability Patterns
Swing traders rely on chart patterns—not lots of patterns, just a handful of powerful ones that repeat reliably.
A. Continuation Patterns
Bull flag
Bear flag
Ascending triangle
Descending channel
These indicate that the trend is likely to continue.
B. Reversal Patterns
Double top / double bottom
Head and shoulders
Morning star / evening star
Hammer / shooting star
C. Breakout Patterns
Cup and handle
Range breakout
Consolidation breakout
Professional traders focus on clean patterns. If the pattern is messy, overlapping, or unclear, they move on.
5. The Secret of Volume Analysis
Price shows direction; volume shows conviction.
High-probability swing trades usually show:
High volume on breakouts
Low volume on pullbacks
High volume on reversal candles
Volume spikes at support/resistance
Volume acts like a lie detector. If a breakout happens on weak volume, it is often a trap.
Understanding volume helps traders avoid false signals.
6. The Secret of Risk Management
Most swing traders fail not because their strategy is bad but because their risk management is weak.
Professionals follow these golden rules:
Risk only 1–2% of capital per trade
Always place a stop-loss
Size positions based on volatility
Avoid overtrading
Never increase lot size after a loss
The greatest secret:
Protecting capital is more important than making profits.
A trader who avoids major losses can survive long enough to catch big winning swings.
7. The Secret of Support & Resistance Mastery
Swing traders obsess over support and resistance levels.
These levels act as price magnets and turning zones.
Key levels include:
Previous swing highs/lows
Daily, weekly, and monthly levels
Psychological numbers (100, 500, 1000)
Fibonacci retracement levels
Supply and demand zones
Swing traders wait for price reactions at these levels and only trade when confirmation appears.
8. The Secret of Using Indicators the Right Way
Professional swing traders use indicators as confirmation, not decision-making tools.
Popular indicator combinations:
A. Trend + Momentum
50-EMA or 200-EMA + RSI
20-EMA + MACD
B. Pullback Identification
Bollinger Bands
Stochastic RSI
C. Breakout Confirmation
Volume + MACD
RSI breakout
The secret:
Use indicators sparingly—2 or 3 maximum.
Clear charts produce clearer decisions.
9. The Secret of Trading Psychology
Swing trading rewards emotional control.
Professionals master:
A. Discipline
Follow the plan strictly.
B. Patience
Wait for the best setups.
C. Emotional Detachment
React to charts, not feelings.
D. Consistency
A few high-quality trades outperform dozens of random trades.
The less emotionally involved a trader is, the better they perform.
10. The Secret of Journaling Every Trade
This is one of the most underrated secrets.
A trade journal includes:
Entry and exit
Stop loss
Chart screenshots
Reason for trade
Mistakes
Market context
Journaling forces self-reflection and dramatically improves discipline and performance.
11. The Secret of Avoiding News-Based Noise
Swing traders avoid making decisions during:
Major economic announcements
Earnings reports
Policy changes
High volatility events
News can create unpredictable spikes that damage swing positions.
Professionals stay defensive during such periods.
12. The Secret of Letting Winners Run
One of the greatest swing trading secrets is knowing when not to exit early.
Successful traders:
Trail their stop-loss
Add positions in trend continuation
Hold until target zones are met
Small losses and big wins create long-term profitability.
Conclusion
Swing trading appears simple but demands mastery of multiple elements—trend recognition, timing, patience, volume interpretation, chart patterns, risk management, and psychology. The real secrets lie not in magical indicators but in disciplined execution and consistent behavior. When traders combine technical analysis with emotional control, they unlock the ability to capture market swings with confidence and accuracy.
Crypto Trading Guide1. Understanding Crypto Trading
Crypto trading involves buying and selling digital assets such as Bitcoin (BTC), Ethereum (ETH), and thousands of altcoins with the goal of earning profits. Traders analyze price movements, market sentiment, liquidity, and technical indicators to make buy or sell decisions.
Unlike stock markets, crypto exchanges are decentralized and global. This means prices can fluctuate rapidly based on fundamentals, macroeconomic factors, regulatory developments, or even social media trends. Knowing how these factors affect token value is the first step toward successful trading.
2. Types of Crypto Trading
There are several popular trading styles, each suited for different personality types and risk appetites.
a) Day Trading
Day traders enter and exit positions within a single day. They rely on short-term price movements, chart patterns, and volume spikes. This style requires high attention, quick decision-making, and consistent strategy execution.
b) Swing Trading
Swing traders hold assets for days or weeks. They aim to capture price “swings” driven by broader trends. This style offers a balance—less stress than day trading yet more opportunities than long-term investing.
c) Scalping
Scalpers make numerous small trades throughout the day, profiting from minor price differences. It demands precision, discipline, and fast execution.
d) Position Trading
Position traders take long-term positions based on macro trends, technological developments, or fundamental analysis. They are less affected by short-term volatility.
e) Automated or Algorithmic Trading
Bots execute trades automatically based on predefined rules. This reduces emotional bias and allows 24/7 trading. However, setup and strategy optimization require knowledge and testing.
3. Choosing the Right Crypto Exchange
Selecting a reliable exchange is vital for safety and smooth trading. Compare platforms based on:
Security features (2FA, cold storage, proof of reserves)
Trading fees (maker/taker charges)
Liquidity (higher liquidity ensures smoother trades)
Supported crypto pairs (BTC/USDT, ETH/USDT, etc.)
User interface and tools
Customer support quality
Global exchanges include Binance, Kraken, and Coinbase, while several regional exchanges also offer local currency support.
4. Building a Trading Plan
A trading plan acts as your roadmap. It should answer:
Which coins will you trade?
What is your entry strategy?
What is your exit strategy?
How much capital will you risk per trade?
What indicators will you use?
How will you control emotions?
A strong trading plan prevents impulsive decisions and keeps you aligned with your long-term goals.
5. Fundamental Analysis (FA)
Fundamental analysis evaluates a crypto asset’s underlying value. Unlike stocks, cryptocurrencies don't have earnings or balance sheets. Instead, traders rely on:
Project whitepaper
Technology and blockchain model
Token utility and real use cases
Team and advisors
Partnerships and community size
Supply metrics (circulating and max supply)
Roadmap progress
Market sentiment (news, social media trends)
Strong fundamentals help identify long-term winners.
6. Technical Analysis (TA)
Technical analysis uses chart data to predict price movements. Common tools include:
a) Candlestick Patterns
Doji, engulfing, hammer, shooting star—these show buying or selling strength.
b) Support and Resistance
Support acts as a floor for prices; resistance acts as a ceiling.
c) Moving Averages (MA)
Popular trends include:
50-day MA
100-day MA
200-day MA
Bullish when price stays above key MAs.
d) RSI (Relative Strength Index)
Indicates overbought (70+) or oversold (30-) conditions.
e) MACD (Moving Average Convergence Divergence)
Shows momentum and potential trend reversals.
f) Volume Analysis
A price move with strong volume is more reliable than one with low volume.
A combination of these indicators gives clearer trading signals.
7. Risk Management
Crypto’s volatility can wipe out profits quickly if risk is not controlled. Effective risk management includes:
a) Position Sizing
Never allocate your entire portfolio to one coin. Use fractional position sizes (1–5% per trade).
b) Stop-Loss Orders
Automatically exit losing trades before losses escalate.
c) Take-Profit Levels
Lock in profits instead of waiting for unsustainable peaks.
d) Avoid Over-Leveraging
Futures trading may amplify gains, but also magnifies losses. Beginners should avoid high leverage.
e) Diversification
Hold a mix of large caps (BTC, ETH), mid-caps, and small caps to balance risk.
f) Keep Emotions in Check
Fear and greed are the biggest threats. A calm, rule-based approach wins long term.
8. Psychology of Crypto Trading
Market psychology plays a major role in crypto. Traders should understand:
Fear of Missing Out (FOMO)
Chasing pumps leads to buying at peaks.
Fear, Uncertainty, and Doubt (FUD)
Negative news often triggers panic selling—even when fundamentals remain strong.
Overconfidence
Winning streaks can cause reckless decisions. Stick to your plan.
Patience and Discipline
Waiting for perfect setups is key. Avoid forcing trades.
A successful trader masters both the charts and their mindset.
9. Common Crypto Trading Mistakes
Avoid the pitfalls that trap many beginners:
Trading without a plan
Using high leverage early
Investing money you cannot afford to lose
Blindly following social media influencers
Ignoring security practices
Overtrading
Not keeping trading journals
Holding losing positions out of hope
Learn from mistakes and review trades regularly.
10. Securing Your Crypto
Security should always be a top priority. Follow best practices:
Use hardware wallets for long-term storage
Enable 2FA authentication
Keep strong, unique passwords
Avoid trading on public Wi-Fi
Beware of phishing and fake websites
Backup seed phrases offline
A secure setup ensures your profits remain yours.
Conclusion
Crypto trading offers enormous potential, but success depends on knowledge, discipline, and strategic execution. By understanding trading styles, applying both fundamental and technical analysis, managing risk effectively, and controlling emotions, you can navigate the volatility of crypto markets with confidence. The key is to start slow, stay consistent, and treat trading as a long-term skill-building journey. With the right approach, crypto trading becomes not just profitable but also an enriching experience in the rapidly evolving world of digital finance.

Part 1 Support and Resistance What Are Options?
Options are derivative contracts, which means their value is derived from an underlying asset such as stocks, indices, commodities, or currencies. In India, the most traded options revolve around:
Nifty 50
Bank Nifty
FinNifty
Stocks in the F&O list
An option contract gives a trader a right but not an obligation. This is what separates option buyers from option sellers.

ENRIN 1 Day Time Frame 🔍 Key Price Info
Last traded ~ ₹3,090 (as of ~10:44 AM IST) on 25 Nov 2025.
Day’s high-low range: ~ ₹3,090 – ₹3,303 (intraday high reported ~₹3,303).
52-week range: ~ ₹2,508.80 – ₹3,625.00.
🎯 Support & Resistance Levels (Short Term)
Support Levels:
~ ₹3,050 – ₹3,070: close to current price, would be first level of support.
~ ₹3,000 – ₹3,030: if the stock breaks below the above, this zone becomes important.
~ ₹2,950 – ₹2,990: deeper support and closer to lower end of recent consolidation.
Resistance Levels:
~ ₹3,250 – ₹3,300: recent high zone around ₹3,303, so getting above this would be bullish.
~ ₹3,350 – ₹3,400: next significant zone before approaching the 52-week high.
~ ₹3,600+: near the 52-week high (₹3,625) and a major resistance barrier.
📉 Intraday Trading View
If the stock holds above ~₹3,050-₹3,070 with strong volume, it could attempt a push toward the resistance zone of ~₹3,250-₹3,300.
If it loses support at ~₹3,050, watch for potential slide toward ~₹3,000 or lower ~₹2,950 zone.
Volume, market sentiment & any corporate news will greatly influence whether it can break resistance or find support.

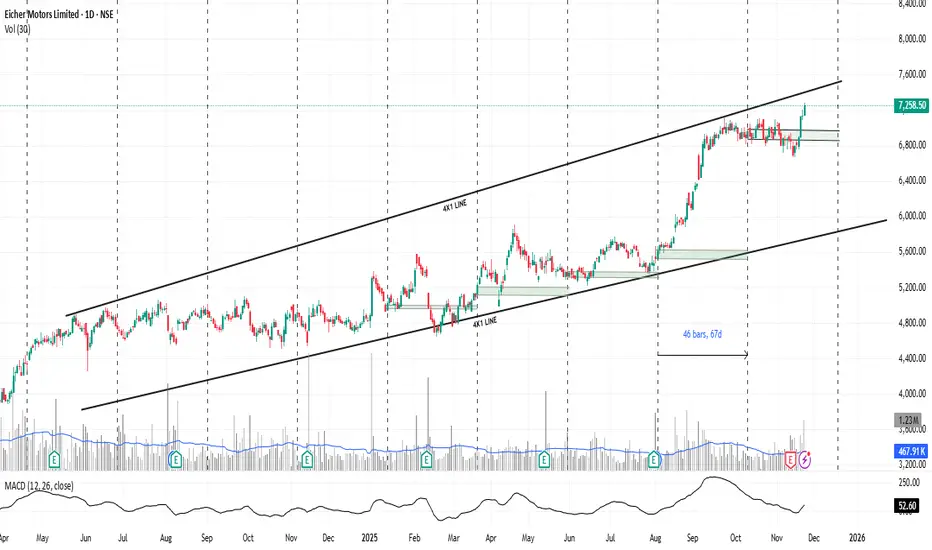
Stop pick is more important before using time cycle(EICHERMOT)I am not saying that you should leave everything to the time cycle. You don't have to look at anything. Just look at the candles of the time cycle and trade.
No, no, it is not like that at all. You should keep doing your research because if you do research, look at the fundamentals, read the results, then you will also understand that this cycle will be good.
Take the time cycle and do it in any chart. Before taking the cycle, definitely check the fundamentals of the stock. Time cycle alone cannot help you completely if your stock is not good.
Working on the time cycle of any stock can be very dangerous, if you don't find good stocks it is dangerous for you. Keep this in mind.
Here are the financial results for Eicher Motors Ltd (Royal Enfield + VECV) for the most recent three quarters as of November 24, 2025:
Strong growth momentum: Q2 FY26 was the best quarter in recent times with revenue jumping ~22% quarter-on-quarter and PAT growing 25% year-on-year.
Margin improvement: EBITDA margin expanded to 24.5% in Q2 FY26 (highest in the last few quarters) due to better operating leverage, cost control, and higher contribution from premium Royal Enfield models.
Driven by Royal Enfield: Continued strong demand for 350cc+ motorcycles and new launches (e.g., Himalayan 450, updated Classic 350, etc.) boosted volumes and realizations.
Overall, Eicher Motors has delivered consistently strong performance over the last three quarters, with accelerating growth in the most recent quarter (Sep 2025).
This is a daily chart of Multi Commodity Exchange of India Limit
This is a daily chart of Multi Commodity Exchange of India Limited (MCX) on NSE, as of November 24, 2025.
The stock has shown a clear multi-phase uptrend over the past ~2 years, and the chart is annotated with five key stages that appear to follow a classic Elliott Wave / structural trend progression:
Wave 1 / Initial Impulse (left side)
Strong rally from ~₹1,800–2,000 zone to ~₹4,800 (+140–150%), accompanied by high volume.
Wave 2 / Deep Correction
Sharp pullback of ~37.58% over 66 bars, retracing most of Wave 1 but holding above the prior low. Typical deep Wave 2 behavior (often 50–61.8% retracement).
Wave 3 / Strongest Impulse (current completed phase)
Powerful extended rally from the Wave 2 low at ~₹3,000 to ~₹9,745–9,900 zone.
Gain: +220% in just 66 bars
Classic Wave 3 characteristics: strongest volume, steepest slope, often 1.618× or more of Wave 1
This move has already exceeded the 1.618 extension target of Wave 1.
Wave 4 / Ongoing Consolidation
Currently in a sideways-to-slightly lower correction after the explosive Wave 3.
So far it looks like a running flat or triangle, holding above the Wave 3 top (~₹8,200–8,500 zone).
Volume has dried up significantly — typical for Wave 4.
Expected Wave 5 (future)
The chart projects the final impulse leg higher, with common targets around:
₹11,000–11,500 (conservative, Wave 5 = Wave 1)
₹12,000–13,000+ (if extended, Wave 5 = 0.618 × Wave 1–3 distance)
The 59.36% and 82.27% projections shown on the chart align with typical Fibonacci targets for the end of a five-wave sequence.
Supporting indicators:
100 EMA (green line) acting as dynamic support throughout the entire uptrend.
MACD still above zero and not showing major bearish divergence yet.
Volume profile confirms highest volume nodes around current price (~₹8,500–9,500), suggesting strong institutional interest.
Current technical outlook (as of Nov 24, 2025):
MCX is in Wave 4 consolidation. As long as it holds above ~₹8,000–8,200 (previous Wave 3 top and 100 EMA zone), the bullish five-wave structure remains intact and the next leg higher (Wave 5) toward ₹11,000–13,000+ is the high-probability scenario in the coming months.
A decisive break and close below ₹8,000 would invalidate the bullish wave count and open the door to a deeper correction.

ULTRACEMCO 1 Week Time Frame ✅ Current picture
1. The stock is trading around ₹11,650-11,700 in the NSE market.
2. Weekly indicators show caution: moving averages (20, 50, 100) are above the current price, signalling short‐term weakness.
3. According to weekly pivot‐levels from Moneycontrol:
Resistance around ₹11,865 – ₹12,115 (Classic)
Support around ₹11,501 – ₹11,365
4. Another source gives near-term support ~ ₹11,684 / ₹11,639 / ₹11,587, pivot ~ ₹11,736, resistance ~ ₹11,781 / ₹11,833.
5. Technically the sentiment is “Sell” on short‐term/higher timeframes: e.g., all major moving averages show “Sell” in investing.com.
6. Weekly MACD and RSI are showing mild bearish or neutral signals.
⚠️ Key caveats
These are purely technical levels for the very short term (≈ 1 week) and assume no major news/shock.
Market, sector (cement) and macro conditions (costs, demand) can sharply change the picture.
Strongest moving averages (100/200) are still significantly higher, signalling a broader weakness in trend.

Why Candlestick Patterns Matter in Trading🔸 Types of Candlestick Patterns
Candlestick patterns can be broadly classified into:
A. Single-Candle Patterns
Hammer
Hanging Man
Inverted Hammer
Shooting Star
Doji
Spinning Top
Marubozu
B. Double-Candle Patterns
Bullish Engulfing
Bearish Engulfing
Piercing Pattern
Dark Cloud Cover
Tweezer Top
Tweezer Bottom
Harami
Harami Cross
C. Triple-Candle Patterns
Morning Star
Evening Star
Three White Soldiers
Three Black Crows
Three Inside Up
Three Inside Down

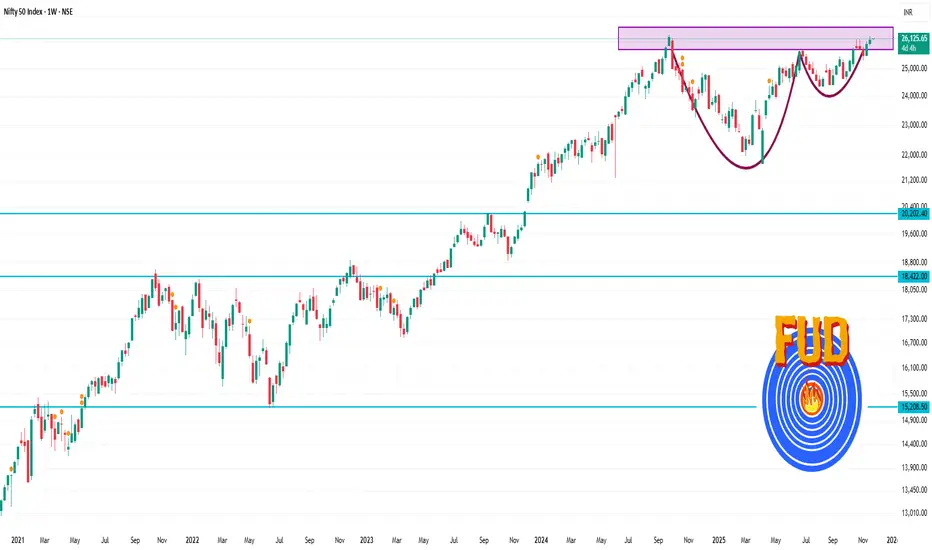
Nifty 50 1 Week Time Frame - Approximate value: ≈ 26,129.4 as of today.
- Weekly technical pivot support/resistance:
Weekly Bollinger Band top: ~ 26,166.78
Weekly Bollinger Band bottom: ~ 24,099.21
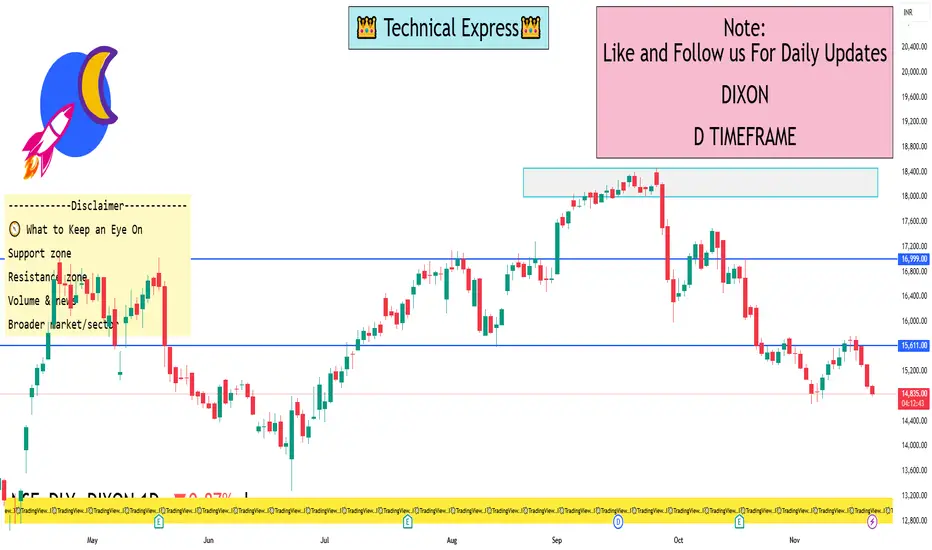
DIXON 1 Day Time Frame 🔍 Price & Pivot Levels to Watch
1. Latest live price: ~ ₹14,825 (as of intraday in India) from Groww.
2. Pivot levels (classic) for the day (based on Moneycontrol data):
Pivot ~ ₹15,065
S1 ~ ₹14,820
R1 ~ ₹15,209
3. Key moving-average resistances:
50-day SMA ~ ₹15,578 (price is below)
200-day SMA ~ ~₹15,738 – ~₹15,789 range (price is well below).
🧭 What to Keep an Eye On
Support zone: Near the S1 pivot (~₹14,820) and possibly the intra-day low zone (~₹14,700-14,800)
Resistance zone: The pivot (~₹15,065) and then R1 (~₹15,209) and the nearby moving averages (~₹15,500-15,600)
Volume & news: A sharp uptick in volume or a positive corporate/catalyst event could change the short-term dynamic.
Broader market/sector: Since Dixon is in electronics manufacturing, macro sentiment, export incentives, and input cost changes matter.
Gold plan B clean breakdown below the minor consolidation area signals a TVC:GOLD continuation toward the liquidity pocket near 4000–3985, which aligns with the next demand block.

Gold buy setupThe structure indicates that sellers are losing momentum while buyers are building pressure from the demand zone.
entered @4063 placing SL below the deepest liquidity grab
Trailing till 4092
TVC:GOLD

Cupid Ltd.(CUPID)If you understand the time cycles of a particular stock, you can easily create your position on the chart by observing its nature and behavior. This is probably a very good way to manage your investments.
Time Cycle is a routine that allows you to map the movement of a stock by measuring the high and low levels of the stock on a day or period. However, it does not prove whether a reversal will occur in the next time cycle; it is only a probability. But it makes you profitable 80% of the time.
Regardless of the outcome, the candle formed on the day of the time cycle carries significant significance. The market respects this candle, whether it goes up or down, which is very important. Time Cycle often stops short near the candle. You will notice on the chart that it often looks like a support or resistance area.
Time Cycle candles also tell you about continuation or reversal, but you have to forgive the high and low of the candle formed in the time cycle.
You do not have to make any decisions yourself. This is its specialty.
