Gannlevels
TLong
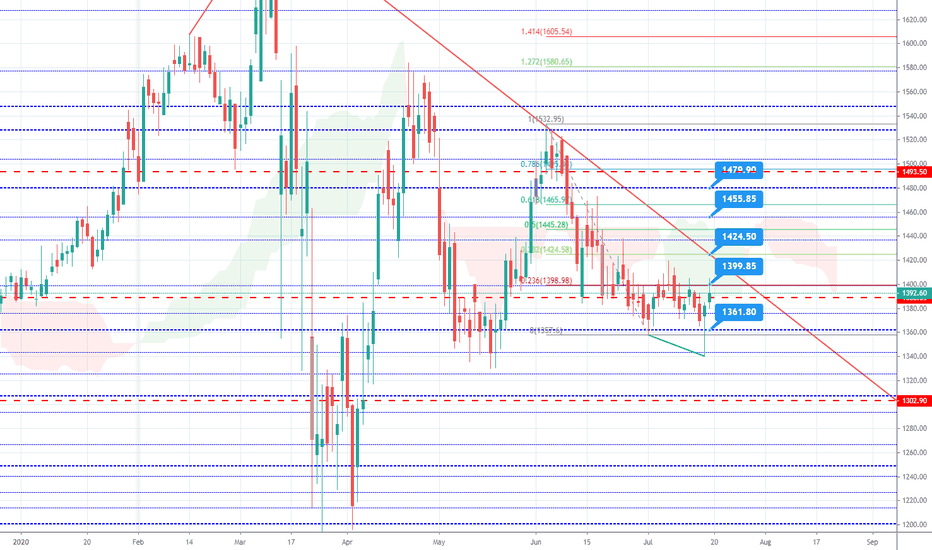
Pidilite - Stick to it - LONGProfits will stick to those who stick to Pidilite. Afterall, the company manufactures Fevicol!. The Price action has an almost perfect setup for going long - double bottom, consolidation, a nice rejection candle with a long tail. Technical indicators are positive too - RSI Bullish Divergence among other indications. The blue horizontal lines are Gann Levels - an indicator that I published and use extensively for finding S/R levels. Will go long above !400. There is a trend line resistance at 1424.5 which is also a key level for W confirmation. Targets are 1456 and 1480
Ashok Leyland - Imminent breakoutThe stock has seen a nearly 10 day consolidation and has reversed to 38.2% from the previous high. On the weekly chart, there is a nice double bottom and indicators have turned positive. Other indicators like MACD and Ichimoku are also bullish.Currently the stock is at a resistance level. Market Facilitation index is also confirming a trend reversal. Any break above Friday's high of 54.9 is a good place to go long with a target of 64 and a stop of 51
ICICI Bank - LongWe have watched the stock for sometime now and it has confirmed its intent of moving in an upward trajectory. Having broken, the stock retraced and came back to find earlier resistance as support. Also, the price is now above the Ichimoku cloud - a bullish sign... The tide seems to have changed. I will be going long above 360 with a SL of 330 and a positional tgt of 445. There are couple of intermediate hurdles at 380-385 and at 408. These could be potential targets.
NIFTY: MAD BULL !!!Mad bull or not, we are projecting higher and that is more important.
Observations
In the longer term chart it can be observed that each time we started a fresh wave after making a base, it ended at a precise Quad level. Sharp reactions can be seen near those levels. We can expect similar targets for wave 5. If that is the case, the projected target could be 15397.
Also In the current chart, the 5th wave seems quite clean compared to wave 1 and 2. There was some sort of hesitation and complexity in the wave 1 and 2 price action but clear sub-waves can be observed in wave 5. Its highly likely that we are in sub-wave "iii" of the larger 5th.
Where to expect the pullback
The length of wave 1 and 2 were approx. 4000 to 4500. We have already traveled approx. 4200 so far in wave 5 and we are double-up from the base of wave 5. It does not mean that we will reverse from here. But I have been watching 11111 to 11400 zone for a pullback.
The longer term and short term strategies
There is a high probability that we burn our fingers shorting in a bull market. The strategy should be to buy the pullbacks. At this point the markets are in highly stretched and overbought situation. In order to invest, its better to wait for a retracement rather than jumping at higher levels and suffer drawdowns. For short term trades, its better to buy the pullbacks on smaller timeframes and take quick gains off the market whenever possible.
Hope this analysis would help some traders in taking better decisions.
Do hit like and comment.
Trade safe
Bravo


