Gap-Up & Gap-Down Trading – A Complete Guide1. What Is a Price Gap?
A price gap occurs when a stock opens significantly higher or lower than its previous trading session’s close, leaving a visible blank space (gap) on the chart.
This happens when new information enters the market while the exchange is closed—earnings, news, global cues, institutional orders, or sudden sentiment shifts.
There are two main types:
Gap-Up: Today’s opening price is higher than yesterday’s high.
Gap-Down: Today’s opening price is lower than yesterday’s low.
Gaps are powerful because they show urgency and imbalance between buyers and sellers.
2. Why Do Gaps Occur?
Gaps occur due to:
Earnings announcements
News events (mergers, orders, regulatory changes)
Global market cues
Institutional buying or selling
Overnight demand–supply mismatch
Short covering or panic selling
In simple terms:
👉 When traders are willing to buy or sell at any price at the open, a gap is born.
3. Types of Gaps (Important!)
Understanding gap types is critical because not all gaps are tradable the same way.
a) Common Gap
Small gap
Low volume
Usually gets filled quickly
Not very reliable
b) Breakaway Gap ⭐
Occurs at major support/resistance
High volume
Signals start of a new trend
Best for positional & swing trading
c) Runaway (Continuation) Gap
Occurs in the middle of a strong trend
Confirms trend strength
Rarely fills quickly
d) Exhaustion Gap
Happens after a long trend
High volume but weak follow-through
Often reverses and fills
Ideal for contrarian trades
4. Gap-Up Trading Strategy
A gap-up shows bullish sentiment—but buying blindly is dangerous. The key question is:
Will the gap sustain or fade?
Common Gap-Up Behaviors
Gap and Go
Gap Fill
Partial Fill + Trend
False Gap
Strategy 1: Gap and Go (Bullish)
When it works
Gap-up above strong resistance
High pre-market volume
Strong sector support
Index is bullish
How to trade
Wait for first 5–15 minutes
Enter on break of opening range high
Stop loss below VWAP or opening low
Trail stop with higher lows
Best for
Intraday momentum traders
Strategy 2: Gap Fill (Bearish After Gap-Up)
When it works
Gap-up into resistance
Weak follow-through
Low volume after open
Negative broader market
How to trade
Short below opening range low
Target previous day’s close
Tight stop above opening high
Psychology
Early buyers get trapped → price falls → gap fills.
5. Gap-Down Trading Strategy
A gap-down reflects fear, bad news, or heavy selling pressure.
Common Gap-Down Behaviors
Gap and Crash
Dead Cat Bounce
Gap Fill Rally
Reversal Gap
Strategy 1: Gap and Go Down (Bearish)
When it works
Break below strong support
High selling volume
Weak index
No buying interest near VWAP
How to trade
Short below opening range low
Stop above VWAP
Trail with lower highs
Strategy 2: Gap Fill Buy (Bullish Reversal)
When it works
Gap-down after overreaction
Stock near long-term support
RSI oversold
Strong buying volume emerges
How to trade
Buy once price reclaims VWAP
Target gap fill (previous close)
Stop below day’s low
Used by
Professional intraday & swing traders
6. Role of Volume in Gap Trading
Volume is the truth detector.
High volume + gap → Genuine interest
Low volume + gap → Trap potential
Key volume clues:
Opening spike confirms intent
Declining volume = exhaustion
Volume expansion after pullback = continuation
Never trade gaps without volume confirmation.
7. VWAP & Opening Range (Must-Use Tools)
VWAP (Volume Weighted Average Price)
Acts as institutional fair value
Price above VWAP = bullish bias
Price below VWAP = bearish bias
Opening Range (First 15 Minutes)
Breakout = trend day
Breakdown = reversal or fill day
Most professional gap traders rely on VWAP + Opening Range, not indicators.
8. Risk Management in Gap Trading
Gap trading is fast and emotional, so risk control is mandatory.
Rules:
Risk max 1–2% per trade
Always use stop loss
Avoid trading every gap
No revenge trades after loss
Trade only clean setups
Best gap traders trade 1–2 quality gaps, not 10 random ones.
9. Common Mistakes Traders Make
❌ Buying gap-up at market open
❌ Shorting gap-down blindly
❌ Ignoring higher time-frame levels
❌ Trading without stop loss
❌ Over-leveraging
❌ Assuming all gaps will fill
Remember:
Gaps don’t move because of price—they move because of participants.
10. Who Should Trade Gaps?
Best suited for
Intraday traders
Momentum traders
Scalpers with discipline
Experienced swing traders
Not ideal for
Beginners without risk control
Emotional traders
Low-capital traders without margin planning
11. Final Thoughts
Gap-Up & Gap-Down trading is one of the most powerful price-action strategies because it reflects real market emotion—fear, greed, urgency, and surprise.
But gaps are double-edged swords:
Correct read = fast profits
Wrong read = instant losses
Success in gap trading comes from:
Context (trend, support, resistance)
Volume
VWAP
Patience
Discipline
If you respect the gap, the gap will pay you.
Gap

Infosys - Breakaway GapInfosys was trading sideways (consolidating) for several weeks between roughly ₹1,617 and ₹1,653. The "box" shows the price jumping completely over that resistance level. When a gap bypasses a major price barrier like this, it is "breaking away" from the old range to start a new trend.
This gap occurred on Friday, January 16, 2026. This was the first trading session after Infosys released its Q3 financial results (on Jan 14) and raised its revenue guidance for the year. This kind of significant, fundamental news is the classic driver of a Breakaway Gap.
Notice the very tall green bar at the bottom of the chart directly under the gap. A true Breakaway Gap is almost always accompanied by high trading volume, showing that institutional investors are buying in large quantities, which gives the move "staying power."

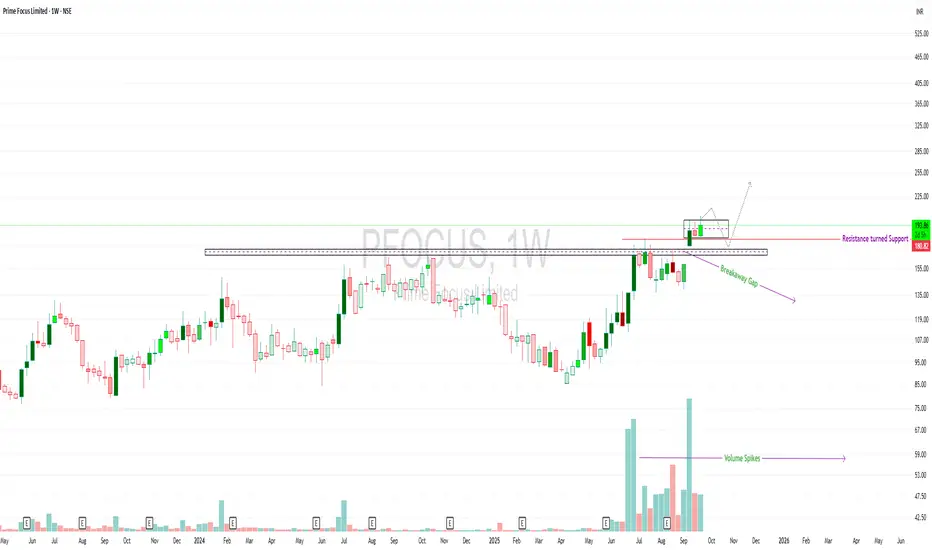
Prime Focus Ltd – Weekly Analysis
Breakaway gap seen above the resistance zone.
Strong volume confirmation supports the breakout.
Previous resistance ~₹180 has flipped into support.
Currently consolidating above the breakout zone.Retest possibility remains, but structure suggests strength as long as ₹180 holds.
🔎 Classic example of a resistance-turned-support with volume validation. Useful for those studying breakout structures.Observation only, not a trade call. Educational use.
⚠️ Disclaimer: This chart is shared purely for educational and informational purposes. It is not a buy/sell recommendation or financial advice. Please do your own research or consult a SEBI-registered advisor before making any investment decisions.
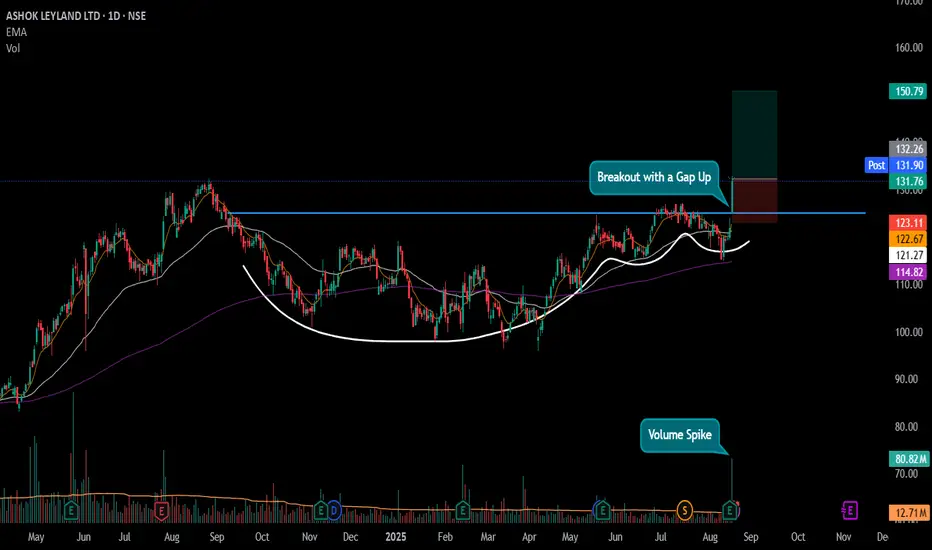
#ASHOKLEY - VCP Breakout in Daily Time Frame Script: ASHOKLEY
Key highlights: 💡⚡
📈 VCP Breakout in Daily Time Frame
📈 Price gave a Gap Up Breakout
📈 Volume spike during Breakout
📈 MACD Bounce
📈 Can go for a swing trade
BUY ONLY ABOVE 132 DCB
⏱️ C.M.P 📑💰- 131.90
🟢 Target 🎯🏆 – 14%
⚠️ Stoploss ☠️🚫 – 7%
⚠️ Important: Market conditions are Okish, Position size 50% per Trade. Protect Capital Always
⚠️ Important: Always Exit the trade before any Event.
⚠️ Important: Always maintain your Risk:Reward Ratio as 1:2, with this RR, you only need a 33% win rate to Breakeven.
✅Like and follow to never miss a new idea!✅
Disclaimer: I am not SEBI Registered Advisor. My posts are purely for training and educational purposes.
Eat🍜 Sleep😴 TradingView📈 Repeat 🔁
Happy learning with MMT. Cheers!🥂
Exhaustion vs Runaway Gap |How to Catch Trend and Spot ReversalsGaps often confuse traders — some lead to powerful trends, others signal trend exhaustion. In this video, I break down the key psychological and technical differences between Runaway Gaps and Exhaustion Gaps, with real examples and clean explanations.

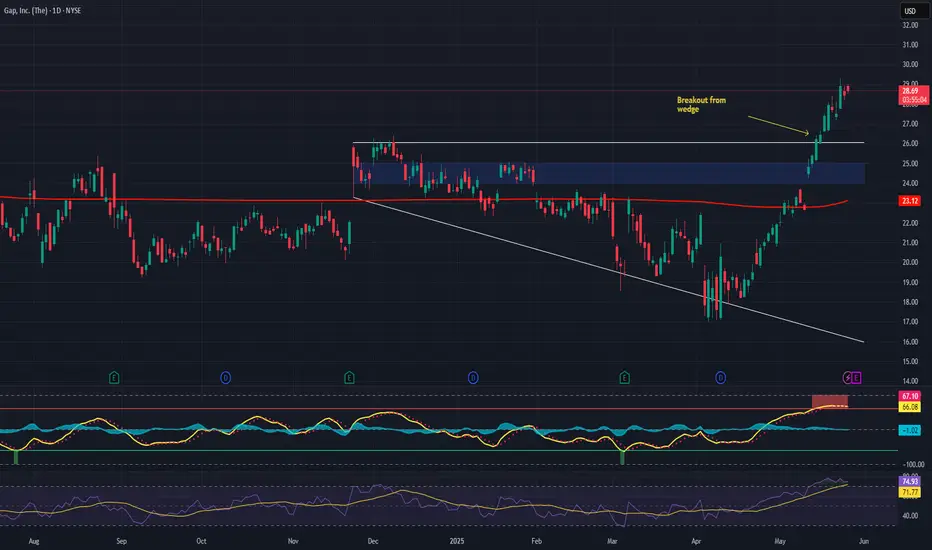
Gap, Inc. (GAP) – Reinventing Retail Through AI and InnovationCompany Snapshot:
Gap Inc. NYSE:GAP , home to Gap, Old Navy, Banana Republic, and Athleta, is entering a new era of transformation under fresh leadership with a focus on technology, AI, and operational agility.
Key Catalysts:
AI-Driven Reinvention 🤖🛍️
Launched an Office of AI to accelerate personalization, demand forecasting, and automation
Enhancing digital marketing, customer experience, and inventory precision
Supply Chain Stability 📦🌎
Less than 10% exposure to China tariffs reduces margin volatility
Emphasis on diversified, resilient sourcing
Digital Transformation Momentum 📲
Investing in e-commerce platforms and data integration across brands
Aligning fashion cycles with real-time demand via predictive analytics
Brand Strength & Consumer Reach 👚👖
Broad appeal across income segments
Old Navy and Athleta continue to gain traction with value-conscious and wellness-driven consumers
Investment Outlook:
✅ Bullish Above: $24.00–$25.00
🚀 Upside Target: $44.00–$45.00
📈 Growth Drivers: Strategic tech adoption, supply chain discipline, brand modernization
💡 Gap isn’t just making clothes—it’s tailoring the future of fashion retail with AI. #GAP #RetailTech #AIinFashion
Will Gold Surge with a Gap Up as US-China Trade War Heats Up?XAU/USD Analysis: Will Gold Surge with a Gap Up? (26/5 - 30/5)
Fundamental Outlook
US-China Trade War: China's halt on US goods imports weakens the USD, boosting gold (inverse USD correlation).
Trump’s 50% EU Tariff Threat: Potential EU retaliation could spike global uncertainty, driving investors to gold as a safe haven.
Gold Demand: Rising trade tensions and inflation fears are pushing capital into gold, especially in India and China with upcoming festivals.
Macro Drivers
Monetary Policy:
US Fed: Trade war fallout may pressure rate cuts, reducing USD appeal and supporting gold.
China’s PBOC: Possible Yuan devaluation could lift gold prices in USD terms.
Market Sentiment:
Expect VIX spikes from trade uncertainties, favoring gold.
Strong physical gold demand in Asia supports prices.
Key Events:
US PCE inflation and consumer confidence data (watch for high inflation boosting gold).
Monitor EU/China trade retaliation statements.
Technical Analysis (H4 Chart)
Trend: Gold is in a strong ascending channel with support (3,325) and resistance (3,407 - 3,444).
Current Price: 3,407.554, testing key resistance (3,407 - 3,444).
Support Levels: 3,361.648 (mid-channel), 3,325.347 (channel support).
Resistance: 3,444.436 (all-time high).
Price Action: Recent Doji candle at resistance suggests possible pullback before continuation.
Fair Value Gaps (FVG):
3,325 - 3,340
3,361 - 3,407
Scenarios:
Bullish: Break above 3,444 with momentum could trigger a gap up, targeting 3,500
Bearish: Failure at 3,444 may lead to a pullback to 3,361 or 3,325.
Gap Up Probability: 60% chance at market open (26/5), driven by bullish sentiment.
Trading Plan
Buy Strategy
Entry: 3,361 - 3,370 (pullback to FVG or mid-channel).
Take Profit: 3,444 (resistance), 3,500 (breakout target).
Stop Loss: Below 3,325 (channel support).
Sell Strategy
Entry: Sell on rejection at 3,444 with bearish confirmation (e.g., strong bearish candle or head-and-shoulders).
Take Profit: 3,361 (FVG zone).
Stop Loss: Above 3,444.
Best Trading Times
Monitor market open (26/5) for gap-up confirmation.
Trade during London/New York sessions for optimal liquidity.
Key Takeaways
Gold is poised for potential upside due to trade war escalation and USD weakness. Watch for a breakout above 3,444 for a possible gap up or a pullback to 3,361 for buying opportunities. Stay updated on US inflation data and trade policy news.

Tata Steel Potential Breakout Candidate.📈 Tata Steel - Trading Plan
🎯 Trade Setup:
🔹 Entry: ₹159 (Preferably on a daily closing basis)
🔹 Stop Loss (SL): ₹145 (Daily closing basis) (-8.81%)
🔹 Target 1: ₹184 (+15.72%)
🔹 Risk-to-Reward (R:R): 1:1.78
📊 Why This Stock?
✅ Above 50 DMA & Consolidating Above 200 DMA – Signs of strength after prolonged weakness.
✅ Gap Up & Trading Near Resistance – Potential breakout opportunity if volume supports.
✅ Metal Index Breakout – Recently broke out of a base, trading just below 200 DMA.
✅ Weekly Candles Showing Strength – Wide-range candles indicate demand.
✅ Improving RSI – Momentum gaining strength.
⚠️ Risks to Consider
❌ Overall Trend Still Bearish – Market structure remains Lower Highs, Lower Lows.
❌ Metal Index Below 200 DMA – A strong close above it adds more conviction.
❌ Volume Needs Improvement – A breakout without volume can be weak.
📌 Safe Trading Approach
🔹 Ultra Safe Traders: Wait for a weekly close above ₹159.
🔹 Confirmation Traders: Enter only after Metal Index closes above 200 DMA with volume.
🔹 Breakout Traders: Ensure a clean breakout with strong volume before entry.
📢 Disclaimer: This is not a trade recommendation. Please do your own due diligence and manage your risk accordingly. 🚀

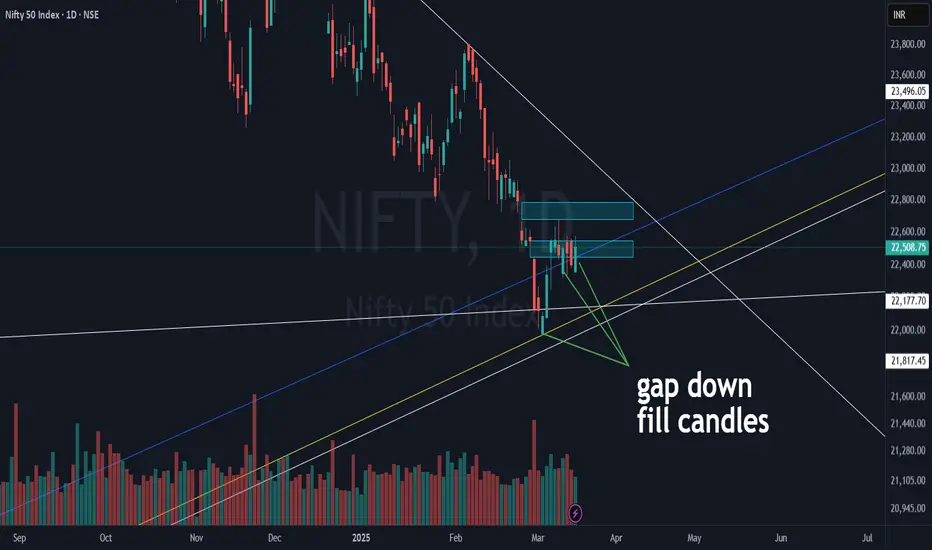
NIFTY 50 | Critical Levels & Gap-Fill Zones in Play!Nifty 50 continues to react strongly to key levels, but the overall structure still remains in correction mode. Let’s break it down:
White Lines (DTF Trendlines) ⚪:
2 key support lines and 1 counter-trendline (CT).
The DTF CT (near-term resistance) is around 500 points away from CMP, making it the next big test for bulls.
Blue & Yellow Trendlines (WTF & MTF Support) 📉:
A cluster of support created a bounce, but not as strong as past recoveries seen in 2023 or early 2024.
Despite FII selloffs & global stress, technical levels are holding up well!
Gap Zones (Blue Boxes) 📦:
The nearest gap got filled, and the next one sits just below our DTF white CT.
This could act as a magnet for price action in the near term.
Gap Down Fill Candles :
A few gaps got filled in a single session, showing bullish pressure at lower levels.
But, without a higher high - higher low structure or a DTF white CT breakout, the index stays in a corrective phase.
Swing trading idea Using the concept of Gaps and MtfaI daily make educational content videos for swing / positional trading

DCM Limited Exhibiting good Price Action. Risky proposition.
Microcap company.
Exhibiting good Pricie Action.
-Rounding Bottom.
-Darvas Box Breakout
-Breakout with Huge Volume.
-Wide Range Clean candle without any wick
-Dry volume when pulling back.
-Break Away Gap.
We talked about the positives now let's dwell on the negatives.
-Ideal entry missed.
-micro-cap company which increases the risk
One can trade it in 2 ways.
1. Wait for a retest of 113 levels. Add 30%-50% now and add the rest after retesting.
2. Wait for a breakout of 146, which is the ATH.
Keep SL low of the break-out candle.
Selecting this stock mainly for
-The volume
-Good clean candles.
-Break away Gap
I have laid out the possibility. Now it is time for you to do your due diligence. Remember this is a risky trade. Do not trade solely on tips. Enter only if you understand the Risk, the price action and the company.
Peace...

BEL Trying for a Reversal NSE:BEL is Trying to make a Reversal on the Daily Chart with today's heavy inflow as it's now gonna be part of the Nifty 50 which will attract more passive funds chasing it, although a breakaway gap is yet to be filled below the accumulation zone let's see if bulls can defend it a close above 315-317 Levels will confirm that they defended it and further upside can be seen.
Check out my other stock ideas below until this trade gets activated, I would love your feedback.
Disclaimer: This analysis is intended solely for informational and educational purposes and should not be interpreted as financial advice. It is advisable to consult a qualified financial advisor or conduct thorough research before making investment decisions.

Banknifty analysis Banknifty bounced from important swing support near 50200 after
a big fall from high of 54467 . Thereby given nearly a fall of 4000+ points
Now POC at 51350 will act as support.
on upside immediate resistance is 52370
and than golden fib level 52846 which also has gap area to fill
Expecting banknifty to move towards 52300 and than gap area.
Disclaimer : I am not SEBI registed

BTC LOST SUPPORT AND LOST 50 EMABTC lost trendline and 50 EMA support which need to fill gap at 38500 and if it lost that support next level between 33000 to 31000 level.

NIFTY BANK FILL THE GAP AREA nifty bank fill gap area next day or day. nifty bank never break our previous high without retracement

ZFSTEERING looking strongZFSTEERING after giving an episodic pivot gap with high volume is nicely respecting the gap and following tightly with respect to 21 EMA and 50 day MA. Looks like there's more gasoline left in the scrip. Stoploss should be placed ar 590-585. This is a great candidate for a swing trade.
*DISCLAIMER*
This analysis is only for educational purpose. I am not a SEBI Registered Analyst/Advisor. Please consult your financial advisor before taking any position and please use a Stop Loss for any Investments/Trading Positions. It is your hard earned money so give risk management your highest attention. Do take this disclaimer seriously.

PostMortem on BankNifty Today & Analysis of 23 JUN 2023Even in spite of the recent greenish momentum, we were all looking for a bearish breakthrough. I cannot say with 100% confidence that we are on the verge for a timely correction - but the markets are quite indicating that way.
Banknifty is again scoring over Nifty50 by staying more stable and swinging lesser. Today's episode may be linked to ADANIENT, but over the past few weeks - I think Nifty50's volatility is higher than Banknifty. Mainly because the options premium & the daily price swings per strike depends on the uncertainty of the underlying.
And if you are an option seller, nifty's options gave more bang for the buck compared to banknifty.
---
Banknifty opened slightly gap down, filled the gap immediately and then made a downswing. The LOD was 43519 at 09.35 which was recovered pretty quickly. By 10.25 BN turned positive and maintained ground.
The session from 12.45 to close made some price action which showed a sentimental level weakness - but nothing serious. In fact Nifty50 hit its LOD during the closing minutes, but not banknifty.
---
Nifty50 1hr chart shows the trade that was carried out today was below the resistance zone for 18762. Yesterday's trade was concluded right at this SR level and then today's breakdown helped the momentum to play its part.
Yesterday also we discussed the price action forming a 2 legged downward move
---
Banknifty's 1hr chart on the other hand is showing a converging price, the top keeps falling and the bottom stays steady. A falling wedge is a bullish indicator - but at present I dont see signs of outright bullishness.

BEL Paving way for INVERTED CUP & HANDLE ??!!!Chart pattern insist me the above titled opinion
Reasons
1. BEL is in formation of a Inverted Cup & Handle (Handle in progress)
2. Lower high and Lower low formed (confirming bearishness) .
3. Gap b/w 15th & 16th Day candle can act as Strong resistance.
4. Target & SL levels mentioned @ Chart.
5. BEL may take support @ Green trendline (Major Support from 2020) .
Let's wait & watch how it moves!!!
Note - Just sharing my view...not a tip nor advice!!!

KOTAKBANK in Bear's Radar ??!!!Chart patterns look impressive and paves way for the above titled opinion
REASONS
1. KOTAKBANK has been trading inside ASCENDING CHANNEL(Bright red and green trendlines) taking support and resistance at perfect levels till now.
2. Currently it is going under the down swing move inside the ascending channel .
3. In daily time frame , it looks like a Bearish Pennant in process yet to break.
4. Target & SL levels as mentioned (dashed yellow horizontal lines)@ chart.
5. It may take support @ Green line( 10year old strong support from 2014 ) (channel support) soon.
6. In addition to the above mentioned points, A GAP remains UNFILLED till now.
7. Gap often gets filled .....there is a chance for that to happen... .let's stick with our targets and trail our SL!!!
8. Better to enter after a day or at least 2 hour Breakdown out of the Yellow trendline .(as shown below)
Let's wait & watch how it moves!!!!
Note- Just Sharing my view....not a tip nor advice!!!!

indigoindigo
bearish gartley on weekly chart ,
on daily chart running between range in channel which act as flag and pole with runway gap (mean 1:1 target )
sell indigo below 1848 add more 1920 if get only
closing sl 1945 above
target 1720-1680-1515(close below weekly 200 ema @1679 )

SBILIFE Double top Breakdown ??!!!Chart pattern look interesting for a short trade
Reasons
1. SBILIFE travelling in a Descending channel pattern ( hourly time frame)
2. Now, it has formed a DOUBLETOP pattern (with a perfect High & Lower High as the two tops )
3. Lower low too formed on Friday, increasing our probability and thus Breakdown!!!
4. SL & Target levels mentioned @ chart as horizontal dashed lines(red & green)
5. 2 hr candle escaping out of the channel(yellow) can be less risky SL.
6. On 15th Feb(wed), Sbilife formed a Superb Bullish Engulfing day candle, but couldnot sustain. ... showing the BEARS STRENGTH!!!!
7. 1113(1st target) level small gap remains unfilled!!!
Let's wait and watch how it moves!!!!
NOTE- Just sharing my view......not a tip nor advice!!!!

ZeelNSE:ZEEL1!
Running news of merger with sony .chart have breakaway gaps with highest volume with previous weekly trendline and triangle breakout.
now again forming triangle on weekly trendline support area ,breakaway gap area with bullish butterfly, also having support of monthly inside candlestick low, and divergence on daily chart
Buy Zeel above 226.4 add more 218.80 with two days candle closing stop loss of below 200 target will 236.9-247-274-287++(short term )
mid term buy Zeel @ 226-216 two days closing stop loss below 200 target 287- 364-412
long term buy Zeel @ 226-216 weekly closing sl below 199 target 364-562
BOLO JAI GAJANAND

Valentines special trade | Swing trading idea with full logic I daily make educational content videos for swing trading ideas
