Dhani Price Action## Current Price & Trend
- The latest trading price is approximately ₹65, significantly below its 52-week high near ₹110 and well above its 52-week low of about ₹47.
- The stock has seen a meaningful recovery off its lows, gaining over 40% from the bottom, but remains down nearly 40% from its recent peak.
- In the last month, momentum has turned negative with a price decline of more than 7%, and the past week also shows a small drop.
- Over a three-month window, there was a modest gain, but performance over the past six months remains negative with a double-digit decline.
## Financial Performance & Valuation
- The company recently returned to modest profitability after a streak of quarters with losses, posting small but consecutive net profits in recent reports.
- Revenue rebounded in the latest quarter after earlier declines, showing signs of business recovery.
- Key valuation indicators remain weak: the price-to-earnings ratio is currently negative, reflecting cumulative prior losses, and price-to-book is around 1.4, a typical range for this peer group.
- Market capitalization is about ₹4,000 crore, which gives the stock a mid-tier standing within the financial sector.
- Return on equity remains negative, highlighting continued pressure on core profitability.
## Ownership & Sentiment
- Promoter shareholding has been steady, and there was a recent increase in foreign institutional investor interest, while retail participation declined slightly.
- Market sentiment appears tentative, with recent trading volume and price moves reflecting cautious investor attitudes.
## Strengths & Risks
- The return to profitability in recent quarters is a promising sign, especially as revenues are stabilizing.
- However, the company’s long-term performance record has been mixed, with prior years marked by substantial losses and depressed cash flows.
- The current valuation in relation to earnings and book value suggests the market is waiting for clearer signs of sustainable growth.
- The share price remains highly sensitive to quarterly results and shifts in sector confidence.
## Outlook
- The medium-term trend is neutral to mildly negative, with no immediate catalysts for a breakout.
- Upside potential exists if the company can deliver consistent profits and further revenue growth.
- Investors should monitor for continued turnaround in earnings, while being alert to the possibility of renewed volatility given the stock’s historical swings.
Gartley

LUXIND Price Analysis## Current Price & Recent Performance
- The latest share price is around ₹1,468.
- Over the past year, the stock is down nearly 25%, showing underperformance.
- In the last five years, returns are positive but modest, with periods of pronounced volatility.
- The 52-week range spans from a low near ₹1,211 to a high close to ₹2,493, highlighting large swings in price.
- Short-term momentum remains soft, with one-month and three-month returns relatively flat.
## Valuation & Financial Metrics
- LUXIND is currently valued at a price-to-earnings ratio close to 27, which is above broader market averages but not extreme for its sector.
- The price-to-book ratio sits at about 2.5, marking a premium to historical levels for textile manufacturers.
- Debt is low, and the latest dividend yield is minimal, suggesting the company retains most profits for growth.
- Price-to-sales and enterprise value-to-EBITDA ratios point to average to modestly expensive relative valuation.
- Discounted cash flow analysis and fair value models indicate the stock is somewhat overvalued at current prices.
## Growth, Profitability & Fundamentals
- Revenue growth has averaged approximately 10% annually in recent years with some acceleration recently observed.
- Earnings trends have been inconsistent, with a decline over the past five years but a robust rebound in the latest reporting periods.
- Net profit margins remain steady, roughly 6%, and operating expense control is demonstrated by low interest and employee cost ratios.
- Return on equity is below 10%, which is modest and signals room for efficiency improvement.
## Market Sentiment & Analyst View
- Most short- and medium-term forecasts suggest neutral to mildly positive technical momentum, with occasional buy signals from technical models.
- Longer-term analyst price targets vary, but consensus expects limited upside in the near future given current valuation levels.
- Projected earnings per share and revenue growth remain solid, with the company expected to improve performance metrics over the next few years.
- Intrinsic value estimates based on fundamental analysis suggest the stock trades above its calculated fair value, raising some caution for new investors.
## Key Takeaways
- LUXIND stands out for disciplined cost management and stable margins, but faces pressure from subdued industry growth and relatively high valuation metrics.
- While the business remains fundamentally sound and growth is projected to continue, the stock may be fully priced at current levels.
- Short-term price action could stay range-bound unless there is a significant change in sector sentiment or a positive surprise in earnings.
- Investors may consider waiting for a more attractive entry point if focusing on value, while growth-oriented investors might monitor for signals of a sustained earnings recovery.
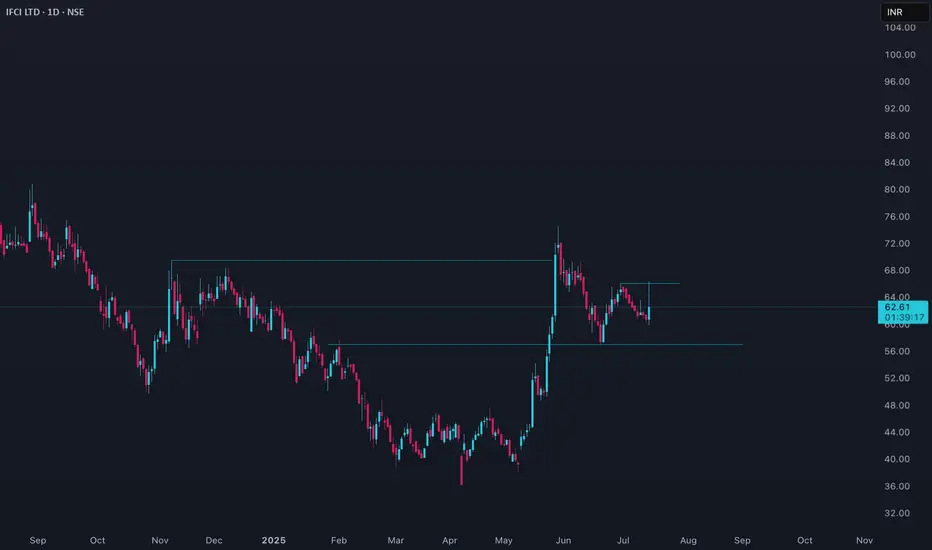
IFCI Price Action## Trend Overview
IFCI has shown significant volatility in recent months. After a strong rally earlier in the year, the stock has entered a corrective phase, with the price currently hovering around ₹60.58–₹64.50 as of July 14, 2025. The broader trend over the past year has been negative, but the last quarter displayed a sharp upward move, followed by some consolidation and profit booking.
## Price Action & Momentum
- **Short-Term:** The stock is consolidating after a steep rise in the last three months, where it gained nearly 49%. The recent pullback reflects profit-taking and market caution.
- **Medium-Term:** Despite the recent correction, the price remains above major moving averages, indicating that the medium-term uptrend is still intact.
- **Long-Term:** IFCI is down about 12% over the past year, but up over 534% in three years, highlighting its high volatility and cyclical nature.
## Technical Indicators
- **Moving Averages:** The daily price is above its 50-day and 200-day moving averages, supporting a positive medium-term outlook. Shorter-term averages are converging, suggesting a pause or consolidation.
- **Relative Strength Index (RSI):** The RSI is in the overbought zone, indicating potential for further cooling or sideways movement before the next trend emerges.
- **MACD:** The MACD indicator is positive, but momentum has slowed, suggesting the rally may be losing steam.
- **Volatility:** The stock displays high volatility, with a beta above 2, indicating larger swings compared to the broader market.
## Support and Resistance
- **Immediate Support:** Around ₹60, where recent buying interest has emerged.
- **Major Support:** Near ₹55, which aligns with the 50-day moving average and a previous breakout zone.
- **Immediate Resistance:** Near ₹65, which coincides with recent swing highs.
- **Major Resistance:** The 52-week high at ₹91.40.
## Volume and Sentiment
- Recent sessions have seen increased volume on down days, reflecting profit booking and cautious sentiment.
- Long-term sentiment remains speculative, with traders reacting quickly to momentum shifts and news.
## Summary
IFCI remains a high-beta, volatile stock with a history of sharp rallies and deep corrections. The current daily chart shows consolidation after a strong uptrend, with the price holding above key supports. As long as the stock remains above its 50-day moving average, the medium-term bullish structure is intact. However, the overbought technical indicators and recent profit-taking suggest that short-term movements may remain range-bound or slightly negative until a clear breakout or breakdown occurs. Risk management is crucial given the elevated volatility.
NDRAUTO Price Action#### Current Price and Performance
- **NDR Auto Components** is trading near ₹1,050–₹1,100 as of July 9, 2025, after a recent pullback from its all-time high of ₹1,191 set earlier in the month.
- The stock has delivered an exceptional one-year return of over 135%, with a three-month gain of more than 70%.
- Recent price action shows high volatility, with swings of 7–11% on certain days and a short-term correction of about 8% in the past week.
- Over the past month, the stock is down about 2–3%, reflecting some profit booking after a rapid rally.
#### Trend and Technical Overview
- The medium-term trend remains positive, supported by robust earnings growth and strong momentum.
- Technical indicators suggest the stock is consolidating after reaching overbought levels, with support seen near ₹1,000 and resistance around ₹1,150.
- The stock’s volatility is elevated, and its beta is above 2, indicating higher sensitivity to market movements.
#### Valuation and Financial Metrics
- NDRAUTO trades at a premium, with a price-to-book ratio above 8 and a price-to-earnings multiple reflecting high growth expectations.
- The company’s market capitalization is approximately ₹2,500 crore.
- Return on equity (ROE) is strong, around 19–23%, and return on capital employed (ROCE) is above 20%.
- Net profit for FY25 rose nearly 38% year-on-year to over ₹53 crore, with revenue up 18% to about ₹713 crore.
- Operating margins have improved to nearly 11%, and earnings per share (EPS) for the year is above ₹22.
- The dividend yield is modest at 0.26%, with a payout ratio around 12%.
#### Market Sentiment and Outlook
- Market sentiment remains positive, with the company consistently reporting record profits and sales.
- Analysts highlight the company’s efficient operations, strong order book, and improving profitability.
- The recent correction is seen as a healthy consolidation after a sharp rally, though further volatility is likely in the short term.
- The long-term outlook is favorable, supported by ongoing growth in the auto components sector and the company’s expanding market share.
#### Summary
NDRAUTO has delivered outstanding returns over the past year, driven by robust financial performance and strong sector momentum. The stock is currently consolidating after hitting record highs and remains highly volatile. While valuations are elevated, the company’s growth trajectory and operational efficiency support a positive outlook for medium- to long-term investors. Short-term caution is warranted due to recent volatility and profit booking.

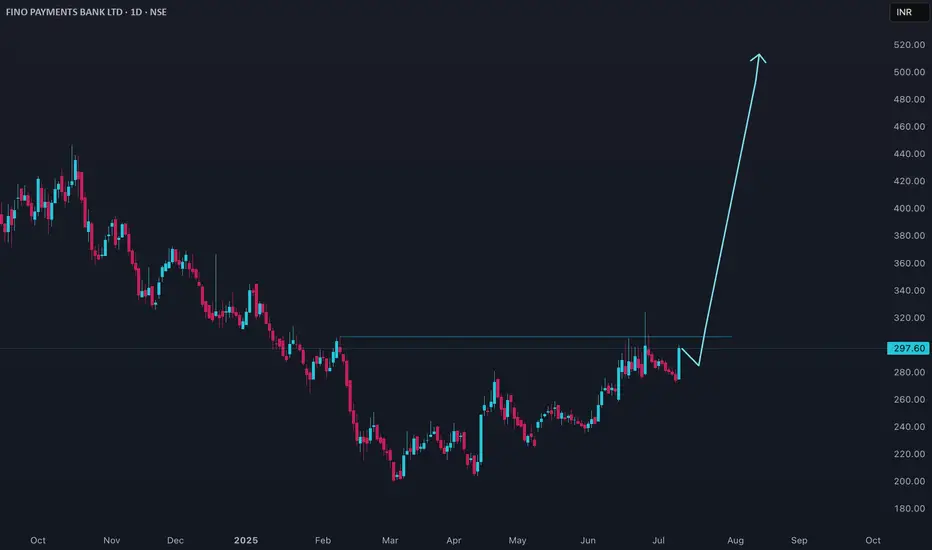
FINOPB Price Action#### Current Price and Performance
- **Fino Payments Bank (FINOPB)** is trading around ₹274–₹278 as of July 8–9, 2025.
- The stock has seen a recent high of ₹300 and a low of ₹274.95 in the latest trading sessions.
- Over the past month, the price has declined from the ₹286–₹290 range, with a notable drop from its 52-week high of ₹467.
- The 52-week low stands at ₹200, highlighting significant volatility in the past year.
#### Trend and Technical Overview
- The short-term trend is **negative**, with the stock slipping about 4% over the past week and nearly 7% in the last month.
- Volumes are robust, with daily trading often exceeding 1.5 million shares, indicating high market participation and speculative interest.
- The stock is currently trading closer to its lower circuit limit than its upper circuit, reflecting bearish sentiment.
#### Valuation and Financial Metrics
- FINOPB is priced at a **low price-to-earnings (P/E) and price-to-book (P/B) ratio**, though exact values are not meaningful due to inconsistent profitability.
- The trailing twelve-month (TTM) earnings per share (EPS) is positive and has grown 7.3% year-on-year.
- The market capitalization is around ₹2,477 crore.
- Dividend yield is 0%, and the company has not announced any dividends recently.
#### Market Sentiment and Outlook
- Sentiment is cautious, with the stock underperforming the sector and broader indices in 2025.
- The price action reflects ongoing concerns about growth visibility and profitability, despite some improvement in recent quarters.
- The stock is viewed as a high-risk, high-volatility play, with traders dominating activity rather than long-term investors.
#### Summary
FINOPB is in a corrective phase, trading near the lower end of its yearly range after a sharp decline from its highs. While trading volumes are high and EPS has shown some growth, the lack of dividends and inconsistent profitability weigh on sentiment. Investors should remain cautious, as the stock’s volatility and weak trend suggest further downside risk unless there is a clear improvement in fundamentals.
### JYOTISTRUC Price Analysis#### Current Price and Performance
- Jyoti Structures Ltd is trading at approximately **₹17.59** as of July 8, 2025.
- The stock has experienced high volatility in recent weeks, with daily swings of 2–5% being common.
- Over the past month, the price has generally trended downward from the ₹19–₹20 range, with multiple sessions closing in the red.
- The 52-week high is near ₹22, and the low is just above ₹15, indicating a wide trading range and active speculative interest.
#### Trend and Technical Overview
- The short-term trend is **negative**, with the stock declining about 10% over the last two weeks.
- Daily volumes remain elevated, suggesting ongoing trader participation but also reflecting uncertainty and rapid profit booking.
- The stock has failed to sustain above key resistance levels near ₹18.50–₹19.00, and support is now seen around ₹17.00.
#### Valuation and Financial Metrics
- Jyoti Structures is a small-cap company in the capital goods sector, and its financials remain under pressure, with limited earnings visibility.
- The company has a history of restructuring and remains sensitive to sector news, which adds to price volatility.
- Valuation multiples are not meaningful at this stage due to inconsistent profitability.
#### Market Sentiment and Outlook
- Sentiment is cautious, with traders focusing on short-term momentum rather than long-term fundamentals.
- The stock’s recent decline and inability to hold higher levels suggest that risk remains elevated.
- Any sustained recovery will likely depend on improvement in financial results or sector-specific positive developments.
#### Summary
JYOTISTRUC is currently in a corrective phase, marked by high volatility and weak short-term momentum. While trading interest is strong, the lack of earnings clarity and recent price declines point to ongoing risk. Investors should approach with caution, focusing on technical support levels and monitoring for signs of fundamental improvement.

GRSE Price Action
#### Current Price and Performance
- **GRSE** is trading near ₹2,965–₹2,974 as of July 9, 2025, after a recent dip from its 52-week high of ₹3,538.
- Over the past year, the stock has delivered a return of approximately 9%, with a sharp rally in the past three to six months (up about 81–84% during that period).
- The stock has shown high volatility, with a notable correction of nearly 13% in the last month and a 4.5% decline in the last week.
#### Trend and Technical Overview
- **Medium-term trend** remains positive, supported by strong order inflows and robust financials, but the recent correction suggests some profit booking and consolidation after a rapid upmove.
- Technical indicators reflect heightened volatility, with the stock pulling back from overbought levels.
- The stock is trading at a high price-to-earnings (P/E) ratio of about 64 and at 16 times its book value, indicating premium valuation.
#### Valuation and Financial Metrics
- **Market capitalization** is around ₹34,000 crore.
- **Return on equity (ROE)** stands at 28%, and **return on capital employed (ROCE)** is 37%, both indicating efficient use of capital.
- **Dividend yield** is modest, around 0.3–0.5%.
- The company is nearly debt-free and has delivered strong profit growth (CAGR of 26% over five years).
- Revenue and profit have grown significantly, with FY25 revenue at ₹5,076 crore and net profit at ₹527 crore.
- Operating margins have improved to 8%, and the company maintains a healthy dividend payout ratio of about 30%.
#### Market Sentiment and Outlook
- Sentiment remains positive, given GRSE’s strategic role in defense shipbuilding and a strong order book.
- Analysts highlight the company’s consistent financial performance and leadership in its sector, though caution is advised due to high valuation multiples.
- The recent correction may offer a better entry point, but further consolidation or volatility is possible in the short term.
#### Summary
GRSE has delivered strong medium-term returns, underpinned by robust financials, sector leadership, and efficient capital management. The stock is currently consolidating after a sharp rally and is trading at premium valuations. While the long-term outlook remains positive, investors should be mindful of recent volatility and elevated price multiples when considering new positions.

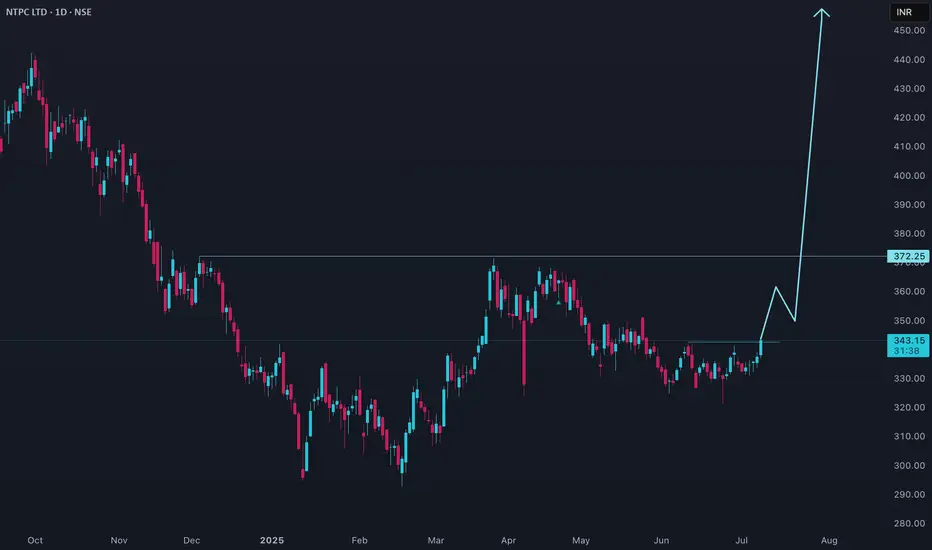
NTPC price action### NTPC Price Analysis
#### Current Price and Performance
- NTPC is trading in the ₹370–₹380 range as of early July 2025.
- The stock has achieved a 52-week high near ₹390 and a low around ₹200, reflecting a strong upward trend over the past year.
- Year-to-date, NTPC has delivered a return of over 60%, with particularly strong momentum in the last six months.
- Short-term price action shows some consolidation after a sharp rally, with minor fluctuations in the past few weeks.
#### Trend and Technical Overview
- The medium-term trend remains bullish, supported by robust earnings, capacity expansion, and favorable sector dynamics.
- Technical indicators suggest the stock is in overbought territory, with some analysts expecting a pause or correction before the next leg up.
- NTPC’s beta is below 1, indicating lower volatility compared to the broader market.
#### Valuation and Financial Metrics
- NTPC trades at a moderate price-to-earnings (P/E) ratio, below many private sector peers, making it relatively attractive from a valuation perspective.
- The price-to-book (P/B) ratio is reasonable, reflecting the company’s stable asset base.
- Dividend yield is above 3%, appealing to income-focused investors.
- The company maintains a strong balance sheet, steady cash flows, and a history of consistent dividend payouts.
#### Market Sentiment and Outlook
- Market sentiment is positive, with analysts maintaining a buy or accumulate stance for long-term investors.
- The company’s focus on renewable energy and capacity addition is seen as a key growth driver.
- While the stock may experience short-term consolidation, the long-term outlook remains favorable due to NTPC’s dominant position in the power sector and ongoing expansion plans.
#### Summary
NTPC has delivered impressive returns over the past year, driven by strong fundamentals and sector tailwinds. The stock is currently consolidating after a significant rally, but its valuation, dividend profile, and growth prospects make it attractive for investors with a medium- to long-term horizon. Caution is warranted in the short term due to potential profit booking, but the overall outlook remains positive.
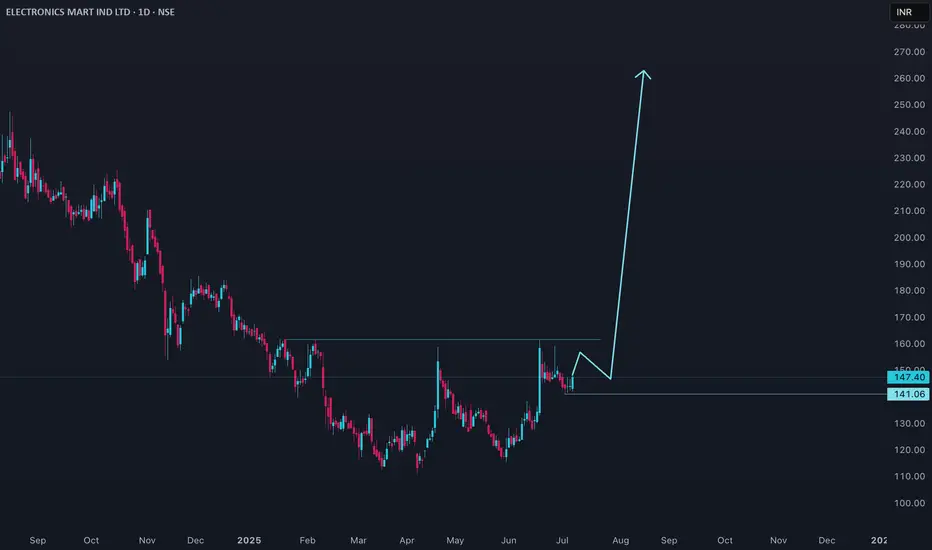
### EMIL Price AnalysisElectronics Mart India Ltd (EMIL) recently closed at around ₹144, showing a modest uptick after a period of volatility. The stock has rebounded sharply over the past month, gaining over 16%, yet it remains well below its 52-week high of ₹262. The past year has been challenging, with the share price down more than 35%, underperforming both its sector and the broader market.
Technically, EMIL is trading above key short-term moving averages, suggesting a short-term uptrend. The price is above the 20-day and 50-day averages, but still below the long-term 200-day average, indicating that while momentum has improved, the broader trend remains cautious. The stock’s volatility is notably high, with weekly price swings above the market average.
Momentum indicators like MACD and RSI are showing positive signals, but there are early signs of momentum loss, and volume-based indicators suggest some recent selling pressure. The stock is currently near a resistance zone, and a sustained move above ₹150 could trigger further upside, while support is seen around ₹138.
Fundamentally, EMIL has demonstrated steady revenue and profit growth over the last few years, but recent quarters have shown a decline in profitability. The company’s price-to-earnings ratio is on the higher side, suggesting it is not undervalued relative to its earnings. Analyst forecasts indicate moderate growth potential, with a one-year price target in the ₹160–₹190 range.
In summary, EMIL is showing signs of a short-term recovery with improving technicals, but long-term investors should remain cautious given its recent underperformance and valuation concerns. A clear breakout above resistance levels would strengthen the bullish case, while failure to hold above support could lead to renewed weakness.
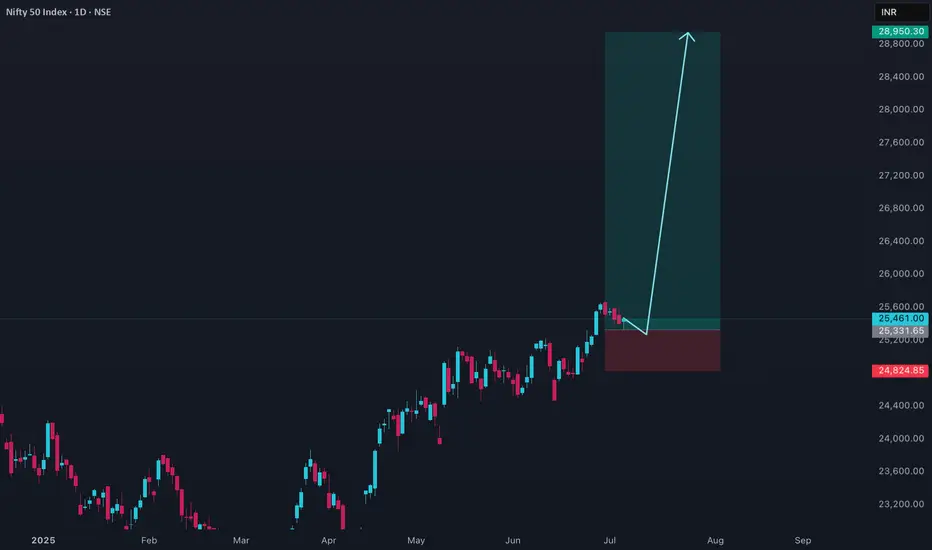
Nifty price actionNifty 50 closed at 25,461 with a modest gain, reflecting cautious optimism after recent profit booking and volatility. The index formed a bullish hammer candlestick, which is often interpreted as a sign of potential short-term reversal or support. Buying interest in heavyweight stocks like Bajaj Finance, Infosys, Dr. Reddy’s, ICICI Bank, and Wipro helped offset declines in sectors such as metals and auto.
Technically, Nifty found support near its near-term EMA trendline, and the RSI remains healthy in the low 60s, suggesting the trend is still neutral to positive. Immediate support levels are at 25,240 and 25,103, while resistance is seen at 25,682 and 25,819. Sustained trading above 25,682 could trigger further upside, possibly toward 26,000, but a break below 25,240 would increase the risk of a deeper correction, with 25,000 and 24,500 as the next key supports.
Market sentiment remains cautiously optimistic, with advances outnumbering declines. However, overbought oscillators and low ADX readings indicate limited momentum, so the index may remain rangebound unless a clear breakout or breakdown occurs. Traders are advised to watch for a decisive move above 25,600 for bullish confirmation, or below 25,240 for signs of renewed weakness.
Banknifty price actionBank Nifty closed at 57,031.9 on July 4, 2025, up 0.42%, showing resilience after a brief dip earlier in the week. The index has been consolidating near all-time highs, maintaining a bullish structure with higher highs and higher lows on the daily chart. Despite some profit booking, Bank Nifty remains above its key moving averages, and technical indicators like RSI and MACD continue to support the broader uptrend.
Short-term support is seen around 56,500–56,600, which aligns with the 20-day EMA. As long as Bank Nifty holds above this zone, the bias remains positive and the index could attempt to move towards resistance levels at 57,540 and 57,854. A decisive close above 57,800 would likely open the path to 58,500. However, overbought oscillators and a weak ADX suggest the trend strength is moderate and the market could remain rangebound unless a breakout occurs.
Constituent performance has been mixed, with ICICI Bank, AU Bank, HDFC Bank, and Axis Bank contributing to gains, while Bank of Baroda, IndusInd Bank, and Federal Bank saw mild declines. Overall, the structure favors a buy-on-dips approach as long as the index stays above its immediate support. A close below 56,500 would be the first sign of a deeper correction.

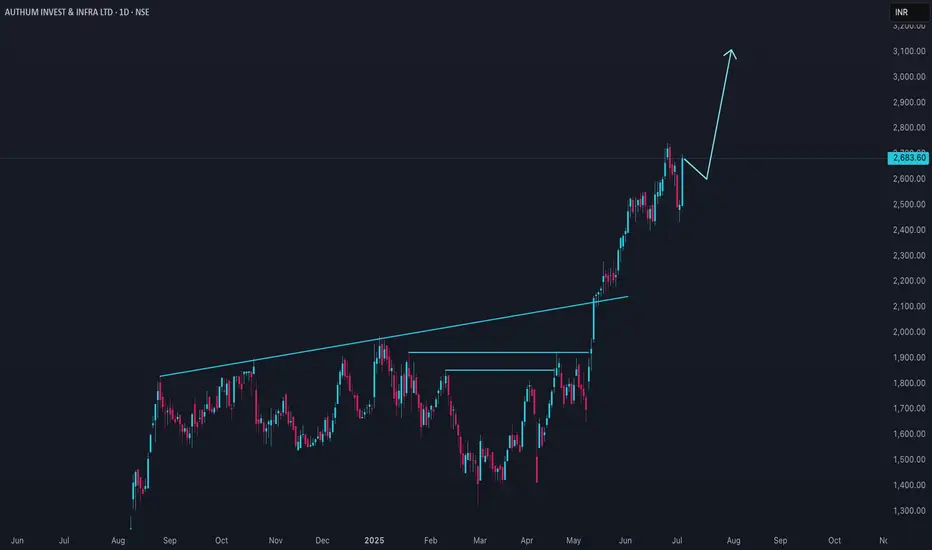
AIIL Price actionAuthum Investment & Infrastructure Ltd (AIIL) has shown significant price appreciation over the past year, rising by more than 120%. The stock recently reached an all-time high near ₹2,600, with its lowest point in the past year being around ₹730. In the last month, AIIL gained over 17%, and in the past week alone, it rose by more than 6%.
The stock is considered volatile, with price swings that are sharper than the broader market. Technical indicators, such as moving averages, generally point to a bullish trend, with the short-term average staying above the long-term average. However, there have been recent signals of a possible short-term correction, including a minor sell indication from the MACD and a pivot top formation. Key support levels to watch are around ₹2,440 and ₹2,050; a drop below these could suggest further downside.
Trading volumes have increased as the price moved higher, which is typically a positive technical sign. The company’s fundamentals remain strong, with a high promoter holding and steady dividend payouts, although the dividend yield is low. Overall, AIIL’s trend remains positive, but the stock’s high volatility means that price corrections can be sharp, and investors should manage risk accordingly.
Paras Defence Price ActionParas Defence and Space Technologies is currently trading near ₹1,630, having delivered a substantial rally over the past year and outperformed many of its peers in the defence sector. The stock has risen more than 100% from its 52-week low and is trading close to its all-time high, reflecting strong investor confidence and robust momentum. Year-to-date, the stock is up over 60%, though it has shown some short-term volatility with a recent pullback of about 9% in just two days, suggesting a phase of consolidation or correction after its sharp rally.
Fundamentally, the company has demonstrated impressive growth, with recent quarterly results showing revenue up nearly 36% year-on-year and net profit more than doubling. Its return on equity is healthy, and the business remains largely debt-free, which supports its financial stability. The company is also preparing for its first-ever stock split, with a record date set for July 4, 2025. This move is expected to enhance liquidity and attract more retail investors.
Despite these positives, Paras Defence is trading at a high price-to-earnings ratio, indicating that the stock is priced for strong future growth and leaving little room for disappointment. Analyst sentiment is generally positive for the long term, but there is near-term caution due to the recent run-up in price and some signs of weakening momentum. Technical analysts point to key support levels around ₹1,500–₹1,570, with a need for the stock to reclaim ₹1,630 for renewed bullishness.
Overall, Paras Defence is benefiting from strong sector tailwinds, government investment in defence, and its own technological capabilities. While the long-term outlook remains promising, investors should be mindful of the elevated valuation and the potential for further short-term corrections as the stock digests its recent gains.

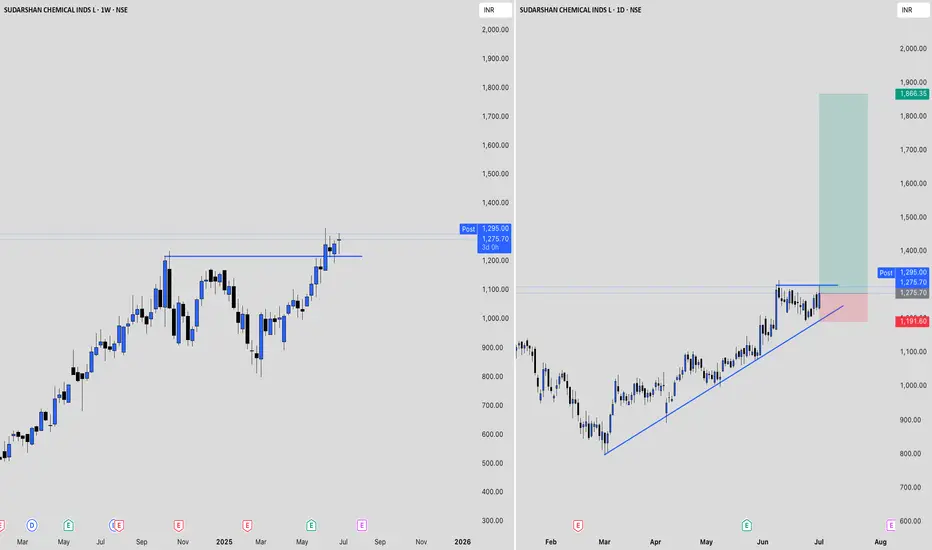
Sudarshan Price ActionSudarshan Chemical Industries is currently trading around ₹1,256, having gained nearly 5% in the past week and over 6% in the last month. The stock has delivered a strong 10% return over six months and nearly 40% over the past year, reflecting robust momentum. Its 52-week high is ₹1,315, while the low stands at ₹796, placing the current price close to its yearly peak.
Valuation-wise, Sudarshan Chemical trades at a high price-to-earnings ratio above 80 and a price-to-book ratio above 8, signaling that the stock is richly valued compared to sector norms. Despite the premium valuation, the company has attracted positive sentiment, with most analysts maintaining a buy or hold stance, though the average target price is slightly below current levels, suggesting limited near-term upside.
Financially, the company has shown steady revenue growth and improved profitability in recent quarters, with net profit margins expanding from previous periods. However, promoter holding has decreased recently, and the company’s sales growth over the past year has been modest. The stock’s low beta indicates relatively lower volatility compared to the broader market.
In summary, Sudarshan Chemical Industries is exhibiting strong price momentum and positive investor sentiment but is trading at expensive valuations. While its recent financial performance has improved, the high valuation and reduced promoter holding may warrant caution for new investors.
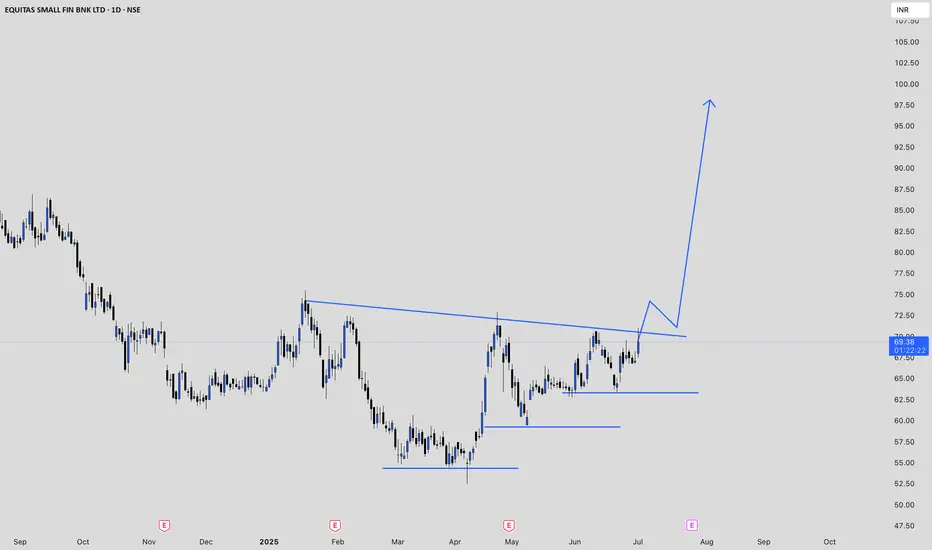
EQUITASBNK Price ActionEquitas Small Finance Bank is currently trading around ₹69, showing a strong gain of over 5% on July 1, 2025, and outperforming its sector in the short term. The stock has been volatile, with a day range between ₹67.50 and ₹71.00. Its 52-week high is ₹97.21, while the 52-week low stands at ₹52.52, placing the current price closer to the lower end of this range. The all-time high for the stock is ₹116.50.
Market capitalization is approximately ₹7,950 crore, and trading volumes remain robust, with recent daily volumes exceeding 6.5 million shares. This liquidity ensures ease of entry and exit for investors. Over the past year, the stock has declined about 30%, reflecting broader challenges in the sector and some company-specific headwinds.
Financially, Equitas Small Finance Bank has reported revenue of about ₹6,312 crore and a net profit of ₹147 crore. However, the company’s interest coverage ratio is low, indicating some pressure on its ability to service debt from operating profits. The stock is generally considered to have average financial strength but is recognized for its high growth trend, albeit currently priced at high valuations. The trailing twelve-month EPS has declined sharply year-on-year, and the stock is trading at a high price-to-earnings multiple relative to sector norms.
In summary, Equitas Small Finance Bank is showing short-term momentum and strong trading activity but remains well below its yearly highs. The company faces profitability and valuation challenges, and while growth prospects are present, investors should be mindful of the recent volatility and underlying financial pressures.
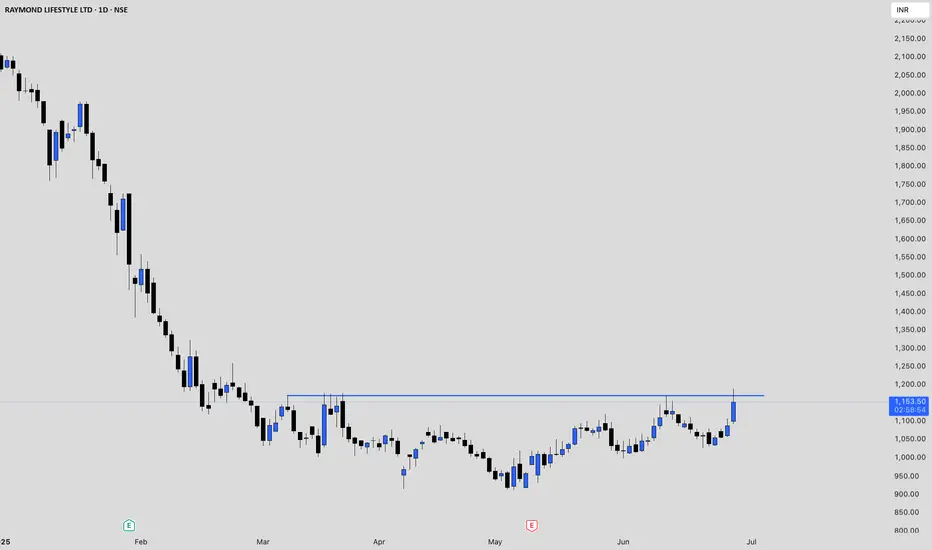
RAYMONDLSL Price actionRaymond Lifestyle Ltd (RAYMONDLSL) is currently trading in the range of ₹1,088 to ₹1,179 as of June 26, 2025, showing a strong rebound in the last few days after a prolonged period of decline. Over the past year, the stock has been highly volatile, reaching a 52-week high of ₹3,100 and hitting a low of ₹911.35 in May 2025. The share price has dropped significantly, with a decline of about 64% over the last year and nearly 48% over the last six months.
Despite this correction, the stock has recently shown some positive momentum, climbing over 11% in the past week and about 8% in a single session. Its market capitalization is around ₹7,185 crore. The price-to-earnings (P/E) ratio is low at 2.72, and the price-to-book (P/B) ratio is also relatively modest, indicating the stock may now be trading at more reasonable valuations compared to its recent past.
Raymond Lifestyle has demonstrated exceptional revenue growth, with annual growth far outpacing its three-year compound annual growth rate. However, the company has also taken on new debt for the first time in five years, which could impact its financial flexibility going forward. Technical signals, such as a recent 50-day moving average crossover, suggest that there could be further short-term upside, as this pattern has historically led to gains in the following month.
Overall, Raymond Lifestyle Ltd is recovering from a sharp correction and is currently showing signs of short-term strength. The company’s fundamentals reflect strong revenue growth but also new debt obligations. Investors should be aware of the stock’s high volatility and recent history before making decisions, as the long-term trend remains cautious despite recent gains.
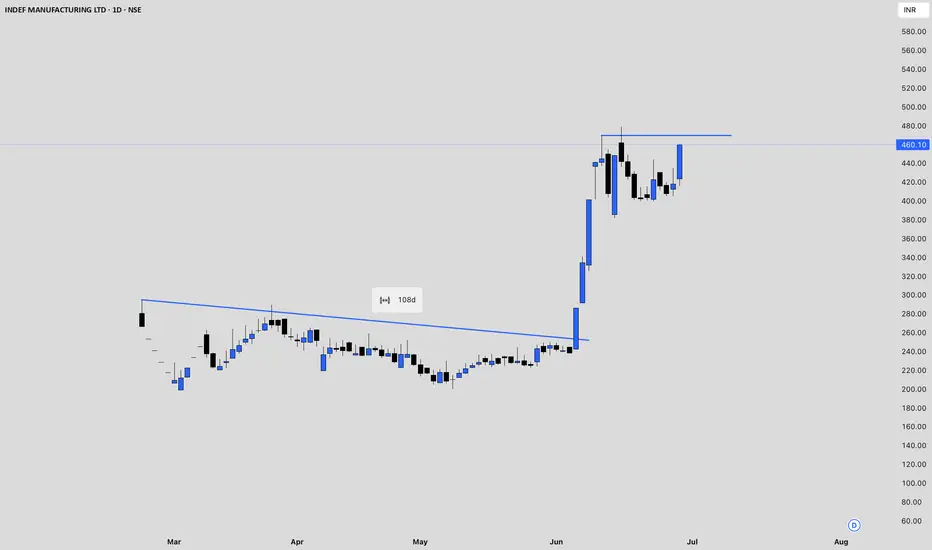
BAJAJINDEF Price ActionBajaj Indef (BAJAJINDEF) has experienced a period of high volatility and rapid price movement in June 2025. After a sharp rally from around ₹225 in late May to a peak near ₹478.90 by mid-June, the stock has since corrected and is now trading in the ₹400–₹420 range. This recent surge was accompanied by significant spikes in trading volume, indicating heightened market interest and participation.
The stock’s price action shows a pattern of large daily swings, with both double-digit percentage gains and losses within short intervals. This suggests speculative activity and possibly profit-booking after the strong rally. The valuation of the stock has shifted from not qualifying to being considered very expensive, reflecting the sharp run-up in price relative to its fundamentals.
Short-term momentum appears to have cooled, with the stock pulling back from its highs and now consolidating. Investors should be cautious, as the recent volatility and elevated valuation may lead to further price fluctuations. The underlying trend remains positive compared to levels a month ago, but the risk of sharp corrections is high given the stock’s recent behavior.
CERA Price action**CERA Sanitaryware (NSE: CERA) Price Analysis – June 2025**
- **Current Price:** As of June 27, 2025, CERA closed at ₹6,816, showing a 3.33% gain from the previous session.
- **Recent Trend:** The stock has been volatile in June, with prices fluctuating between ₹6,573 and ₹7,275. Over the past week, it declined by about 2.8%, but remains up 6% for the month and nearly 17% over the past three months.
- **Long-Term Performance:** Despite recent weakness, CERA has delivered a 62% return over three years and nearly 198% over five years. However, the stock is down about 27% year-on-year and 8.5% over the last six months, reflecting sectoral and company-specific challenges.
- **Valuation:** The price-to-earnings ratio is around 34.5, and price-to-book is 6.2. The dividend yield is close to 1%. These metrics are moderate compared to sector peers, with CERA’s PE below Kajaria Ceramics but above Somany Ceramics.
- **Fundamentals:** Revenue growth has averaged 7.2% annually over five years, slightly above the industry average. Net income growth is strong at 15.7% per year. The company recently reported modest revenue growth but faced margin pressures, with EBITDA declining in the latest quarter.
- **Outlook:** Analysts remain mostly positive, with a majority suggesting a buy rating. The company is focusing on operational efficiency and expanding its luxury product range to counter retail market challenges. Recovery in the real estate sector and government initiatives are expected to support future growth.
**Key Takeaway:**
CERA’s stock is stabilizing after a period of volatility, supported by solid long-term fundamentals but facing near-term headwinds in profitability and demand. The medium-term outlook is constructive, especially if margin recovery strategies succeed and sector demand improves.

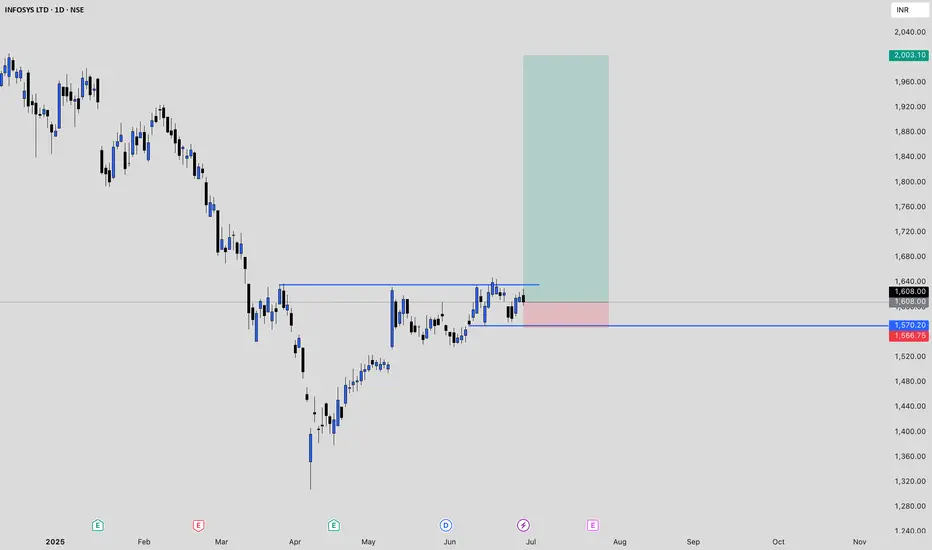
Infy Price actionInfosys (INFY) is currently trading around ₹1,608, with recent fluctuations between ₹1,606 and ₹1,629. Over the past year, the stock has delivered modest gains, slightly underperforming broader market indices and the IT sector. Financially, Infosys remains robust, maintaining strong revenues, healthy profit margins, and a debt-free balance sheet. The company continues to reward shareholders with consistent dividends, including a recent payout of ₹22 per share.
Looking ahead, growth expectations for Infosys are muted. The company has projected revenue growth of just 0–3% for the upcoming fiscal year, citing macroeconomic uncertainties and cautious client spending in its key markets. This represents one of the lowest growth forecasts for Infosys in over a decade and reflects broader industry headwinds, including delayed client decision-making and a focus on cost optimization.
Analyst sentiment is generally positive but cautious, with most maintaining a buy or hold rating. Price forecasts for the next year range from ₹1,667 to ₹1,945, indicating limited upside from current levels. Technical analysis shows immediate support near ₹1,579 and resistance around ₹1,633, suggesting the stock is likely to remain range-bound in the near term.
In summary, Infosys is financially sound and offers stable dividends, but near-term growth is expected to be subdued due to global economic challenges and restrained client budgets. The stock is more attractive for investors seeking stability and income rather than aggressive capital appreciation at this stage.
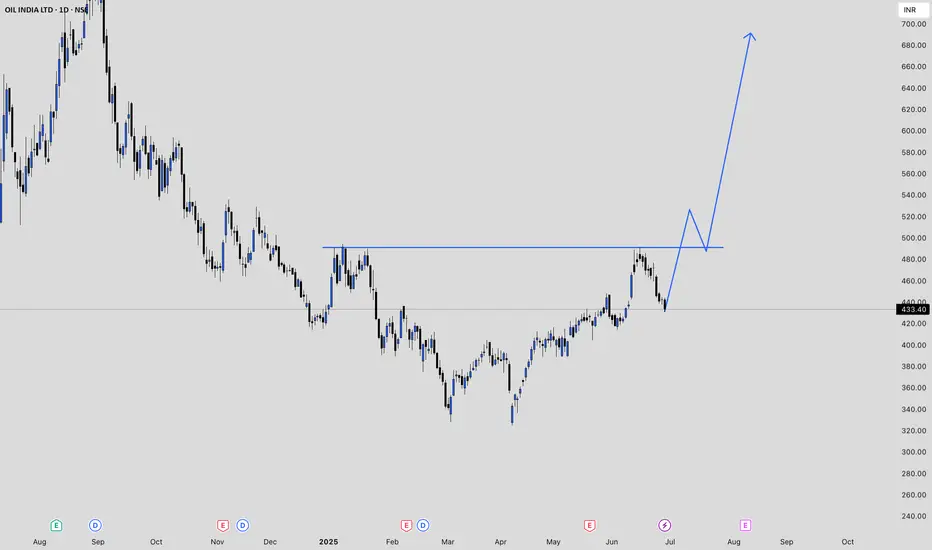
OIL Price ActionOil India Limited is currently trading at ₹433.40 as of June 27, 2025. The stock has seen a notable decline over the past week, falling by nearly 7%. Over the last month, the price has remained relatively flat, with a slight gain of about 0.5%. Looking at a broader time frame, the stock is up 12% over the past three months and has gained just under 2% in the last six months.
The 52-week high for Oil India stands at ₹767.90, while the low is ₹325.00, indicating that the stock is trading well below its peak for the year. Recent sessions have shown increased volatility, with sharp movements both up and down. For example, the stock dropped over 5% in a single day on June 24, after previously rallying above ₹470 earlier in the month.
Oil India’s price-to-earnings (PE) ratio is 10.98, and the price-to-book (PB) ratio is 1.32, suggesting the stock is reasonably valued compared to its historical averages and sector peers. The company maintains a market capitalization of around ₹70,500 crore, ranking it among the larger players in India’s gas and petroleum sector.
In summary, Oil India Limited is currently in a correction phase after a strong run-up earlier this year. The stock is trading closer to its recent lows than its highs, with moderate valuation metrics and ongoing volatility. Investors should watch for further price stabilization before considering new positions.
CEATLTD Price actionCEAT Ltd has recently shown a recovery in its price action after a period of volatility. The stock closed at ₹3,645.30, rebounding over 2% in the latest session following a brief dip earlier in the week. Over the past month, CEAT experienced a mild correction, with the price dropping about 4%, but the three-month return remains strong at over 25%. On a one-year basis, the stock has delivered a solid gain of more than 37%, reflecting sustained investor interest and underlying business strength.
Trading volumes have picked up during the recent upswings, indicating renewed buying interest at lower levels. The price has oscillated between ₹3,500 and ₹3,700 in the past week, suggesting the presence of both support and resistance in this range. Despite the recent volatility, the long-term trend remains positive, with the stock having nearly tripled over the past three years.
Fundamentally, CEAT is trading at a premium to its book value, and its return on equity has been moderate. The company’s overall financial health and growth prospects continue to support the stock’s medium- to long-term outlook, though short-term moves may remain choppy as the market digests recent gains. In summary, CEAT is in a consolidation phase after a strong rally, with a positive longer-term trend and renewed buying interest evident on recent dips.

PGHH Long Target 19000 + PGHH is forming Harmonic Pattern on Monthly chart. Patience is key.
Stop Loss 12000
Target 1 - 15000
Target 2 - 17000
Target 3 - 19000
Target 4 - 22000

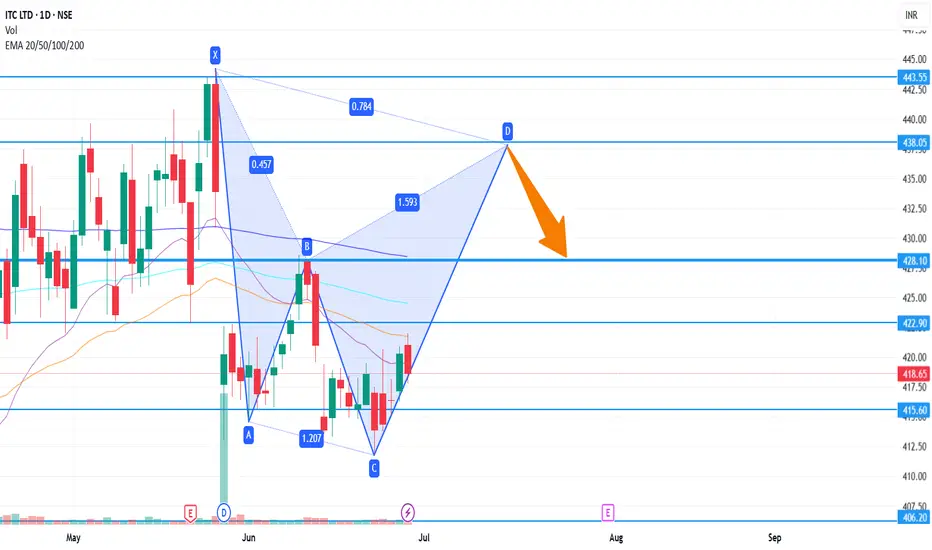
ITC Short Term 438ITC on daily chart is forming a bearish harmonic pattern.
If it follows the pattern formation then next targets at 428 and 438
Stop Loss is 413