GBP/AUD: Corrective Rally, Downtrend IntactGBP/AUD is trading in a clear bearish Elliott Wave structure on the 4H timeframe. The market has already completed a strong impulsive decline and is currently moving in a Wave 4 corrective pullback, which is happening inside a downward channel and near key Fibonacci retracement levels. This correction looks weak and corrective, suggesting sellers are still in control. As long as price remains below the invalidation level around 2.0050 , the bearish bias stays valid. The expectation is for the correction to finish soon, followed by Wave 5 to the downside, targeting the lower channel area and the 1.96–1.95 zone. Overall, the trend remains bearish, and any short-term bounce is likely a selling opportunity before the next leg lower.
Stay tuned!
@Money_Dictators
Thank you :)
GBPAUD

GBP/AUD WEEKPLAN: Best Sell Zone Short StoplossFootprint Analysis OANDA:GBPAUD
Previous Trend: The candles before the 18th showed an uptrend. Specifically, the candle on the 17th had a strong positive Delta (+5.24K), with the buy volume (green) dominating the sell volume (red) at most price levels. This confirms that buyers were in control and pushed the price up.
Order Flow Shift: Starting with the candle on the 18th, there was a clear change. This candle had a negative Delta (-1.55K), indicating that selling pressure had started to take over again. Although the total volume remained high, the Delta shows that selling pressure was strengthening.
Current Trend (19th): The most recent candle has a positive Delta (+2.07K). This is very important. It shows that after a day of strong selling pressure, buyers have returned. The large buy volume (green) at lower price levels compared to the recent high indicates that buyers are "accumulating" at a lower price. This is a sign that a recovery may be underway.
In summary of the Footprint: The Footprint data confirms a short-term correction (due to the negative Delta), but the return of a positive Delta shows that buying pressure has returned. This aligns with a scenario where the price retraces to a strong support zone before continuing the uptrend.
OANDA:GBPAUD SMC Plan Analysis
Market Structure Analysis
Change of Character (M-ChoCH): The price changed its structure from bearish to bullish by breaking the most recent high, marked as "M-ChoCH".
Break of Structure (BOS): After the ChoCH, the price continued to rise and broke a higher high, creating a new "BOS," which confirms that the uptrend is still strong.
Current Trend: The price has created a new high and is in a corrective phase, retracing to a strong support zone.
Identification of Key Zones
Support/Buy Zone:
Location: The price range is from ~2.0420 to ~2.0440.
Significance: This is the most important Order Block (OB) zone. It was formed right after the BOS and shows signs of buying pressure returning (confirmed by the recent positive Delta on the Footprint). This is the highest-potential area to consider for a long entry.
Resistance/Sell Zone:
Location: There are two main zones. The first is the recent price range of ~2.0480 to ~2.0500. The second is located at a higher peak, around ~2.0650 to ~2.0690.
Significance: The first zone is where the price might have a minor reaction and continue to correct toward the BUY ZONE. The second zone is the target for a long trade, where potential sell orders are placed.
Detailed Trading Plan
Primary Scenario (Long Trade):
Entry: Wait for the price to pull back to the BUY ZONE (~2.0420 - 2.0440).
Reasoning: This is a strong Order Block zone where the price has already shown signs of a buy reaction (confirmed by the positive Delta on the Footprint).
Take Profit:
TP1: The nearest high (~2.0550).
TP2: The higher SELL ZONE (~2.0650 - 2.0690).
Stop Loss: Place it below the nearest low (below the BUY ZONE), around ~2.0390, for risk management.
Secondary Scenario (Short-Term Short Trade):
Strategy: A short-term trade, against the main trend.
Entry: Consider a short-term sell trade if the price reacts to the lower SELL ZONE (~2.0480 - 2.0500).
Reasoning: This zone could act as temporary resistance, pushing the price down to fill the BUY ZONE.
Take Profit: The BUY ZONE (~2.0420).
Stop Loss: Place it above the SELL ZONE, around ~2.0520.
Conclusion:
The combination of SMC and Footprint analysis shows that GBPAUD is in a strong uptrend, and the current downward phase is a healthy correction. The Footprint has confirmed the return of buying pressure, which reinforces the primary trading plan to wait for a buy entry at the strong Order Block zone.

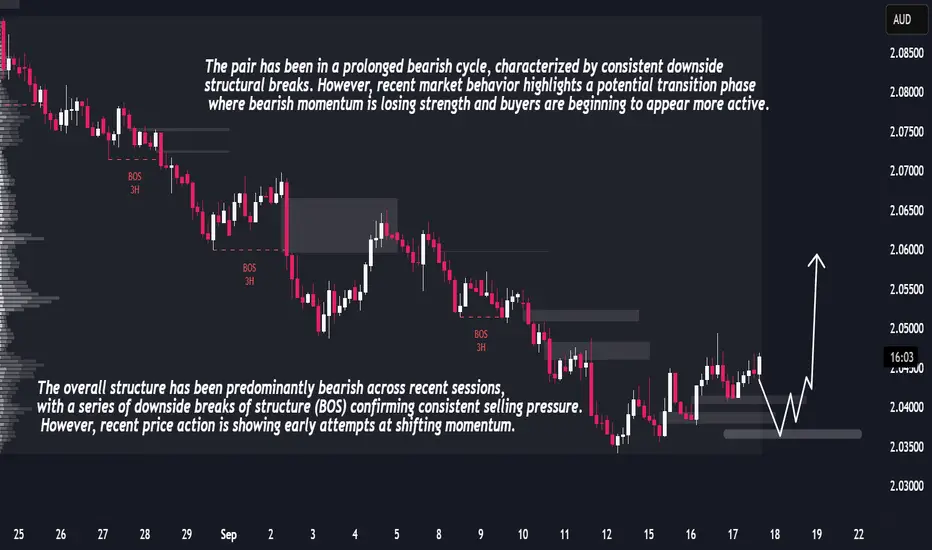
GBPAUD Forecast – Liquidity Sweep Before Strong Upside RallyGBPAUD has been moving through an extended bearish cycle, confirmed by multiple downside breaks of structure that signaled strong sell-side control. Each leg cleared liquidity and left inefficiencies behind, reflecting a market environment dominated by distribution phases. Recently, however, the dynamics are shifting. Price action has begun to compress, with shorter bearish candles and emerging higher lows that point toward weakening seller momentum and the early signs of accumulation.
Order flow analysis suggests that institutional participants may be absorbing positions within the current range. The market appears poised to engineer a downward liquidity sweep to trigger weak longs and attract late sellers before reversing upward. This type of behavior is typical of smart money accumulation phases, where liquidity is harvested before expansion.
Volume and volatility add weight to this narrative. Downside moves are losing strength, showing seller exhaustion, while volatility has contracted, signaling the market is coiling energy for a breakout. Given the structural setup and liquidity positioning, the probability favors a bullish expansion following a brief dip.
GBPAUD wave analysisGBPAUD taking support near fibonacci support 0.50% and 0.618%
Wave C achieved its target and made low near 1.94921
MACD giving positive crossover.
Expecting it to move towards channel top 1.96000+ in short term
Disclaimer : study is only for educational purpose.

GBPAUDGreetings!
Welcome traders.
By choosing to "Follow", you can stay updated with the latest information promptly. Kindly consider clicking "Boost" as well.
Wishing you a pleasant day.

GBPAUDGreetings!
Welcome traders.
By choosing to "Follow", you can stay updated with the latest information promptly. Kindly consider clicking "Boost" as well.
Wishing you a pleasant day.

GBPAUD BUYBuy GBPAUD at current price 93350 - 93600 and hold till Friday
TARGET POINT WILL BE 194200-194300

GBPAUDGreetings!
Welcome traders.
By choosing to "Follow", you can stay updated with the latest information promptly. Kindly consider clicking "Boost" as well.
Wishing you a pleasant day.

TRIANGLE PATTERN BREAKEDin GBPAUD
A good break out occurred
It will be down for few days
Grab it all forex user good opportunity

GBPAUDGreetings!
Welcome traders.
By choosing to "Follow", you can stay updated with the latest information promptly. Kindly consider clicking "Boost" as well.
Wishing you a pleasant day.

GBPAUD BuyFOREXCOM:GBPAUD
Hello traders , here is the full multi time frame analysis for this pair, let me know in the comment section below if you have any questions, the entry will be taken only if all rules of the strategies will be satisfied. wait for more Smart Money to develop before taking any position . I suggest you keep this pair on your watchlist and see if the rules of your strategy are satisfied...
Keep trading
Hustle hard
Markets can be Unpredictable, research before trading.
Disclaimer: This trade idea is based on Smart money concept and is for informational purposes only. Trading involves risks; seek professional advice before making any financial decisions. Informational only!!!!

GBPAUD BUYGreetings!
Welcome traders.
By choosing to "Follow", you can stay updated with the latest information promptly. Kindly consider clicking "Boost" as well.
Wishing you a pleasant day.

GBPAUDA broken trendline is a technical signal that can suggest a change in trend is at hand. If low volume (rather than high volume) accompanies the break of a trendline, the signal is not as strong or convincing. It can make sense to wait a day or two to make sure that the trendline break is legitimate

GBPAUDFX:GBPAUD
As you can see that, GBPAUD has created a FLAG & POLE pattern in 1Hr Time Frame, if it gives t breakout on upper side then we can plan for buy side, Always take retest entry and this set-up is for monday (21-08-23) Plan your trade accordingly...

GBPAUDFX:GBPAUD
As you can see that, GBPAUD is in consolidation and wait for the breakout. Take retest entry. plan your trade accordingly.....

GBPAUD SHORT Trade Idea:
WAIT FOR RIGHT TIMR I SHOWED YOU DIRECTION
💰 Risk 1% of your trading capital.
⚠️ Markets can be unpredictable; research before trading.Disclaimer: This trade idea is based on Elliott Wave analysis and is for informational purposes only. Trading involves risks; seek professional advice before making any financial decisions.Informational onLY !!!!

gbpaud sl updateTrade Idea:
📍 Entry: 🎯 Target: ⛔ Stop Loss: (MARKED IN CHART)
💡 RISK REWARD 1 :
💰 Risk 1% of your trading capital.
⚠️ Markets can be unpredictable; research before trading.Disclaimer: This trade idea is based on Elliott Wave analysis and is for informational purposes only. Trading involves risks; seek professional advice before making any financial decisions.Informational onLY !!!!

GBPAUD SHORT Trade Idea: SELL
📍 Entry: 🎯 Target: ⛔ Stop Loss: (MARKED IN CHART)
💡 RISK REWARD 1 : 4.5
💰 Risk 1% of your trading capital.
⚠️ Markets can be unpredictable; research before trading.Disclaimer: This trade idea is based on Elliott Wave analysis and is for informational purposes only. Trading involves risks; seek professional advice before making any financial decisions.Informational onLY !!!!AND IF YOU WANT TO LEARN IT WHAT STOPPING YOU TO ASK HOW ?

GBPAUD MONTHLY analysis short+longTrade Idea:
📍 Entry: 🎯 Target: ⛔ Stop Loss: (MARKED IN CHART)
💡 RISK REWARD 1 :
💰 Risk 1% of your trading capital.
⚠️ Markets can be unpredictable; research before trading.Disclaimer: This trade idea is based on Elliott Wave analysis and is for informational purposes only. Trading involves risks; seek professional advice before making any financial decisions.Informational onLY !!!!AND IF YOU WANT TO LEARN IT WHAT STOPPING YOU TO ASK HOW ?

GBPAUDFOREXCOM:GBPAUD
Hello traders , here is the full multi time frame analysis for this pair, let me know in the comment section below if you have any questions, the entry will be taken only if all rules of the strategies will be satisfied. wait for more Smart Money to develop before taking any position . I suggest you keep this pair on your watchlist and see if the rules of your strategy are satisfied...
Keep trading
Hustle hard

GbpAud buywe can see here a buy opportunity for a good risk reward..
here is maket take inducement and break the demand zone (failed OB) and EGL.. lets watch how react the market at our final POI.. .
guys i hope u like my work .. plz motivate me from ur likes and comments if u finding analysis helpful.. thank

GBPUSD mostly selling chanceGBPUSD look like a reversal from here
Analysis your view on this
Education purpose

