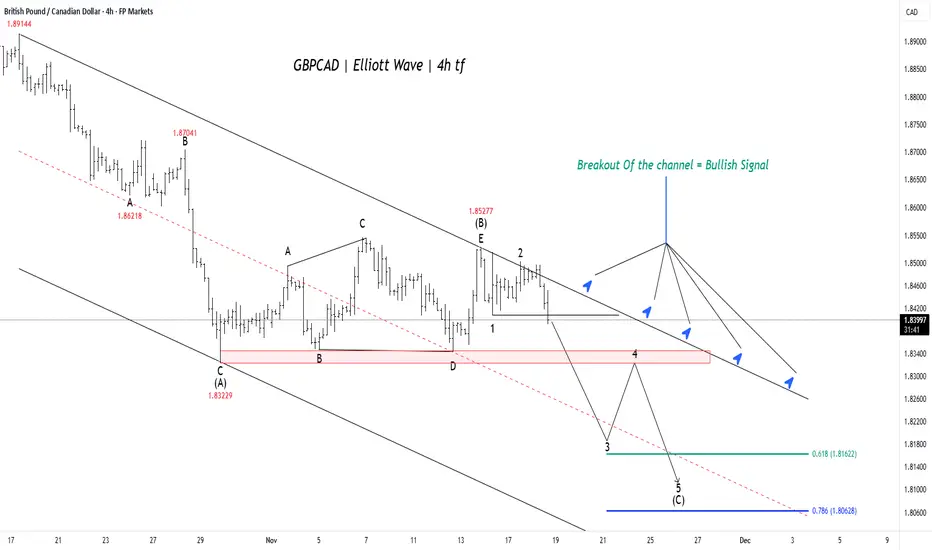
GBPCAD: Final Drop to Key Support Before Major ReversalThe wave Principle strongly suggests the currency pair is currently in the final stages of a large decline, which is expected to precede a major, sustained upward move.
Completion of Correction: The pair has recently completed a complex, sideways corrective pattern (such as a triangle or flat), marking the start of the final downward push.
Final Downward Leg: This ultimate decline, labeled wave (C), is now underway and is projected to drive the price into a critical support zone.
Target Zone: Traders are watching two key targets for the end of this correction: the 0.618 Fibonacci extension near 1.8162 and the deeper 0.786 extension at 1.8062 .
Anticipated Reversal :Once the price successfully completes this wave (C) and holds support within the 1.816 to 1.806 range, the analysis anticipates the immediate start of a significant and powerful bullish rally.
The current market price is still trading above this projected support zone, indicating that the final downward leg has room to run before the setup for the major reversal is complete.
Stay Tuned :)
@Money_Dictators
Gbpcadanalysis
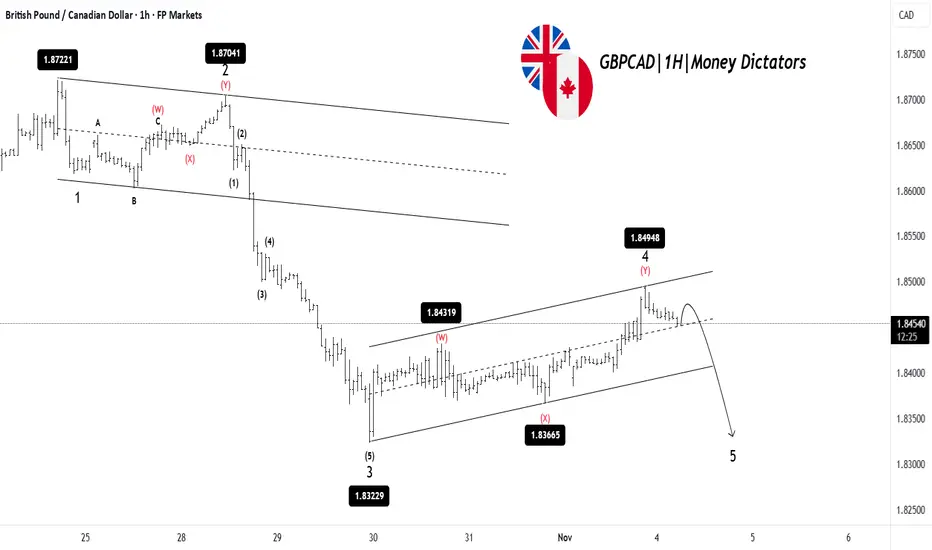
GBPCAD: Bears Ready to Push Into Wave 5GBPCAD has completed a clear 1-2-3 move to the downside, followed by a corrective Wave 4 that has pushed the price higher inside a rising channel. This correction now looks nearly complete, as the price is struggling to break above the resistance. Once Wave 4 is finished, the chart suggests a final drop into Wave 5 toward the lower support zone. That would complete the overall bearish structure before any larger reversal can happen. In simple terms: correction is almost done → one more leg down expected.
Stay tuned!
@Money_Dictators
Thank you :)
GBP/CAD Bullish Setup:Targeting 1.86500 from Demand Zone SupportTrendline ➡️
Price is respecting an upward trendline 📈 connecting higher lows 🔵 (marked by dots).
Channel ➡️
Price is moving inside an ascending channel 🚀 (controlled bullish movement).
EMA (70) ➡️
The red curve ➰ is the 70 EMA. Price is near it — showing indecision but still respecting it ⚖️.
Demand Zone ➡️
A strong demand zone 🔵 is marked between 1.8400–1.8440 where buyers jump in 🛒 whenever price touches it.
Support Zone ➡️
A nearby support zone 🛡️ is around 1.8480–1.8500. It's acting like a stepping stone 🧗♂️ for price to climb.
Target ➡️
The target 🎯 is clearly marked at 1.86500 — aiming for a nice breakout! 🚀📈
Summary
🔵 Stay above the demand zone ➡️ good for buys!
🛡️ Watch the support ➡️ could be a retest and bounce!
❌ If price breaks below demand zone, the setup is invalid ⚠️.
Simple Trading Plan:
✅ Buy near 🔵 demand or 🛡️ support.
✅ Target 🎯 1.86500.
❌ Stop Loss below 🔵 1.8390 area.

GBP/CAD Bullish Reversal Setup – Demand Zone PlaybookBias: Bullish 📈
Key Zones & Levels:
🔵 Demand Zone:
* Area: 1.83024 - 1.83527
* Role: Strong support where buyers previously entered
✅ Entry Point:
* 1.83527
* Right above the demand zone — wait for price to retrace here
🛑 Stop Loss:
* 1.83024
* Below demand zone — protects against a breakdown
🎯 Target Point:
* 1.85280
* Upper resistance level — offers ~3:1 reward-to-risk ratio.
Structure & Indicators:
📏 Bullish Flag/Channel:
* Price is consolidating inside a small ascending channel
* Orange arrow suggests potential drop to demand zone before rising
🧭 EMA (7-period):
* Currently at 1.84020
* Price above EMA = short-term uptrend still intact.
Trade Plan:
1. ✨ Wait for price to dip into the demand zone
2. 🕵️♂️ Look for bullish signals (candlestick patterns or bounce)
3. ✅ Enter around 1.83527
4. 🛑 Stop loss at 1.83024
5. 🎯 Target 1.85280

"GBP/CAD Bullish Setup: RBR Zone Bounce with 4:1 RRR "Trend:
⬆️ Bullish Trend – Market is making higher highs and higher lows, signaling upward momentum.
Key Zones & Levels
🔵 RBR Zone (Rally-Base-Rally)
This is the buy zone or demand area
📍Zone: Between 1.83927 and 1.83390
📌 Action: Look for bullish candles or patterns here
🟠 Entry Point
🔽 Entry: 1.83927
✅ This is where you consider going LONG
❌ Stop Loss
🔽 Stop: 1.83390
🛑 Protect your capital here if price drops below this zone
🎯 Target Point
🔼 Target: 1.86500
💰 Take profit zone
Possible Move
1. ⬇️ Pullback into RBR zone
2. 📈 Bullish bounce from the zone
3. 🚀 Upward rally toward 1.86500
Risk to Reward
⚖️ RRR: ~4:1 – Nice balance of risk vs potential profit!
Visual Flow
🎯 Target 1.86500
🔼
|
|
🚀 Price rallies up
|
🔄 Pullback
|
🔵 RBR Zone
🟠 Entry: 1.83927
|
❌ Stop: 1.83390

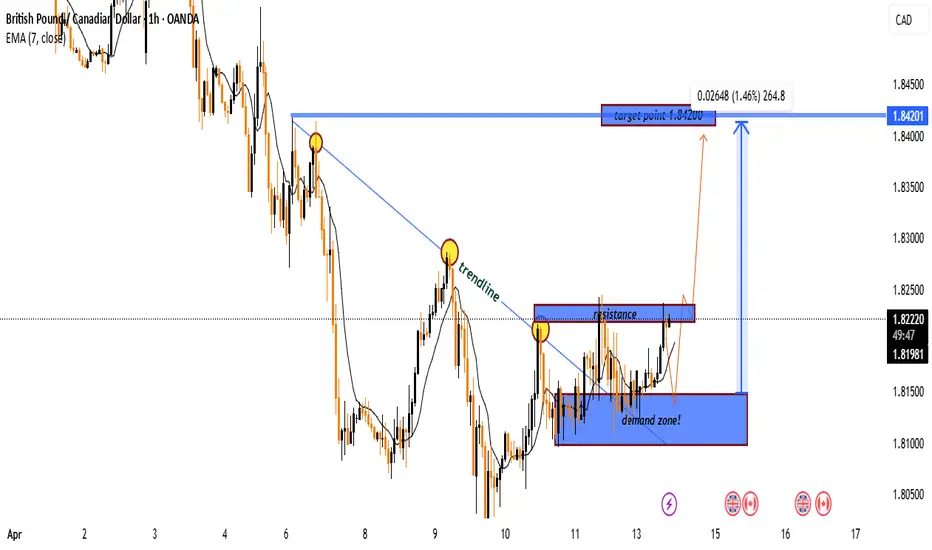
GBP/CAD Bullish Breakout Setup:Demand Zone Rejection with 1.84201. Trendline Breakout
🔻 Downtrend line (from earlier highs) was broken
➡️ Suggests momentum shift from bearish to bullish.
2. Demand Zone
📦 Demand Zone: 1.8130 - 1.8160
🟦 Strong buying interest here
🔁 Price bounced multiple times
💪 Bulls are defending this area!
3. Resistance Zone
🟥 Resistance near 1.8250
🔼 Price is currently testing this level
🚀 Break above = bullish confirmation
4. EMA (7)
📈 EMA7 = 1.81977
🟡 Price above EMA = short-term bullish momentum
5. Target Zone
🎯 Target Point = 1.8420
🔵 Move = +264.8 pips (1.46%)
📊 Bullish projection if breakout holds
6. Price Action
⏳ Price has been consolidating
🧱 Building pressure in a tight range
💥 Breakout candle forming – watch for volume!
Summary
✅ Bullish Setup forming
🟦 Support strong at demand zone
🔁 Testing resistance
🎯 Breakout may lead to a push toward 1.8420
GBPCAD - FALSE BREAKDOWN SIGNALS MORE UPSIDESymbol - GBPCAD
CMP - 1.8150
The GBPCAD pair is currently exhibiting a false breakdown of its trend support. In the context of a weakening US dollar, the British pound has entered a rally phase, which is advantageous for the currency pair.
Fundamentally, the outlook is favorable for both the GBP & CAD, given the ongoing depreciation of the dollar. During the current corrective phase, the pair is testing support levels without the potential for further downward movement. This correction is likely to conclude with a false breakdown and subsequent consolidation above the support level, within the established channel. If the bulls manage to maintain defense above the 1.8144 - 1.8230 range, the uptrend is expected to resume.
Key support levels: 1.8150, 1.7978
Key resistance levels: 1.8233, 1.8379
Given the prevailing uptrend, the relative strength of the currency pair amidst a weak dollar, and the occurrence of a false breakdown at support, it is reasonable to conclude that downward price movement is unlikely. Therefore, it is prudent to consider potential continuation of the uptrend.

GBPCAD - Is Bullish Breakout Ahead?TF: 4h
GBPCAD is initiating along opportunity by completing 4th intermediate wave at 1.83464 . We can expect a retracement then reversal with near the lower trendline of the parallel channel.
Once price comes down, we will have the opportunity to go long with minimum stop level at low of the wave 4 at 1.83640 . The bullish scenario is capable GBPCAD to provide 1.8654 - 1.8748 targets to the buyers.
If the breakdown occurs, wave (4) will go deep. We update this chart time to time. Traders should only buy after a clear reversal.

GBPCAD SHORT IDEA Key highlights
After price took out the liquidity on buyside in 4hr timeframe , now I'm expecting price to out the liquidity on sellside

GBPCAD Sell Trade opportunity GBPCAD Sell Trade opportunity
its recent breakout major support line is a good opportunity to sell here or retracement some pips as I mentioned in chart

GBPCAD BUYING OPPORTUNITYWe can see thar the GBPCAD is an uptrend and it has broke its structure . Now we can wait for price to come back to the 1.61100 level for a buying opportunity .
ONLY FOR EDUCATIONAL PURPOSE

GBPCAD ANALYSIS OVER H1 CHART.GBPCAD continues falling down and looking for more selling opportunities in GBPCAD, PROPER MONEY MANAGEMENT SUGGESTED.


GBPCADThe market has reversed from strong weekly support in 4 hrs. we took this trade so soon because of some candlestick pattern in the higher timeframe. If stop hits then we will look for another entry.

LOOKING FOR SELLS ON GBP/CAD Looking at gap/cad we can see that on the long term trend we can see we have been in a range for around a year we can see this on weekly and daily
chart so now we can see we have taken out some liquidty at the top side and we do have a gap on the currency pair which is lower around the 1.68900 but firstly we have to break the 1.72 level I do think we will at least go down to the 1.72 area if broken our next target can be 1.70 then after that we can target the lower gap on the currency pair
We do think that the bullish run in gbp pairs could be over for a bit as we have seen. most gbp pairs fly up from the start of the year I do know believe we can see a pullback meaning all gbp pairs could sell off and out of all of them I think gbp/cad is looking to be like a really nice sell so lets wait and see during the week I will look for a sell down to the 1.72 region
TARGETS :
1.72 = key level of support
1.69 = gap fill currency
I will be looking for sells from a better price

GBP/CAD - BUY ZONE 1.73000-1.73100 - BUYS CONTIUATION Looking to buy gc from the region of interest
Can see gc has been looking to push higher to minor resistance we could see one more correction to our buy zone there is a candle imbalance I will be looking at buying at this point
Confluences on buys on GBP/CAD
1. In consoldation but it looks to go higher overtime looking at minor resistance as a target
2. 78% - could come back into this region orders have been Collected in the past
3. S1- intraday 20/01/20
4. orders in this area
5. ma's looking bullish
reasons for targets (TAKE PROFIT)
1. -0.50
2. r2 intraday
3. close to minor resistance
4. APM maxed out
BUY LIMIT - 1.73000-1.73100
STOP LOSS - 1.72950
TAKE PROFIT -1.74100
RISK TO REWARD 1:7
DO NOT ENTER THIS TRADE IF WE BREAK BELOW OUR STOP LOSS THIS TRADE WILL BECOME INVALID
( PRICE CAN GO STRAIGHT UP SO WE MIGHT GO TO TP BEFORE OUR ORDER GETS FILLED)


SELL GBPCAD TRIANGLE IS SPOTTED!!We have a triangle pattern formation in GBPCAD daily chart and if our strategy rules are satisfied then we will take a short here for target of 1.73300.
THIS CAN BE A GREAT OPPORTUNITY!! DON'T MISS IT :)


Don't miss the great sell opportunity in GBPCADTrading suggestion:
. There is still a possibility of temporary retracement to suggested resistance line (1.7125). if so, traders can set orders based on Price Action and expect to reach short-term targets.
Technical analysis:
. GBPCAD is in a range bound and the beginning of downtrend is expected.
. The price is below the 21-Day WEMA which acts as a dynamic resistance.
. The RSI is at 42.
Take Profits:
TP1= @ 1.6958
TP2= @ 1.6635
TP3= @ 1.5874
SL: Break Above R2

Breakdown from Ascending Broadening WedgeGBPCAD after retracing 38.2% of the 6th May to 12th august trend has now fallen below the ascending broadening wedge pattern, which makes it vulnerable to selling up to 1.60690. The stop loss for the trade will be above the high of the previous session i.e. at 1.63747.
