GBP/JPY 4H Chart Analysis – Bullish Channel Setup📈 Trend:
Price is moving in an ascending channel
🔵 Support line below
🔴 Resistance line above
---
Key Zones & Levels:
📍 Demand Zone (Buy Area):
Between 191.753 – 194.016
Price might bounce here before continuing up
🔵 Likely pullback expected here
🎯 Target Point:
202.500
🚀 If price respects the demand zone, this is the upside target
🟢 Entry Point:
Around 193.964 – 194.016
Optimal buying zone before the projected rise
❌ Stop Loss:
Below 191.700
🛑 Placed to minimize losses if price breaks down
---
Indicators:
📉 EMA (70):
Currently at 192.816
✅ Acting as dynamic support
---
Trade Plan Summary:
🔄 Wait for a retracement into the Demand Zone
🛒 Enter long near 193.964
⛔ Stop loss at 191.700
🎯 Target at 202.500
Gbpjpyidea

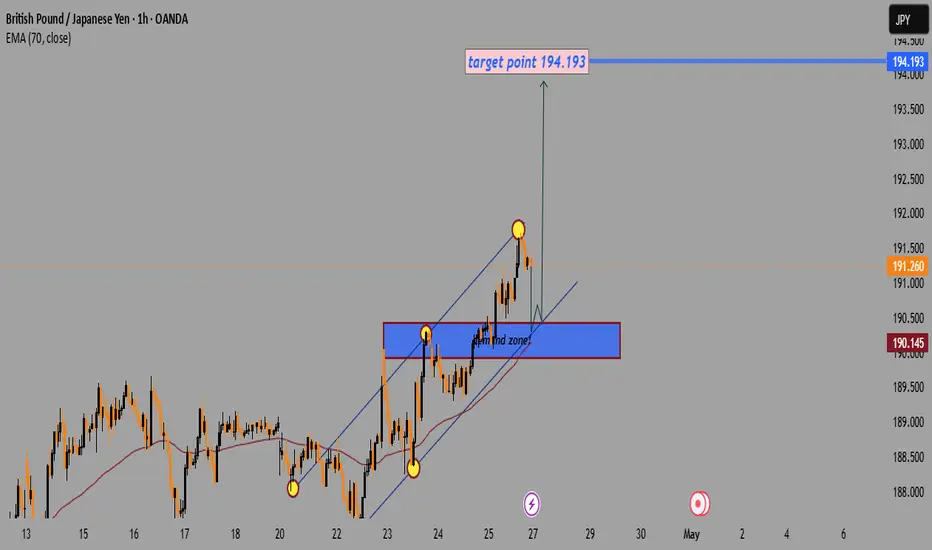
GBP/JPY Bullish Setup:Targeting194.193 After Demand Zone RetestTrend:
📈 Uptrend inside a rising channel (blue lines).
Key Zones:
🟦 Demand Zone: Between 190.400 - 190.700.
🧲 Acts as strong support where buyers previously stepped in.
Indicators:
📉 EMA 70 at 190.145 (below price) → bullish support.
Price Action:
📍 Current price: Around 191.260.
🔥 Recently touched upper channel resistance and pulled back slightly.
Target:
🎯 Target Point: 194.193.
Scenario:
🔄 Expecting a small pullback towards the demand zone or channel support.
🚀 Then a bullish continuation towards the target (194.193).
Risk Warning:
⚠️ If the price breaks below the demand zone and EMA, the bullish idea might be invalid.
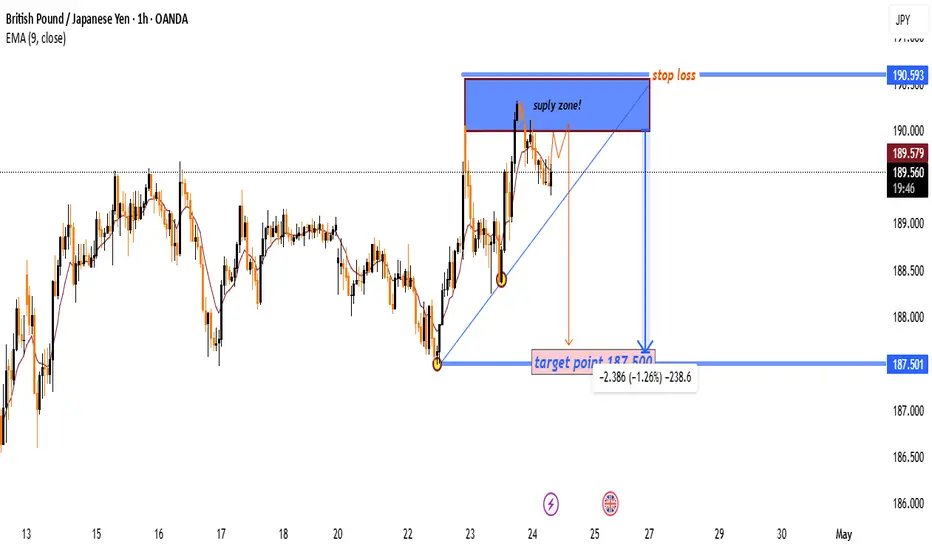
“GBP/JPY Supply Zone Short Setup – Precision Entry with 1:2 R:R!Strategy: Short/Sell Setup
🔵 Current Price: 189.536
📉 Trend Bias: Bearish setup forming
🔷 SUPPLY ZONE (Sell Area)
📍 Zone: 190.000 – 190.593
🟦 Marked in blue on the chart
⚠️ Sellers likely to step in here!
🔺 Action:
Enter SELL here if rejection confirms
🔴 Bearish candles / wicks are key signals.
🔸 STOP LOSS 🔸
❌ Above supply zone:
📍 190.593
🛡️ Protects against false breakouts.
🎯 TARGET POINT 🎯
📍 187.501
💰 Strong support zone
✅ Risk:Reward ≈ 1:2+
📊 Price Movement Projection
🔵 Dotted trendline shows rising support
⚠️ A break of this could trigger the drop
⬇️ Potential fall from supply zone to target
📌 Summary:
* 🔼 Wait for price to test supply zone
* ⏳ Confirm rejection
* 🔽 Target: 187.501
* 🛑 SL: 190.593
* ✅ High R:R setup!
GBP/JPY Bearish Reversal Setup–Eyeing Breakdown from Supply Zone1. Supply Zone (Resistance Area) 🟦 Supply Zone:
Located around 189.500–190.000
🔺 Price got rejected here multiple times — strong selling pressure.
2. Ascending Trendline Support
📈 Trendline connecting higher lows (marked with yellow dots)
🟡 Support tested multiple times, acting as a rising wedge structure.
3. EMA (7) — Exponential Moving Average
⚫️ EMA (black line) is currently near price — indicating short-term trend stalling.
4. Bearish Breakout Setup
🔻 Anticipated price drop shown with red/orange arrows
📉 If price breaks below trendline:
🎯 Target Point: 186.600
⬇️ Expected drop: ~1.51%
5. Price Movement Outlook
🔁 Possible minor pullback before breakdown
⛔️ Bearish signal increases if the trendline fails.
Summary (with emojis):
📍 Entry Idea: Short near resistance zone (189.500–190.000)
⛓ Trigger: Break of trendline support
🎯 Target: 186.600
⚠️ Stop-loss: Above 190.000 (above supply zone)

GBPJPY - TRADING WITHIN TRAINGLE PATTERN FORMATIONSymbol - GBPJPY
The GBPJPY is currently trading within a symmetrical triangle pattern and recently experienced an attempt to breach resistance levels and rise. However, the momentum has proven insufficient, as market participants remain skeptical of any bullish movement, primarily due to the actions of the Bank of Japan. The Bank of Japan recently increased its interest rate by 0.25%, marking the highest level since 2008, in response to accelerating inflation and a slowing economy. The central bank has signaled that further rate hikes are possible if inflation continues to rise.
From a fundamental perspective, this could lead to a potential decline in the GBPJPY currency pair, although the strength of the British Pound against the US Dollar may mitigate this effect. Technically, the recent attempt to break resistance appears to be a false breakout, with the medium-term outlook influenced by both the technical structure and the Bank of Japan's actions.
Key resistance level: 195.00
Key support levels: 192.00, 190.50
It is possible that another attempt to test resistance will occur before a subsequent decline. Traders are increasingly building long positions on the Japanese Yen, which could result in a bearish correction for the currency pair.

GBPJPY BUY SETUP R:R 1:5This is short term Trade
Wait for Marked demand zone.
Wait for CHoCH in LTF
Then Enter with the LTF OB.
Please do your own research before entering the trade.

GBPJPY SHOWING A GOOD UPWARD MOVE WITH 1:10 RISK XAUUSD SHOWING A UPWARD MOVE WITH 1:10 RISK REWARD
DUE TO THESE REASON
A. its following a rectangle pattern that stocked the market
which preventing the market to move any one direction now it trying to break the strong resistant lable
B. after the break of this rectangle it will boost the market potential for break
C. also its resisting from a strong neckline the neckline also got weeker ald the price is ready to break in the outer region
all of these reason are indicating the same thing its ready for breakout BREAKOUT trading are follws good risk reward
please dont use more than one percentage of your capitalfollow risk reward and tradeing rules
that will help you to to become a bettertrader
thank you

GBPJPY SHOWING A GOOD D UP MOVE WITH 1:10 RISK REWARD GBPJPY SHOWING A GOOD D
UP MOVE WITH 1:10 RISK REWARD
DUE TO THESE REASON
A. its following a rectangle pattern that stocked the market
which preventing the market to move any one direction now it trying to break the strong resistant lable
B. after the break of this rectangle it will boost the market potential for break
C. also its resisting from a strong neckline the neckline also got weeker ald the price is ready to break in the outer region
all of these reason are indicating the same thing its ready for breakout BREAKOUT trading are follws good risk reward
please dont use more than one percentage of your capitalfollow risk reward and tradeing rules
that will help you to to become a bettertrader
thank you

GBPJPYDear traders,
As I have been accustomed to in recent months and this time my technical analysis had an accuracy rate of over 95% and I will try to continue to keep this percentage as long as possible
As i said last weeks ... as I said a few weeks ago GJ made the 700 pips we announced and rejected from the target area number 1
Now, I expect a period of range and a retest of the trend line but at the first close even on 1 day below area 148 I will enter SELL until area 142
THIS WEEK...as I said in the last months ... GJ closes lower and lower and makes a range between my number 1 target and the trend line ...
I will try to trade in this area until closing even for 1 day above or below the area and then I will reanalyze the whole strategy
NOTE: Please, give a LIKE if you find this idea useful!
GREAT ATTENTION:
*This information is not a Financial Advice.

GBPJPYDear traders,
As I have been accustomed to in recent months and this time my technical analysis had an accuracy rate of over 95% and I will try to continue to keep this percentage as long as possible
As i said last weeks ... GJ rejected and closed the month below the trend line as I said and has already made 400 pips from the 700-1000 forecasted a few weeks ago!
...as I said a few weeks ago GJ made the 700 pips we announced and rejected from the target area number 1
Now, I expect a period of range and a retest of the trend line but at the first close even on 1 day below area 148 I will enter SELL until area 142
THIS WEEK..GJ retested thetargetr 1 area that I expect to pierce in the next period!
However... any closing even for 1 day under 148,500 will make me open another SELL up to the target area 2!
NOTE: Please, give a LIKE if you find this idea useful!
GREAT ATTENTION:
*This information is not a Financial Advice.

GBPJPYDear traders,
As I have been accustomed to in recent months and this time my technical analysis had an accuracy rate of over 95% and I will try to continue to keep this percentage as long as possible
As i said last weeks ... GJ rejected and closed the month below the trend line as I said and has already made 400 pips from the 700-1000 forecasted a few weeks ago!
THIS WEEK...as I said a few weeks ago GJ made the 700 pips we announced and rejected from the target area number 1
Now, I expect a period of range and a retest of the trend line but at the first close even on 1 day below area 148 I will enter SELL until area 142
NOTE: Please, give a LIKE if you find this idea useful!
GREAT ATTENTION:
*This information is not a Financial Advice.

GBPJPYDear traders,
As I have been accustomed to in recent months and this time my technical analysis had an accuracy rate of over 95% and I will try to continue to keep this percentage as long as possible
As i said last weeks .... GJ has reached the trend line and strongly rejected ... which I still look forward to.
Even if he can make another range, I expect GJ to go down the steps to area 148 ... and from there I'll reanalyze!
THIS WEEK...GJ has already made 50% of the descent we were waiting for!
Even if it will probably retest the trend line ... my target for the next period remains 148,400
NOTE: Please, give a LIKE if you find this idea useful!
GREAT ATTENTION:
*This information is not a Financial Advice.


GBP/JPY SELL FROM 1.42 REGION - SHORT TERM SELLLooking at shorting GJ from current price when markets open looking at price action we can see that we have hit a point of resistance wed haven't broken this zone since 13th jan not only that every time we come into this area of 1.42100-1.42200 we start to see bearish price action showing this level of resistance could hold once more but you have to remember that we are in a strong uptrend so this trade would be going against the trend but its worth the shot as the risk to reward is around 1:8
we can see that we have been in a bit of consoldation recently for the past two weeks my general outlook on gj is still bullish but this move here could catch around 100+ to the downside
Reasons for sells
1. daily closure Friday bearish
2. weekly 200m respected
3. At the top of the range/at a strong level of resistance
SELL FROM OPEN WAIT FOR 11PM
ENTRY : 142.000
STOP LOSS 142.150 (15PIPS)
TAKE PROFIT 1 141.000 (100 PIPS)
TAKE PROFIT 2 140.400 (170 pips)
Looking at the overall trend of gj is bullish which means this is counter trend trade use only 1% of account balance
Trade at your own risk

GBPJPY Top-Down AnalysisHello Traders,
Here is the Top-Down Analysis of GBPJPY (Monthly, Weekly, Daily for direction and 4H for entry) for
Week 44 - 26 Oct
M > Market is respecting downward resistance trend-line. Price faced rejection at resistance level and moved down. Price dropped to complete W formation.
W > We saw an M formation and expected price to rise up to test the neck as our target. However price reversed short of our target from 0.5 Fib level on last bearish impulse.
D > Price is unable to break daily supply zone it created while dropping to create M formation. Neck of M is on top of supply zone where price is getting rejected at its lower end itself. Price made another attempt but faced rejection, created a double top. However price is also not able to break next supply zone now turned demand zone. Price is moving in a range of about 200 pips for past 4 weeks. We can look at targets after price breaks out from this range.
As per COT GBP saw addition of Long and closure of Short positions further improving net positions though still in -ve. BXY however weakened during the said week and ended last week in a Doji after strong buying pressure during start of the week. JPY saw closure of Long and addition of major Short positions reducing net positions further however N-R added few Long and closed major Short positions. JXY during the said week ended in a Doji but improved its position last week.
We must note that in month of June and July BXY made all bullish move while having negative net positions, this ride was because of weak DXY and not due to strength of BXY. Hence we expect a realtime correction to the downside soon for all GBP pairs.
4H > Price is dropping after facing rejection from supply zone. We will monitor price action for breakout from current range.
Currency Correlation > Price has positive correlation with GBPUSD, GBPCHF, GBPCAD, CADJPY and EURJPY and negative correlation with EURGBP.
This was my Idea and I hope you find it useful. If you find the analysis of help please leave a LIKE and FOLLOW for receiving all updates during the week. In the comment section share your view or ask questions.
Thank You
AP17FX

GBPJPY SHORT TRADE SETUPThe 4-hour turning down with a bearish sequence against the 6/05/2020 highs at 139.74. The 1 hour is turning down against 134.69. While below there expect the pair to extend lower.
Sell GBPJPY
@134.45-60
TP: 133.70-50
SL: 135.00
Good luck
