GNFC - second breakout GNFC - first entry was after the trendline breakout
the second entry is now - if it sustains above 735.
Plan your trade.
Always Have SL.
Gnfclong

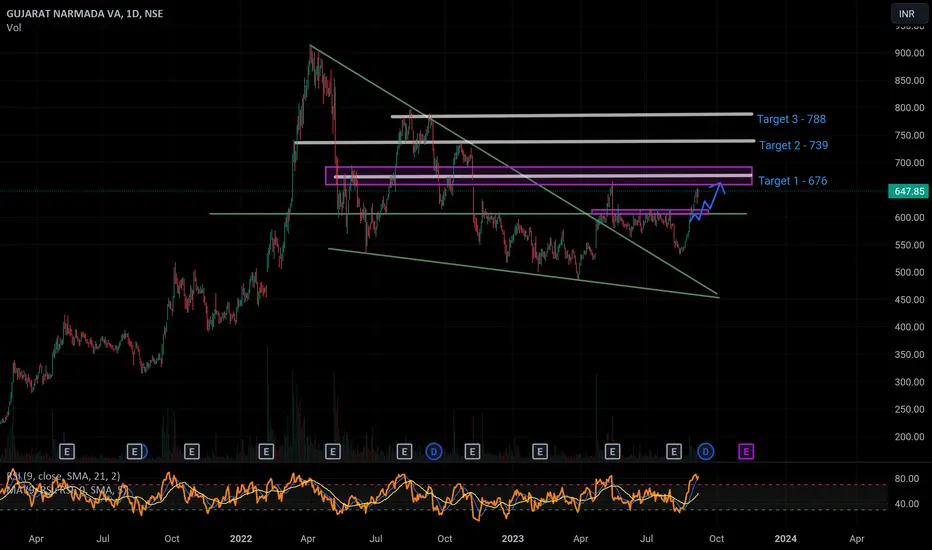
Bullish view on GNFCGNFC has formed a bullish pattern on a daily chart, using 1 Day Chart frame and have a mention 3 Target. Target 1 should be achieve in a month and Target 2 , 3 in following 2-3 months. T1- 686, T2-738, T3-788 and keep your stop loss at SL-610.
GNFC Falling Wedge Pattern Breakout on Weekly ChartGNFC has coming good buying volume, expecting a good returns in short term. Also it should be seasonal stock as monsoon is coming. Good Rally ahead, keep a watch or enter into CMP with stoploss 580

GNFCStrengths -
Strong Annual EPS Growth
Effectively using its capital to generate profit - RoCE improving in last 2 years
Effectively using Shareholders fund - Return on equity (ROE) improving since last 2 year
Efficient in managing Assets to generate Profits - ROA improving since last 2 year
Growth in Net Profit with increasing Profit Margin (QoQ)
Company with No Debt
Strong cash generating ability from core business - Improving Cash Flow from operation for last 2 years
Annual Net Profits improving for last 2 years
Book Value per share Improving for last 2 years
Company with Zero Promoter Pledge
Tiredness -
Decline in Quarterly Net Profit with falling Profit Margin (YoY)
Declining Net Cash Flow : Companies not able to generate net cash
Recent Results: Declining Operating Profit Margin and Net Profits (YoY)
Happiness -
Companies with current TTM PE Ratio less than 3 Year, 5 Year and 10 Year PE
Stock with Low PE (PE < = 10)

GNFCCan go long in GNFC above the resistance zone i.e. 598 to 609 and RSI to clear 30 in daily time frame

GNFC Fresh Breakout SeenGujarat Narmada Fertilizers (GNFC) NSE has Seen Triangle Pattern breakout on the Daily and 4-Hourly Charts. We are Buying NSE: GNFC in Cash Segment at 780 For the Targets of 830 And Stoploss of 759.
Reasons To Buy GNFC:
# Stock Today is trading in Momentum is trading up 2.8% at 783
# On the breakout Candle Volume is on the Higher Side.
# Stock Today Sustaining Above 61.8% Fibonacci Level.

GNFC MONTHLY CHART ANALYSISGNFC Monthly chart show is very strong, the share monthly candle breakout in the level of 550, and share out of the buyer range now the share is pullback and come to breakout level, the price is show in the support this is very simple chart, but most of the people not see, my view 550 stoploss is good for entry

GNFC - Long viewKindly refer chart
The price has moved out of its support levels and one could expect the levels of 900 over a period of time, hence would place this for a long term view.
On the shorter front we could look at this from an intraday point of view and look for the immediate targets of 620 levels

Long gnfc in daily time frameLong gnfc in daily time frame...
Two support collide.....
One is trendline other is fibb level 0.618

Simple Trade Setup | GNFC | 26-04-2022 [INTRADAY]NSE:GNFC
Observations:
1) On 1day time frame, it finally gave breakdown of the range.
Please refer below chart : 1day time frame.
-------------------------------------
Trade Setup for 26-04-2022
1) Don't Jump in to trade at the beginning of the market. Let it get settle for 15-20min first and judge the price action.
2) Everything is mentioned on the chart. I hope it is easy to understand.
3) All the levels will work as support, resistance, entry and exit w.r.t price action near that level.
4) Avoid gap up or gap down chase. Wait and trade between levels.
Please refer below chart for levels.
Hope I made it easy to understand it.
Do comment your doubt or suggestion.
Note: Trade with Strict SL. It may or may not hit all the levels. So one can book profit / loss at respective level considering how price action works near that level.

GNFC - Long term potential multibaggerChart is self explanatory. Entry, Targets and Stop Loss are mentioned on the chart.
Disclaimer: This is for demonstration and educational purpose only. This is not buying or selling recommendations. I am not SEBI registered. Please consult your financial advisor before taking any trade.

GNFC - Follow up on previous post
Chart is self explanatory. Entry, Targets and Stop Loss are mentioned on the chart.
Disclaimer: This is for demonstration and educational purpose only. This is not buying or selling recommendations. I am not SEBI registered. Please consult your financial advisor before taking any trade.
This is follow-up on GNFC. Can check link to related ideas we are now reaching Target 3.

Triangle breakout in GNFCIf we look at the daily timeframe for GNFC , we can clearly see there is a triangle breakout with good volumes. The breakout has come almost after 4 months of consolidation inside the triangle. After the breakout, there has been a small consolidation which is really healthy for the stock. At any given day, the stock can gain momentum and rise now. It is also near to the psychological level of Rs 500. Once the stock gives closing above Rs 500 in the daily candle closing, we can see a good move. We can easily aim for 5% - 10% returns from the stock.
Do like it :) It will motivate me to write more

GNFC BULLISH SETUPGNFC BULLISH SETUP : reverse candle with above average volume and good fundamentals, FII increased stake.

GUJARAT NARMADA VA
Target:- 600
Stop Loss:- 377
Duration:- 10 to 12 Weeks
The stock has already touch the support line and showing a bullish candle, which is an indication of upside move, so we can buy this at market order. This is basically rectangle pattern. Use proper stop loss and maintain discipline throughout the trading period and use trailing stop below all the wave.

Go Long On GNFC
Looking good pattern.
Good to go long with small risk NSE:GNFC
Good Flag and pole breakout is seen.
Good target ahead.

Perfect breakout - GNFC 225 is crucial !Price beautifully traded in between the trend lines and made a symmetric triangle pattern. Today breakout was expected and it breaks from the triangle. Target price given and it may take few days to reach, if buyers exhausted and price falls below 215 then the above is invalid.
It is hard to share all my analysis, tradingview is restricting 10 analysis for a day. When I am done for the day I am unable to proceed further and this is why these charts are not posted before the break.
