GODREJ CONSUMER PRODUCTS – Price Action + ZonesGODREJ CONSUMER PRODUCTS – Price Action + Zones
Ticker: NSE\:GODREJCP | Sector: FMCG
Timeframe: 15-Min | Current Price: ₹1,259.00 ▼ (−0.08%)
Technical View:⭐⭐⭐⭐ | Chart Setup: Range Bound Structure with Demand Zone Revisit in Focus
Godrej Consumer Products (NSE\:GODREJCP) is currently trading within a well-defined short-term range, with resistance capped near ₹1,265.50 and an anchored demand zone around ₹1,224.40–₹1,216.90. The stock has shown prior strength with a breakout above ₹1,244.35, but price is now consolidating between the orange mid-range and red supply zone, reflecting indecision. A clean zone-based structure is visible: the Top Range (₹1,265.50) may trigger bullish momentum if breached with volume, while failure to sustain may invite short setups within the range. The mid-structure zone (₹1,244.35) acts as a trend filter, while the green Demand Zone provides a case study for risk-managed entries — with example SL at ₹1,215.75 and mapped risk of ₹8.65. The Bottom Range (₹1,202.20) defines a lower band, and annotations like “Trade as per Trend + Supporting Setup” guide the learner to wait for trend + confluence. This setup is ideal for understanding how price reacts at key zones, how to frame directional bias within ranges, and how demand zones aid structured trade planning with logical stop-loss levels.
---
⚠️ **Disclaimer & Educational Note**
This content is strictly intended for educational and research purposes related to the technical study of Godrej Consumer Products (NSE\:GODREJCP). I am not a SEBI-registered advisor, and no buy/sell recommendations are being made. All insights are based on personal chart analysis, price-action interpretation, and educational zone-mapping — not financial advice.
📘 The visual setup in this post demonstrates how traders and learners can study breakout structures, demand/supply zones, price-volume behavior, and risk levels in a controlled technical environment. Tools like support/resistance mapping, volume confirmation, and structure-based SL planning help illustrate disciplined trade preparation. However, trading — particularly in leveraged instruments like options or intraday setups — involves substantial risk, and losses can exceed the initial investment.
👉 Always do your own due diligence and consult a SEBI-registered investment advisor before taking any positions in the market.
👉 Practice strict risk management, and only trade with capital you can afford to lose.
The author assumes no responsibility for financial decisions based on this educational content. By engaging with this content, you acknowledge and accept these terms.
---
💬 **Found this helpful?**
Drop your thoughts, questions, or insights in the comments below ⬇️ — let’s learn together!
🔁 Share this post with your trading friends and community — help them discover clean charts, structured setups, and zone-based learning.
✅ Follow **simpletradewithpatience** for clear setups, educational content, and a no-nonsense approach to price action, supply-demand zones, and risk-managed trades.
🚀 *Trade with patience. Trust your charts. Stay clear-headed.*
Because the goal is not just to trade — it's to trade better.
**Be Self-Reliant | Trade with Patience | Learn with Charts & Zones 📊**
---
GODREJCP

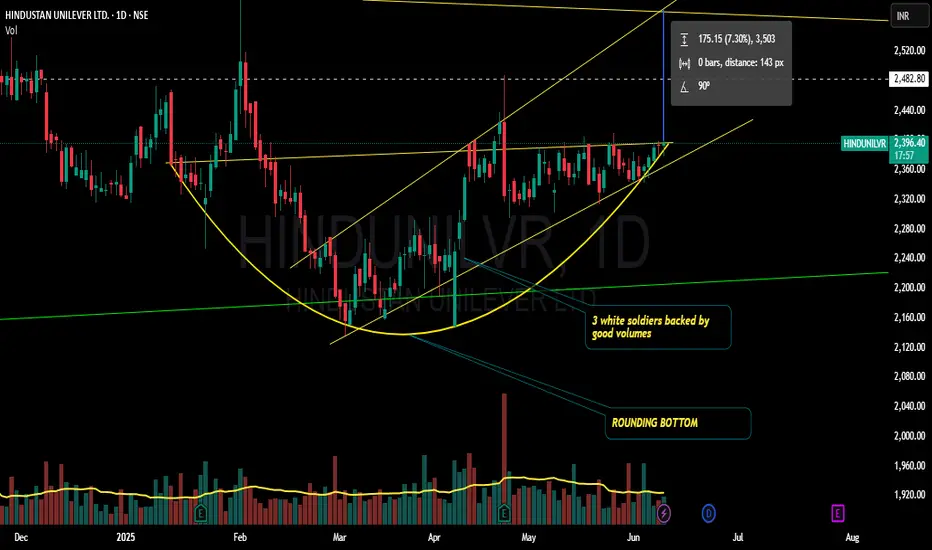
Hindunilvr longing for a breakout??!!Chart patterns inflict me the above titled opinion
Breakout can be expected as it has not breached the low made on 25th april 2025 and has been consistently making higher highs and higher lows(seen clearly on hourly charts)
Entry after the breakout.. ...
Godrejcp also seen for a up move!!!!
will update once it breaks out!!!!
Thank you.
This is just my opinion...not a advice!!!!
Godrej Consumer Product now abv weekly pivot#GodrejCP a renowned consumer product company from Godrej group, is now abv weekly pivot and well poised for 1340/1400/1460 CMP 1244. SL seems bit lower at 1200 on closing basis.

GODREJCP : Morning Star Pattern at SupportGodrej Consumer Products has given breakout near 1100 and now it is retesting its level and making a Morning Star Candlestick Pattern on Support this is a good sign for a stock.
There is a Saying in stock market "Retest Stocks are the best Stock" ... if it will follow this proverb we can get a good profit with Trailing Stop-loss..
All data is available in public domain..
CMP : 1140
TG : near ATH
SL : Doji's low
Stock's selection based on 5 Point Analysis:
1: Idea : Breakout Retest.
2: Support : Volume, Delivery .
3: Technical : Morning Star Candlestick Patter at support.
4: Fundamental : PE, PAT, Industry & peer PE and sector performance.
5: Timing : Entry Timing on Daily chart.
Disclaimer : It is my personal view as a trader and for educational purpose only. Equity market involves risk .
Please consult your financial adviser before taking any decision.

GODREJCP | Trendline Breakout Expected ⭕️ Swing Trading opportunity: Price Action Analysis Alert !!!⭕️
💡FNO Stocks Trading📉📈📊
✅Check out my TradingView profile to see how we analyze charts and execute trades.
✅We can't conduct a thorough analysis in such a short span of time. We need to review it, post our findings, and then take action.
🙋♀️🙋♂️If you have any questions about this stock, feel free to reach out to me.
📍📌Thank you for exploring our idea! We hope you found it valuable.
🙏FLLOW for more !
👍LIKE if useful !
✍️COMMENT Below your view !

GODREJCPNote:
1. Views are personal and for educational purposes only. Recheck and take the trade as per your RR.
2. Always remember SL is your lifeline, not the big target...
3. Follow us for more patterns and like, share so that we feel it is helpful to many and share more patterns...
3. Views given here is not a tip rather it is for educational purpose... Aftermarket opens, the condition might change so learn to handle different conditions...
Keep an eye ladies and gentlemen. Cheers and Happy Trading

GODREJCP CUP N HANDLE PATTERNGodrej Consumer Products Limited is an Indian Multinational consumer goods company based in Mumbai, India. GCPL's products include soap, hair colourants, toiletries and liquid detergents.
It is one of leading FMCG firms in india as well as globally, their range of product mainly covers shampoo, hair colours, grooming kits.
1.5 billion people globally use Godrej products from soaps and hair care to home care and health every day.
We recently identify a cup n handle pattern in Godrej consumer products.
CMP: 1315
SL : 1270
T1 : 1390
T2. : 1400
T3 : 1440
Note : It is recommendation it is only for educational purpose

GODREJCP📈 GODREJCP🚀
🔍 Breakout Stock 📈
📦 Darvas Box Formation✨
📈 Trading near All-Time Highs 🌟
📈 Huge Volume Buildup 💼
🚀 Keep on radar for targets: 1370/1500/1650/1740++
🛑 SL: 1280
Disclaimer: For Educational purposes only.

PNC Infratech bullish with cup and handle!While It can be visible from its all-time high to now, a cup and handle with a deeper cup is formed on the PNC Infratech chart. It is giving a sense of bullish momentum.
I have combined charts of Godrej Consumer Products with it as when you see its chart as individual, you will see both these charts seem similar in pattern. As it has happened with Godrej Consumer products it is now in uncharted territory after this pattern, it may happen the same with PNC Infratech as well.

Nifty FMCGList of stocks in Nifty FMCG
Britannia Industries Ltd
Colgate Palmolive Ltd
Dabur India Ltd
Emami Ltd
Godrej Consumer Products Ltd
Hindustan Unilever Ltd
Itc Ltd
Jubilant Foodworks Ltd
Marico Ltd
Nestle India Ltd
Procter Gamble Health Ltd
Tata Consumer Products Ltd
United Breweries Ltd
United Spirits Ltd
Varun Beverages Ltd
Disclaimer: This analysis is for educational purposes only, and I'm not a SEBI registered analyst.
If you found this analysis helpful, I encourage you to like and share it. Your observations and comments are also welcomed below. Your support, likes, follows, and comments motivate me to consistently share valuable insights with you.
🔍 More Analysis & Trade Setups 🔍
For more technical analysis and trade setups, make sure to follow me on TradingView: www.tradingview.com

GODREJCP TRENDLINE BREAKOUTGODREJCP breaking #resistance #trendline
with huge volume and good rsi
trading above key ema
immediate #target 1100
educational idea

Godrej Consumer Product : trend continuation.NSE:GODREJCP
Minor range breakout is done and yesterday's candle closed bullish just below the resistance zone.
Breakout above 1048.50 can take a price around 1070 and above that 1100+.
Stop should be maintained below this doji bar @1026
Keep on radar.
Always trade with stoploss.
Keep Learning,
Happy trading.

buy sideresistance breakout based trade
buy for targer range 1006-1013
stop as per comfort
disclaimer - trade @ own risk

GODREJCP Possible tradeAnalysis in weekly time frame.
Took support nearly at 1000 . and making a neutral candlestick.
Now if crosses 1047, High possibility to reach near latest swing high at 1100 and 1150.
And if crosses 1000, then possibility to reach near horizontal support near 950 or trend line support.
And if it breaks or crosses the triangle the we can see the level of 1300 in coming few weeks.

Weekly chart looks good for investmentGodrej consumer showing a good pattern on the weekly timeframe for Long.
Above 810 can go for long with SL 764.

GODREJCP - Ichimoku Bullish Breakout Stock Name - Godrej Consumer Products Limited
Ichimoku Cloud Setup :
1). Today's close is above the Conversion Line
2). Future Kumo is Turning Bullish
3). Chikou span is slanting upwards
All these parameters are showing bullishness at Current Market Price
and more bullishness AFTER crossing 1052
#This is not Buy and Sell recommendation to any one. This is for education purpose and a helping hand to learn trading in Market.
# Cloud Trading
# Ichimoku Cloud
# Ichimoku Followers
I hope you all like my analysis.
Please do share your thoughts into comment section.
Please give a like, share & subscribe for daily analysis.

godrejcp rising wedge for bearish 1. rising wedge
2.trendline breakdown
3. expected to form abcd harmonic pattern
4.trail sl for good results

Godrej Consumer looks great on weekly and daily, Buy
Weekly chart - C wave (long term) is positive, As is the Daily Chart
Breaking out and then pulling back into support. Buy at support levels of 930-920 for target of 1000 + (3 ATR) in 3-5 weeks time
Keep stop below - 1 ATR (14 day ATR) around 900 levels. Ideally buy call spreads for April on this

GODREJCP- Bull Trap to Breakdown SELL!Attached: Daily Live Market Chart as of 25th April 2023
Price put in a Breakout and turned out to be a False Breakout triggering a Rising Wedge Breakdown instead
Targets mentioned in Chart, Stop Loss as per Risk Appetite or today's High

GODREJCP - 35% RETURNS!!!BUY - GODREJ CONSUMER PRODUCTS
CMP - Rs. 967
Target - 1: Rs. 1066
Target - 2: Rs. 1132
Target - 3: Rs. 1312
.
.
Technicals - Ascending Triangle Breakout
.
.
Follow me for more!

Godrej CP on the verge of a Weekly breakoutWeekly chart breakout seen in GodrejCP. Target can be around 1000.

GODREJCPGODREJCP:- Ascending triangle pattern has formed, wait for a proper breakout, till then keep an eye on the stock
Hello traders,
As always, simple and neat charts so everyone can understand and not make it too complicated.
rest details mentioned in the chart.
will be posting more such ideas like this. Until that, like share and follow :)
check my other ideas to get to know about all the successful trades based on price action.
Thanks,
Ajay.
keep learning and keep earning.

Godrej ConsumerProducts- Near to Strong resistanceGodrej Consumer product is tending to break its long term triple top resistance .Also a short term cup and handle formation happened. So upward movement is sure .
