GOLD 4H. Looking bullish 1825-1850 easily possible.
Reasons:
1. Rsi at oversold condition.
2. There's a abcd triangle pattern.
3. Gold is always precious.
Goldforecast

GOLD Trading IdeaOne could argue is that the period could be of distribution, but I think that gold is Bullish in the long term. As I have shared in previous chart, so this looks like another accumulation to me.

GOLD Triangle formationGOLD
Gold has crossed the major psychological level which is 1600.00
And currently trading at 1620.00 level
It has broke the triangle formation and reached the top side level of 1620.00
We can expect short term fall back towards 1606.00 level
From this level suitable long position may open at 1606.00
Take profit will be 1628.00
Stop lose may placed below 1597.00
Leave your valuable comments below

$Gold forming a cup movement.“The potential industrial fallout from coronavirus is already leading a number of governments to cut interest rates or add to easing activity, while the U.S. 10-year bond has been dipping in and out of negative territory. This is all positive for gold in a risk-averse environment, although by definition we cannot know for how long it will be before this outbreak is controlled,” O’Connell wrote on Wednesday.

XAUUSD Short Trade SetupGold is favored to remain in the cycle up from 8/16/2018 lows where the daily right side is up. A pullback to correct the cycle from the 8/16/2018 wave ((2)) lows ended wave ((4)) at 1447 on 11/12/19 where the 4 hour is turning up. The metal is favored ended ended a wave B at 1593 where the hourly is turning down to correct the cycle from the 1611 highs. While below 1593 it can see another swing lower in wave (2) to correct the cycle from the 1447 lows. While above the 11/12/19 lows the metal can continue higher in wave I toward the 1700-1750 area before it corrects the cycle from the 12/12/17 lows.

GOLD TRADE SETUP Gold is favored to remain in the cycle up from 8/16/2018 lows where the daily right side is up. A pullback to correct the cycle from the 8/16/2018 wave ((2)) lows ended wave ((4)) at 1447 on 11/12/19 where the 4 hour is turning up. The metal is favored ended correcting the cycle lower from the 1/7/20 highs at 1611 with the bounce to the 1588 highs where the hourly is turning down. While below there it can see another swing lower in wave (2) to correct the cycle from the 1447 lows. While above the 11/12/19 lows the metal can continue higher in wave I toward the 1700-1750 area before it corrects the cycle from the 12/12/17 lows.

GOLD SHORT TRADE SETUPGold is favored ended the cycle from 8/16/2018 lows where the daily right side is up in wave ((3)) at the 9/4/2019 highs at 1557 and a pullback to correct the cycle from the 8/16/2018 wave ((2)) lows ended wave ((4)) at 1446 on 11/12/19 where the 4 hour is turning up. While above there the metal can continue higher in wave I toward the 1700-1750 area before it corrects the cycle from the 12/12/17 lows.

Next $1600 Target could beWhen you see the 5 year moving average , this month will be a positive one .


Gold | Triangle pattern Triangle pattern observed in Gold. Pattern looks to be valid and the target comes at 1477.
1438 and 1382 are the trend defining levels and so conservatively, longs can be initiate beyond 1438.
(Disclaimer: Our charts and contents are just for the purpose of analysis, learning and general discussion. Do not consider these as trading tips or investment ideas. Trading in Stocks, Futures and Options carry risk and is not suitable for every investor. Hence it is important to do your own analysis before making any investment or trading decisions based on you personal circumstances and it is always better to take advice from professionals)

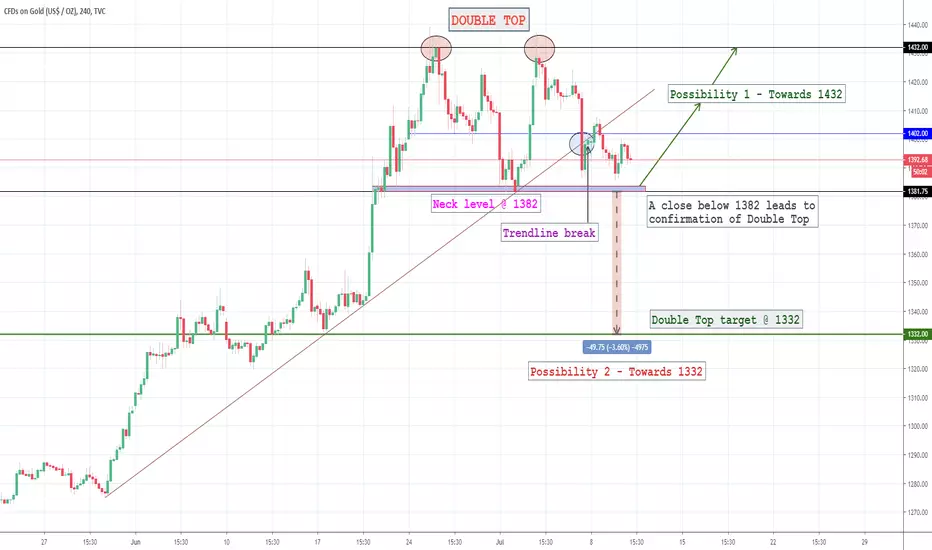
GOLD | Build Trade plan around 1382 - Short termDouble Top pattern spotted in Gold. Pattern will be confirmed IF PRICE CLOSES BELOW 1381.75. So shorts need to wait. Price would fall to 1332 as indicated by the pattern. 1382 acting as a support cannot be ruled out. Hence trades can be planned as below,
1. Long when price hit 1382 with stop below 1380 (or)
2. Short if price closes below 1381.75 with stop above 1385.
(Disclaimer: Our charts and contents are just for the purpose of analysis, learning and general discussion. Do not consider these as trading tips or investment ideas. Trading in Stocks, Futures and Options carry risk and is not suitable for every investor. Hence it is important to do your own analysis before making any investment or trading decisions based on you personal circumstances and it is always better to take advice from professionals)
Gold buyers exhausted, south direction to take prices at 1323.92The shiny metal went past the 1355 level on friday and on the same day reverted back to end the day on a negative note, which indicated that the buyers ran out of steam. Today, the prices breached the immediate intra - day support of 1337.88, which further supports the bears. Moreover, on daily basis, the prices are showing divergence with the RSI indicators, extending support to the bearish outlook for gold. I think the prices will touch the 1323.92 support before we can see any upwards movement in XAUUSD. on reaching this level RSI would also be at support of 60. If the prices break further below this level, next target will be at 1310.16.
