Gold (XAU/USD) Technical Analysis: SMC Trading point update
This chart is a technical analysis of Gold (XAU/USD) on a 4-hour timeframe. Here’s a breakdown
1. Ascending Channel:
The price is moving within an upward channel, showing a bullish trend.
Higher highs and higher lows confirm the uptrend.
2. Support and Resistance Zones:
Yellow Boxes: Key support zones where price previously consolidated before moving higher.
Red Arrows: Marking resistance zones where the price faced rejection.
Green Arrows: Indicating support levels where the price bounced.
3. Current Price Action:
Price recently dropped to a key support zone (around $3,050).
A bullish reaction is expected from this level.
If support holds, the price may continue the uptrend toward the target of $3,186.
4. Projected Move:
The black zigzag line suggests a potential bounce from support.
If the support level holds, price could move back up within the channel.
Mr SMC Trading point
Conclusion:
If price respects the support zone, there could be a good buying opportunity.
A break below the support zone would signal potential bearish movement.
Monitoring price action around the yellow zone is crucial for confirming direction.
Pales support boost 🚀 analysis follow )
Goldlong

XAUUSD 1 MIN SCALPING SETUP"We are looking at this area for a trade because:
Strong Support – Price has previously reacted here, suggesting buyers are stepping in.
Potential Supply Zone – If price moves back up, sellers might enter, making it a strong reaction point.
Quick Price Reaction – Small timeframes show sharp reversals, indicating this is an active zone.

GOLD MARKET – Early Asian Spike Meets Resistance Ahead of ADP🟡 GOLD MARKET UPDATE – Early Asian Spike Meets Resistance Ahead of ADP
Gold saw a strong early move during the Asian session, rallying back into the 313x zone — largely supported by consistent buying flow from Asian and Middle Eastern investors, as seen in the bullish momentum early in recent Asian sessions.
However, price quickly reacted to the key resistance zone at 3130–3135, which was highlighted in yesterday’s plan. With selling pressure reappearing at this level, my view remains to look for sell setups in both the Asian and London sessions if price retraces upward again.
📉 Technical Structure:
Gold is approaching the tip of a symmetrical triangle pattern, suggesting an imminent breakout.
→ As always: wait for the breakout, then trade the retest in the breakout direction.
📰 Fundamental Watch:
All eyes will be on tonight’s ADP Non-Farm Employment data from the U.S.
Expectations are fairly optimistic — if the data comes in near or better than forecast, this could strengthen the USD and push gold lower, aligning with my bearish view toward the 308x–307x target zone.
🧭 Key Levels to Watch:
🔺 Resistance: 3128 – 3135 – 3142 – 3148
🔻 Support: 3110 – 3100 – 3080 – 3070
🎯 Trade Setup:
🟢 BUY ZONE: 3102 – 3100
SL: 3096
TP: 3106 – 3110 – 3114 – 3118 – 3122 – 3126 – 3130
🔴 SELL ZONE: 3148 – 3150
SL: 3154
TP: 3144 – 3140 – 3136 – 3132 – 3128 – 3124 – 3120
📌 Caution: Watch out for increased volatility during the US session with ADP release.
In Asia and Europe, stick to the technical zones above and always manage your TP/SL properly to protect your capital.
Good luck, stay sharp.
— AD | Money Market Flow

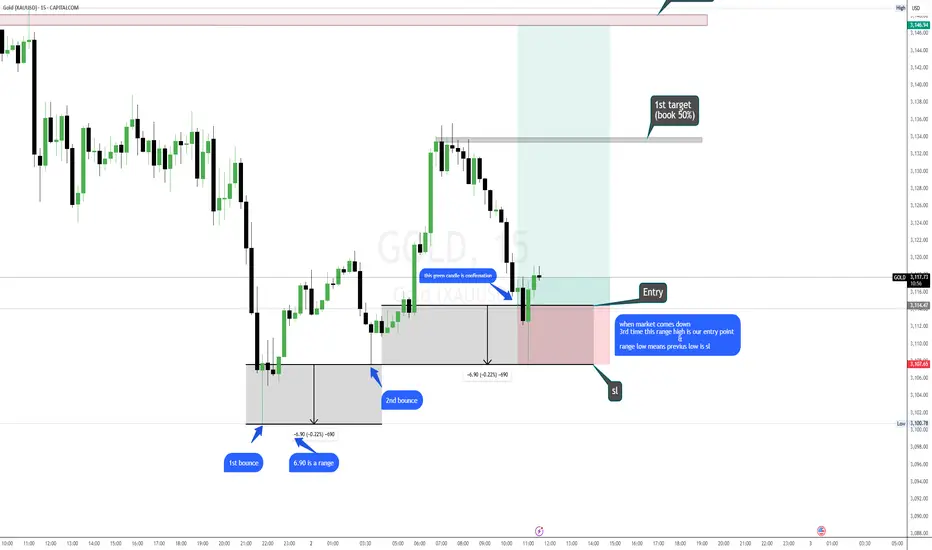
Gold view on 02 april (entry model explain in description)Hello
It's a jayesh balar.
in this entry model requirement in uptrend 2 lover high and down trend 2 highr low
in uptrend when market create 2 lover high then mark this two low and and find this gap range and then copy this range apd past 2nd low when market comes down next time touch this range high point and show some rejection you can enter and range low point is your SL same as a down trend.
(This model interesting point is this give unlimited time entry this model only failed when market try to shifting trend)
And my English was so bad so i know this description is not that much good so if you doubt anything you can comment your questions
If you have a any "Questions"
Ask me in comment
Gold Kicks Off April with a New ATH – Bulls Remain in Control Gold continued its explosive rally during the early Asian session today, printing yet another All-Time High (ATH) after retesting the 3,12x zone overnight.
The U.S. stock market reversed sharply higher in the New York session, and if this bullish momentum continues, gold could see a short-term pullback near current resistance before heading higher again.
However, if equities fail to hold and roll over, gold may push further into uncharted territory, eyeing extended targets around 315x – 317x.
📰 Macro Focus:
Investors seem to have interpreted Trump’s latest trade stance as more "measured" than previously feared.
In his latest comments, he signaled that “tariffs may play a smaller role in the overall economic strategy.”
This has calmed markets slightly but hasn’t slowed down the gold rush.
📈 Price Action & Outlook:
With current momentum and sentiment, gold still looks likely to print fresh ATHs this week.
The next major upside target sits around 316x – 318x, where we may finally see a significant pullback as FOMO cools down.
For now, watch the 312x – 311x zones for potential short setups at local resistance — as marked in AD’s key levels.
🧭 Key Technical Levels:
🔻 Support: 3133 – 3122 – 3111 – 3100
🔺 Resistance: 3158 – 3166 – 3172 – 3180
🎯 Trade Zones:
🟢 BUY ZONE: 3122 – 3120
SL: 3116
TP: 3126 – 3130 – 3134 – 3138 – 3142 – 3146 – 3150
🔴 SELL ZONE: 3170 – 3172
SL: 3176
TP: 3166 – 3162 – 3158 – 3152 – 3148 – 3144 – 3140
📊 What to Watch Today:
Investors will be closely watching ISM Manufacturing PMI and JOLTS Job Openings during the US session — expect volatility spikes.
As gold hovers near new ATHs, stay disciplined:
✅ Respect SL/TP
✅ Manage risk according to your account size
✅ Don’t get caught up in emotional trades
Wishing you a powerful and profitable start to the new month. Let’s flow smart.
— AD | Money Market Flow

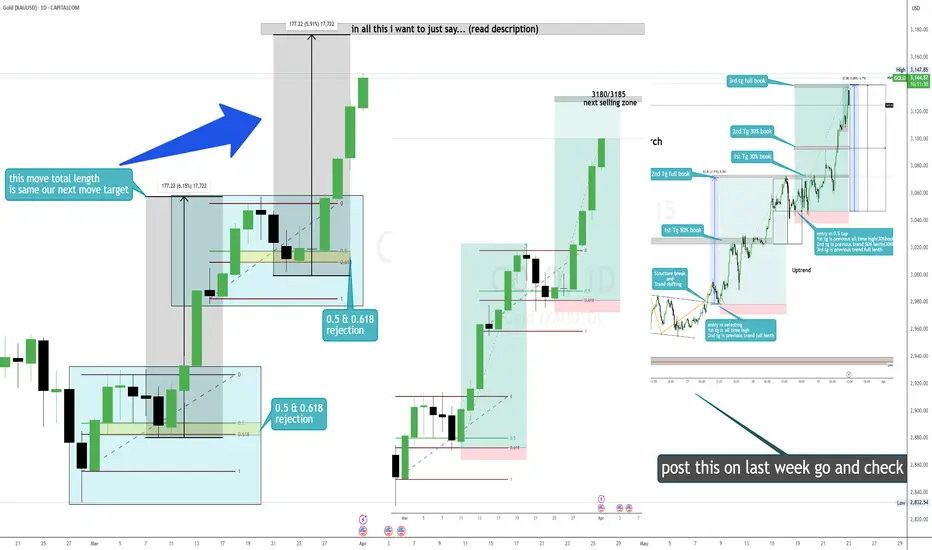
My gold target is 3177/3183 because(read description)Hello
It's a jayesh balar.
(this was not only i tell you after this happen i tell you this 3 4 days ago and gave a trade and all trade hit target)
my gold next target is 3177/3183 because if you see gold chart in 1day time frame in this bullish trend gold 25 to 28 feb trying to go down but its not happen and then you see next move 3 to 5 march move and consider as a swing and put fib and see market got rejection on 0.5/0.618 level and gave 177 point up move.
so as of you all know "MARKET ALLWAYS REPEAT HISTORY"
in this up trend next 14 to 19 march consider as a swing and put fib you see market still got rejection on 0.5/0.618 level so in this time our next target same as previous trade total move.
i am just trying to tell anyone say anything don't believe market is still bullish and continue his up trend so go with flow and grab this opportunities.
If you have a any "Questions"
Ask me in comment
If my analysis is helpful,
press booster bottom.
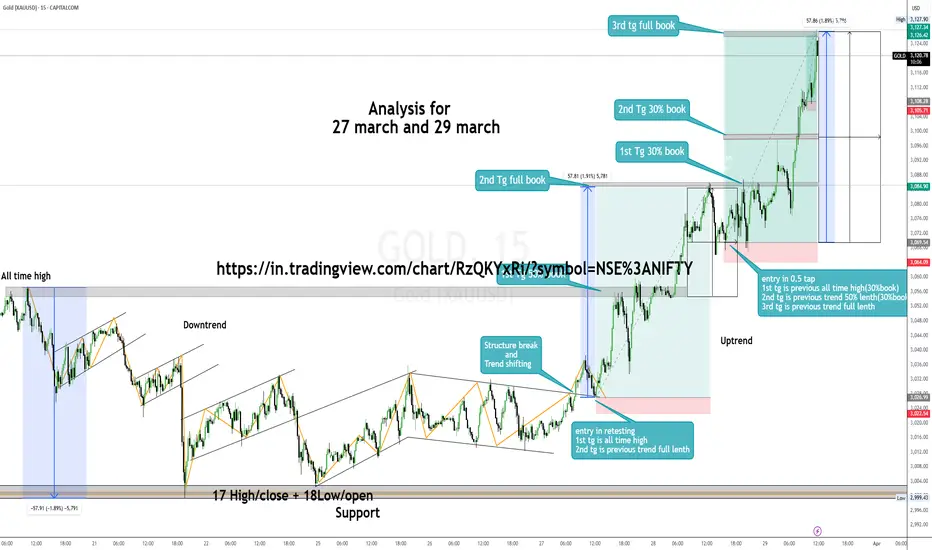
gold analysis all target hitt(check previous post)Hello
It's a jayesh balar.
If you have a any "Questions"
Ask me in comment
If my analysis is helpful,
press booster bottom.
Gold analysis 31=3-2025XAU/USD has broken out of its previous consolidation range, confirming strong bullish momentum. The earlier resistance has now turned into a demand zone, making it a key support area. A potential pullback to this zone could offer a buying opportunity before the next leg up. If the price holds above this area, further bullish movement is expected, pushing it toward new highs. The overall trend remains strong, and a successful retest of the new support would confirm continuation toward higher levels.

GOLD SURGE CONTINUES – FEAR, WAR & END-OF-MONTH VOLATILITYGold opened this week with a strong upside gap, once again reminding us of how unpredictable Mondays can be following highly volatile weekends.
As always, when the market gaps significantly after the weekend, it's best to wait for price to absorb the remaining volume before locking into new setups.
As mentioned in previous outlooks, the current BUY pressure is still high, driven by a global wave of FOMO and fear, caused by:
Rising geopolitical tensions,
Global economic instability,
And even natural disasters now hitting parts of Asia.
Asian stock markets dropped sharply this morning after weekend developments escalated — with the Russia–Ukraine war showing no signs of de-escalation. In fact, new reports suggest a broader regional impact, further boosting risk-off sentiment.
💡 Safe Haven Flows Are Back in Full Force
Right now, gold is the #1 asset investors are paying attention to.
It's being treated as the ultimate flight-to-safety amid global panic and uncertainty.
And with this momentum, new ATHs may still be ahead.
📅 End-of-Month Candle Close – Expect Whipsaws
Today also marks the final trading day of the month, meaning we could see aggressive stop hunts and liquidity sweeps as large players look to close their monthly books.
➡️ Be extra cautious today — sharp moves up or down may occur due to end-of-month positioning.
Whether BUY or SELL, it’s best to trade tight, scalp smart, and respect your SL/TP.
Key Levels for 01/04:
🔺 Resistance: 3116 – 3132
🔻 Support: 3092 – 3085 – 3076 – 3066
🎯 Trade Plan:
SELL ZONE: 3130 – 3132
SL: 3136
TP: 3125 – 3120 – 3115 – 3110 – 3105 – 3100
BUY ZONE: 3066 – 3064
SL: 3060
TP: 3070 – 3075 – 3080 – 3085 – 3090 – 3095 – 3100
Stay sharp and trade with discipline.
End-of-month volatility is not for the weak hands.
— AD | Money Market Flow

Is gold going to be eclipsed?
-------------------------
Timeframe: 240 Min
-------------------------
The price action suggests a completed impulse structure originating from the 2833 low, with gold now trading at an all-time high. Based on cluster zones and Fibonacci extensions, wave (5) still has the potential to extend toward the 3150-3200 range. This zone represents a key resistance level where buying momentum may slow down, signaling an impending shift in market dynamics.
Once wave (5) completes, it will mark the end of wave ((3)) of a higher degree, setting the stage for a corrective move. A retracement toward the previous wave (4) level is expected as wave ((4)) develops, aligning with historical corrective behavior after extended rallies. This phase will provide crucial insights into the market’s next major move. Stay tuned for further updates.

Gold silver update next Our Spot #Gold Range Prediction from 31/03/2025 to 04/04/2025 is as under.
Gold Spot : 3023$-3126$
Gold INR : 88100-91050
Our Spot #Silver Range prediction from 31/03/2025 to 04/04/2025 is as under.
Silver Spot: 33.44$-35.05$
Silver INR: 98400-103200
It must be remembered that price of precious metal depends on so many world wide factors like inflation, Fed interest rate, trade barrier, geopolitical tension, demand, supply, bond yield, dollar index , GDP, payroll data, CPI, currency fluctuation, debt ceiling , expected tax & duty changes, other commodity price crude oil etc. etc. and hence there can not be any accurate barometer of predicting precious metal price.
Gold INR has been calculated taking Gold Spot international price and converting the same assuming fixed Indian rupee rate. However, this is not accurate method as change in rupee value to dollar can substantially impact Gold INR price. Pl. note that price of commodity doesn't depend upon performence of company but depend upon performence of world economy, hence it is extremely risky to trade in commodities. Commodities market also become more volatile during contract expiry.
These are not a recommendation for buy or sell. This view is only for educational purpose. You are requested to consult your financial advisor before entering in to any trade.

GOLD - BULLISH STRUCTURE INTACTSymbol - XAUUSD
CMP - 3018
Gold is currently undergoing a corrective phase, having broken through channel resistance and is now consolidating above the downtrend line. Market participants are awaiting key economic data and potential developments in the ongoing tariff dispute.
President Trump has confirmed plans to implement retaliatory tariffs on April 2, with limited exemptions. These new duties have raised concerns regarding the impact on the US economy, leading to a weakening of the US dollar and increased demand for gold. Additionally, market attention remains focused on ongoing discussions between the US, Ukraine, and Russia. There is also significant focus on US durable goods orders data, as a strong reading could temper expectations of a Federal Reserve rate cut, potentially limiting further gains in gold.
Resistance levels: 3033, 3045, 3056
Support levels: 3013, 3004
Gold may test the support zone before resuming its upward movement. Market attention is concentrated on the current consolidation range of 3033 to 3013. A decisive break of this zone could pave the way for further upward momentum, with key resistance levels at 3045 and 3056.

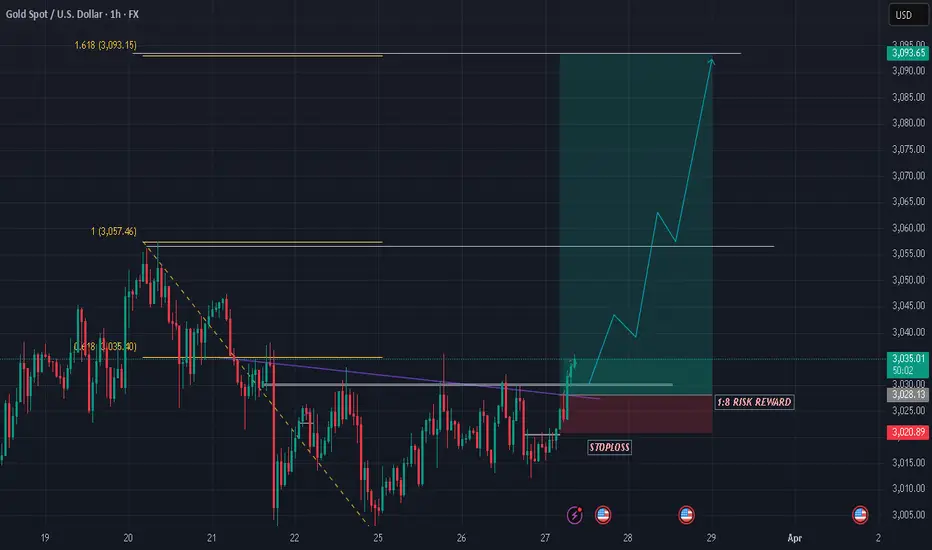
GOLD SHOWING A GOOD UP MOVE WITH 1:8 RISK REWARD GOLD SHOWING A GOOD UP MOVE WITH 1:8 RISK REWARD
DUE TO THESE REASON
A. its following a rectangle pattern that stocked the market
which preventing the market to move any one direction now it trying to break the strong resistant lable
B. after the break of this rectangle it will boost the market potential for break
C. also its resisting from a strong neckline the neckline also got weeker ald the price is ready to break in the outer region
all of these reason are indicating the same thing its ready for breakout BREAKOUT trading are follws good risk reward
please dont use more than one percentage of your capitalfollow risk reward and tradeing rules
that will help you to to become a bettertrader
thank you
Gold (XAUUSD) Going Parabolic ?The chart suggests that Gold (XAUUSD) has been rising steadily in the past year.
Gold in general acts as hedge against inflation and uncertainty.
There can be further upthrust due to some catalyst. In general one should not short a parabolic move prematurely as it can keep moving upwards. Only with defined signals one must try that. Shorting in general is very difficult. Nevertheless if one wants to trade a parabolic move, they can long it with a small position so that the risk reward is great. Commit only that much which you are ready to lose with appropriate stop loss.
What effects the price of Gold in general -
1. Geopolitical events - e.g.
Ukraine War
Gaza War
Tariff Wars
2. Dollar Index - Post election DXY rose steadily causing selloff in emerging markets. Though Gold fell initially but it steadied and started moving upwards later. Since gold correlates negatively in general with DXY, it's important to keep a tab on it.
3. Demand and supply of physical gold.
Buying and selling by Central Banks around the world
Mining output
Demand by consumers
4. Monetary policies of Central Banks of USA, China, Japan etc
5. Trading in derivatives
PS - This is not an exhaustive list of course.
So in order to understand and speculate on Gold one must have an updated macro view and chart reading capacity.
Trade Safe

XAU/USD PLAN VIEW – PREPARE FOR THE FOMC STORM!📊 This week, all eyes are on the FOMC meeting on March 19, where the Fed will announce its interest rate decision and economic outlook. Gold remains bullish but is now approaching key resistance zones, which could lead to a short-term correction before determining its next direction.
⚠ Important Note: The following PLAN VIEW applies before the FOMC meeting. Once we approach the event, traders should consider closing positions to protect their accounts, as extreme volatility is expected when the news is released.
🔥 Fundamental Analysis – What’s at Stake in This FOMC?
📌 1️⃣ Fed Expected to Hold Rates at 4.25% - 4.5% but…
The Dot Plot & Summary of Economic Projections (SEP) will guide the market’s expectations.
If the Fed maintains a hawkish stance, the USD may strengthen, pressuring gold.
If the Fed signals a dovish shift, the USD could weaken, pushing gold higher.
📌 2️⃣ Central Banks Are Still Buying Gold
China, Russia, Poland, and India continue stockpiling gold, reducing dependence on the USD.
This ongoing trend supports gold’s long-term bullish momentum, despite possible short-term pullbacks.
Technical Analysis – XAU/USD Key Levels
🔹 Primary Trend: Bullish, but facing strong resistance.
🔹 Price Channel: Gold remains within an uptrend, though a short-term pullback is possible.
📌 Key Levels to Watch:
📍 Resistance:
3,055 - 3,071 – If gold faces rejection here, a correction could follow.
📍 Support:
3,021 - 3,009 – A key area to watch if a pullback occurs.
2,986 - 2,948 (FVG Zone H1) – Deeper liquidity levels if selling pressure increases.
🎯 PLAN VIEW – BEFORE FOMC
BUY ZONE: 3010 - 3008
SL: 3004
TP: 3015 - 3020 - 3024 - 3028 - 3032
ELL ZONE: 3054 - 3056
SL: 3060
TP: 3050 - 3046 - 3042 - 3038 - 3030
⚠ Key Warning:
As we approach FOMC, consider closing all positions to avoid unnecessary risks, as the market reaction can be highly unpredictable.
🔥 A storm is coming with the FOMC – trade smart and protect your capital! 🚀

Gold uptrend movement expected , may hit upto 3022/3040 Symbol Gold or XAUUSD
Timeframe 30 Minutes
Analysis uptrend movement pole flag pattern creation.
Expected targets is 3022/ 3040
We hope our analysis is adding value to your trading journey.
Please note: Published ideas are for educational purposes only. Trade at your own risk.
Also, please respect the risk - stop loss (SL) should not be more than 2% of the capital.
DISCLAIMER: We are not SEBI registered. All the videos uploaded in this channel are solely for educational purposes."

GOLD EA MAN UPDATE >READ THE CHAPTIAN Key Observations:
Support Zone: The price has respected the marked support area and is showing bullish momentum.
EMA Confluence: The price is currently below the 30 EMA (red), but if it crosses above, it could signal stronger bullish momentum.
Target Point: The projection anticipates a move towards 3,052.357, possibly after a minor pullback.
If price sustains above the 30 EMA and breaks through the minor resistance, your bullish target seems achievable. Are you already in a long position, or waiting for further confirmation?

XAU/USD | 4H | Elliott wave | Long for 3030-3070Gold is wave iv of wave (iii) of wave 5 as shown in chart.
Current wave 4 can be completed anywhere near 2980- 2955 Zone. 2955 if seen would be golden entry, but i am expecting reversal ( start of wave 5 ) before that due to highly bullish momentum.
Wait for reversal confirmation.
Sl would be low of wave 4 and target would 3030.
High probability trade. A perfect execution can be very rewarding. Look for MaCD, RSI and candle sticks patterns for reversal confirmation.
After 3030 wave (iv) of 5 may again take us to the low levels of wave iv of (iii) i.e., 2980-2955 zone before going to 3070+ levels.

GOLD TRADING POINT UPDATE > READ THE CHAPTIANBuddy'S dear friend 👋.
SMC Trading Signals Update 🗾🗺️ Gold Traders SMC-Trading Point update you on New technical analysis setup for Gold 🪙 Gold Traders Gold 1H time. Look 👀 first take FVG level that take entry buying said target point 2959 New ATH wait for FVG level good luck 🤞
Key Resistance level 2930 + 2959
Key Support level 2909 - 2902 - 2896
Mr SMC Trading point
Pales support boost 🚀 analysis follow)

GOLD HITS NEW ATH – IS $3,000 JUST THE BEGINNING?📌 Market Overview
Gold has soared to a new all-time high (ATH) following the latest inflation reports (CPI & PPI), confirming the market’s strong bullish sentiment. As expected, weak US economic data caused DXY to plunge to its lowest levels, further fueling gold’s upward momentum. Everything is aligning in favor of gold’s rally – up, up, up! 🚀
👉 Why is gold skyrocketing?
Investors are rushing to buy gold at record-high prices due to economic and political instability.
Former President Donald Trump’s policies are shaking market confidence, making gold the go-to safe-haven asset.
Until USD shows signs of a strong recovery, gold will remain the priority investment.
📊 Will Gold Break Beyond $3,000?
🔹 Short-term bullish outlook:
Asian & European sessions are expected to favor buying, as investors continue to pile into gold.
In the US session, profit-taking may trigger sharp pullbacks, especially as early buyers cash out at higher levels.
Being a Friday, the market could see large liquidations and volatility spikes.
📉 Key Technical Levels to Watch
🔺 Major Resistance: $3,000 - $3,019 - $3,039 - $3,052
🔻 Major Support: $2,978 - $2,967 - $2,942 - $2,918
🎯 Trading Plan for Today
🔴 SELL ZONE: $3,039 - $3,041
📍 SL: $3,045
🎯 TP: $3,035 - $3,030 - $3,025 - $3,020 - $3,015 - $3,010 - ???
🟢 BUY SCALP: $2,968 - $2,966
📍 SL: $2,962
🎯 TP: $2,972 - $2,976 - $2,980 - $2,985 - $2,990 - $3,000
🟢 BUY ZONE: $2,948 - $2,946
📍 SL: $2,942
🎯 TP: $2,952 - $2,956 - $2,960 - $2,965 - $2,970 - $2,980 - $3,000 - ???
⚡️ Final Thoughts – Caution Ahead!
📌 Despite the strong uptrend, today is Friday, and profit-taking could trigger sudden drops.
📌 Stick to TP/SL strategies to protect capital and avoid getting caught in sharp pullbacks.
📌 Watch for potential liquidations in the US session – big moves are possible!
💬 Do you think gold will push beyond $3,000, or are we in for a sharp correction? Drop your thoughts below! 🚀🔥

GOLD Long Side Chances BullishGOLD Chart long side opportunity. 🚀🚀
wait for close candel above the mark line.
MUST use sl as your risk for future trades in market

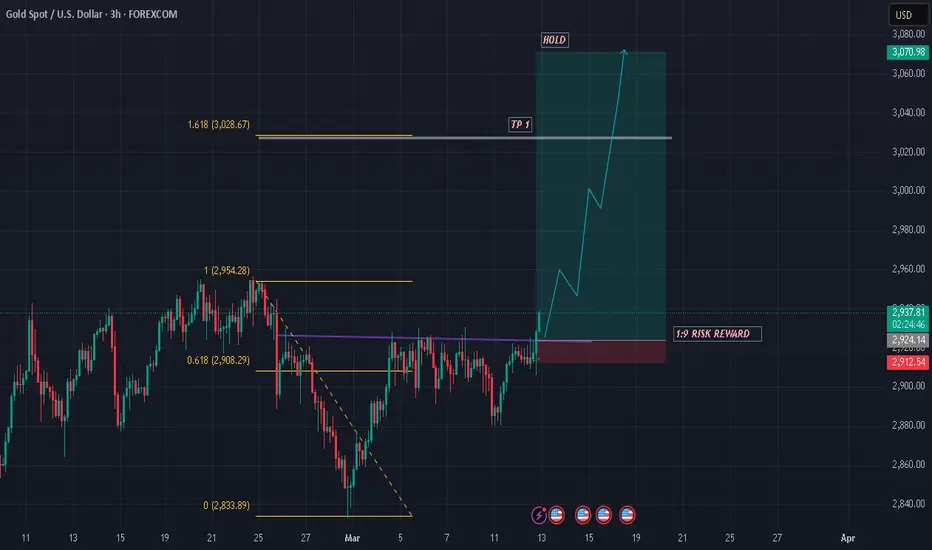
GOLD SHOWING A GOOD UP MOVE WITH 1:9 RISK REWARD GOLD SHOWING A GOOD UP MOVE WITH 1:9RISK REWARD
DUE TO THESE REASON
A. its following a rectangle pattern that stocked the market
which preventing the market to move any one direction now it trying to break the strong resistant lable
B. after the break of this rectangle it will boost the market potential for break
C. also its resisting from a strong neckline the neckline also got weeker ald the price is ready to break in the outer region
all of these reason are indicating the same thing its ready for breakout BREAKOUT trading are follws good risk reward
please dont use more than one percentage of your capitalfollow risk reward and tradeing rules
that will help you to to become a bettertrader
thank you
GOLD VIEW 3H READ THE CAPTAINHello 👋 gold traders
3-hour timeframe of Gold Spot (XAU/USD) with technical analysis levels and moving averages. Here’s a breakdown of the key points:
Key Observations:
1. Support & Resistance Levels:
Support Level: Around 2,909.870 - 2,902.340 (marked as the buying zone).
Resistance Level: 2,930.173.
Target Point: 2,960.607.
2. Exponential Moving Averages (EMAs):
30 EMA (Red Line): 2,909.870 (Short-term trend).
200 EMA (Blue Line): 2,884.578 (Long-term trend, acting as strong support).
3. Price Action:
The price is currently in a consolidation phase around the resistance zone.
If the price breaks above 2,930, we might see a bullish move toward the target at 2,960.
If the price fails to break resistance, a pullback to the buying zone (support level at 2,909-2,902) is possible.
Trading Strategy Ideas:
Bullish Scenario (Breakout Above 2,930): Look for long positions targeting 2,960.
Bearish Scenario (Rejection at Resistance): A retest of the buying zone (2,909 - 2,902) before another push higher.
