XAUUSD - Flag PatternWhats your take on Guys.
#Institutions Consolidation going on - #Accumulation or #Distribution.
Kind of #Triangle #pattern in formation, ##Flagpattern. DO your analysis, Enter trade on Breakout and confirmation side. Trade with #confluence. i would say accumulate at bottom of pattern with SL and Participate in full swing before #Breakout.
Goldlong

GOLD – Breakout / Swept High – Where to BUY?1. Market Overview
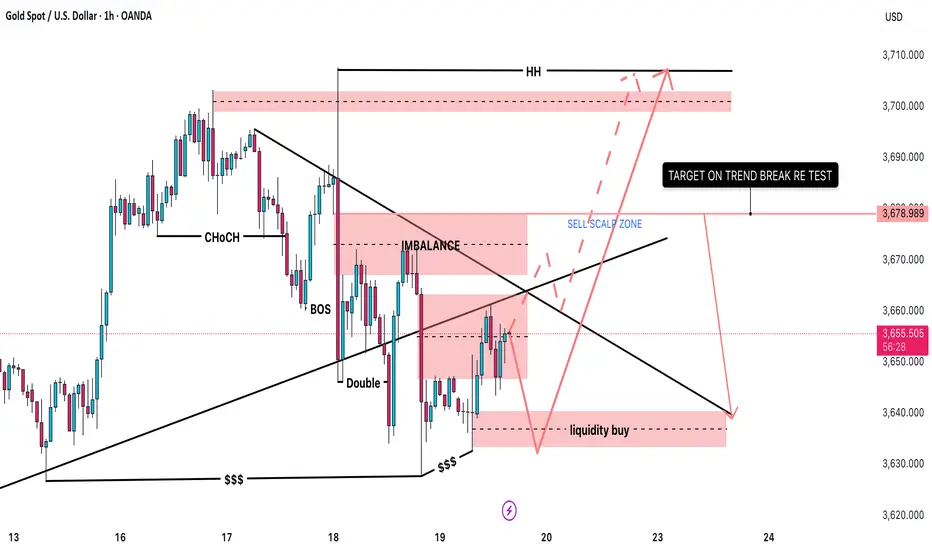
Gold prices are consolidating around 3655 – 3660 after showing a short-term bearish structure.
On the H1 chart, we can see clear supply and demand zones:
• Liquidity Buy Zone near 3640 (potential demand area).
• Imbalance / Supply Zone around 3670 – 3680.
The broader higher-timeframe trend is still bullish, but in the near term the market is retesting liquidity levels.
________________________________________
2. Key Levels & Zones
• Liquidity Buy Zone: 3640 – 3645 → important support.
• Sell Scalp Zone / Imbalance: 3670 – 3680 → short-term resistance.
• Higher High Target (HH): 3700 – 3710 → strong higher-timeframe resistance.
• Long-term Support: 3620 – 3630.
________________________________________
3. Main Trading Scenarios
🟢 Long Setup (with trend)
• Wait for price to revisit the Liquidity Buy Zone (3640 – 3645).
• If bullish reversal signals appear (pin bar, engulfing candle, etc.), consider entering a Long position.
🎯 Targets:
• Short-term: 3678 (trendline break retest).
• Mid-term: 3700 – 3710 (higher high).
🔴 Short Setup (scalp only)
• If price pushes into the Sell Scalp Zone (3670 – 3680) and faces strong rejection → take a Short scalp.
• 🎯 Target: 3640 – 3645.
⚠ Note: Shorts go against the main bullish trend, so they should be managed quickly and not held for long.
________________________________________
4. Trade Management Notes
• Focus on Long trades near support, as higher timeframe bias is still bullish.
• Short positions should only be taken as scalp setups near resistance.
• Risk control: limit risk to 1–2% per trade, avoid holding trades against the main trend.
________________________________________
📌 Conclusion
Gold (XAUUSD) is currently testing the descending trendline and resistance zone.
• A successful breakout may lead price towards 3700+.
• Otherwise, the market is likely to dip back into 3640 before starting the next bullish leg.

GOLD - Breakout / Swept High appear - Where to BUY ? 🟡 OANDA:XAUUSD XAUUSD Daily Plan – September 19, 2025
1. Market Overview
Price is consolidating around 3655 – 3660 after forming a short-term bearish structure.
On H1, several supply & demand zones are highlighted:
Liquidity Buy Zone around 3640 (potential demand).
Imbalance / Supply Zone around 3670 – 3680.
The overall higher-timeframe trend remains bullish, but in the short term, the market is retesting liquidity areas.
2. Key Levels & Zones
Liquidity Buy Zone: 3640 – 3645 → key support.
Sell Scalp Zone / Imbalance: 3670 – 3680 → short-term resistance.
Higher High Target (HH): 3700 – 3710 → strong higher-timeframe resistance.
Longer-term Support: 3620 – 3630.
3. Main Trading Scenarios
🟢 Long Setup (trend-aligned)
Wait for price to retest Liquidity Buy zone 3640 – 3645.
If reversal signals appear (pin bar, engulfing, etc.), consider opening Long.
Targets:
Short-term: 3678 (trendline break retest).
Mid-term: 3700 – 3710 (HH).
🔴 Short Setup (scalp only)
If price retraces into Sell Scalp Zone 3670 – 3680 and shows strong rejection → Short scalp opportunity.
Target: 3640 – 3645.
Note: Short trades are counter-trend, so manage quickly.
4. Trade Management Notes
Prioritize Longs from support zones since the higher-timeframe trend is still bullish.
Shorts should only be seen as short-term scalp opportunities near resistance.
Risk management: limit to 1–2% per trade, avoid holding against the main trend.
📌 Conclusion: XAUUSD is currently testing the descending trendline and resistance area. A successful breakout could target 3700+. Otherwise, the market is likely to revisit 3640 before launching the next bullish leg.
Gold Chart Analysis and Price PredictioinGold Chart Analysis and Price Prediction
The Gold Chart is seen to to making Cup and Handle pattern which indicates a bullish sign. Market completely absorbed FED interest cut decisions. Even though in the FED press meet he signed uncertainty in further anticipated rate cuts, Gold is showing bullish sign. A probable break out could be witness after 23 Sepetember'2025.

GOLD SHOWING A GOOD UP MOVE WITH 1:10 RISK REWARD GOLD SHOWING A GOOD UP MOVE WITH 1:10 RISK REWARD
DUE TO THESE REASON
A. its following a rectangle pattern that stocked the market
which preventing the market to move any one direction now it trying to break the strong resistant lable
B. after the break of this rectangle it will boost the market potential for break
C. also its resisting from a strong neckline the neckline also got weeker ald the price is ready to break in the outer region
all of these reason are indicating the same thing its ready for breakout BREAKOUT trading are follws good risk reward
please dont use more than one percentage of your capitalfollow risk reward and tradeing rules
that will help you to to become a bettertrader
thank you


Gold 1H – Retail Sales Impact Before FedOn the 1H chart, Gold is holding near 3,682 after showing a clear Break of Structure. Liquidity is now seen both above the premium resistance at 3,700 and below the Fair Value Gap demand around 3,669–3,667. With U.S. Retail Sales data due at 19:30 IST today, intraday volatility is expected, but overall positioning is still cautious ahead of the Federal Reserve’s interest rate decision later this week. Traders can look for liquidity sweeps towards premium levels before retracements into demand zones.
________________________________________
📌 Key Structure & Liquidity Zones (1H):
• 🔴 SELL ZONE 3,700 – 3,698 (SL 3,707): Premium resistance likely to trigger rejection towards 3,690 → 3,680 → 3,670.
• 🟢 FVG BUY ZONE 3,669 – 3,667 (SL 3,660): Fair Value Gap demand zone for retracements, targeting 3,680 → 3,690 → 3,700+.
• 🟢 BUY SUPPORT 3,641 – 3,639 (SL 3,632): Deep discount support, targeting 3,655 → 3,670 → 3,685+.
________________________________________
📊 Trading Ideas (Scenario-Based):
🔺 Buy Setup – FVG Reclaim (3,669–3,667)
• Entry: 3,669 – 3,667
• Stop Loss: 3,660
• Targets:
TP1: 3,680
TP2: 3,690
TP3: 3,700+
👉 Look for a liquidity sweep into the FVG zone before New York session begins.
🔺 Buy Setup – Discount Sweep (3,641–3,639)
• Entry: 3,641 – 3,639
• Stop Loss: 3,632
• Targets:
TP1: 3,655
TP2: 3,670
TP3: 3,685+
👉 A good risk-to-reward opportunity if price sweeps stops below structure before Retail Sales release.
🔻 Sell Setup – Premium Liquidity Run (3,700–3,698)
• Entry: 3,700 – 3,698
• Stop Loss: 3,707
• Targets:
TP1: 3,690
TP2: 3,680
TP3: 3,670
👉 Expect engineered stop-runs into premium supply before fading lower.
________________________________________
🔑 Strategy Note
While Retail Sales data may bring short-term price swings, market attention is focused on the Fed. Smart Money is likely to trap both sides of liquidity: fading premium near 3,700–3,698 while accumulating buys at 3,669–3,667 and 3,641–3,639. Trade with smaller positions and confirm with H1 closes before entries.

“XAU/USD 1H – Bullish Continuation from Demand Zone Key Observations:
Uptrend Structure:
Price has been consistently making Higher Highs (HH) and Higher Lows (HL), confirming an overall bullish market structure.
Break of Structure (BOS) levels confirm continuation of the trend.
Market Structure Shift (MSS):
Recently, price created a short-term shift downward (MSS) but retraced into a POI zone (demand area) near 3,646 – 3,659.
Current Setup:
The price bounced from the POI zone and is now recovering upward.
A long position was marked with entry near 3,659, Stop Loss at 3,646, and Target around 3,709.
Bias:
As long as price holds above 3,646 (POI zone), bullish continuation is favored.
If broken below 3,646, bearish correction could extend further.

Gold – Reversals to TrendsOur system thrives on dual strength — catching reversals at the turn and riding the trend that follows.
MCX:GOLDM1! has been the perfect example.
Precision entries on reversals, disciplined trailing on momentum.
This edge has delivered multiple double-digit “R” trades.
Risk stays small, reward compounds big.
That’s the power of rules executed with patience.

LiamTrading – XAUUSD: A New Trend EmergingHello traders, gold has just formed a new structure as it began a sharp correction following Chairman Powell’s announcement of a Fed rate cut. On the H1 chart, a clear bearish Dow structure is developing, indicating potential medium-term sustainability.
Most buy-side liquidity has already been cleared, which makes the chances of a strong recovery quite low – except for a brief FVG right after the news. However, given overall market sentiment, trading activity in that phase was not significant. The gap formation signals that sellers are now confident in taking control after the Fed’s statement.
The current decline could push gold towards the 363x region, and possibly as far as 361x. A key confirmation level remains at the strong support of 3651, where price previously bounced more than 20 dollars immediately after the news.
Trading plan for today:
Sell 3656 – 3659, SL 3666, TP 3651 – 3646 – 3638 – 3634 – 3626 – 3615
Buy 3634 – 3632, SL 3628, TP 3640 – 3652 – 3660
Buy zone 3607 – 3604, SL 3600, TP 3616 – 3625 – 3638 – 3647 – 3660
This is my personal outlook on XAUUSD for today – use it as a reference for your own trading decisions. If you find this analysis helpful, do follow me for more gold trading scenarios and daily insights.

Gold 1H – Fed Decision Looms After $3,700 BreakOn the 1H timeframe, Gold is consolidating around 3,675 after sweeping through the key $3,700 level. Price briefly touched 3,702 before retreating back into the 3,670s, showing engineered liquidity runs on both sides. With the Fed policy decision expected at 1 AM VN time, volatility is likely to spike. The market remains supported by easing USD, central bank flows, and geopolitical tensions, but short-term positioning indicates possible liquidity grabs before a clear directional move.
________________________________________
📌 Key Structure & Liquidity Zones (1H)
• 🔴 SELL SCALP 3,696 – 3,694 (SL 3,703)
Premium supply pocket for engineered rejection targeting 3,690 → 3,685 → 3,680.
• 🟢 FVG BUY ZONE 3,674 – 3,665 (SL 3,660)
Fair Value Gap demand zone for retracement into structure, targeting 3,685 → 3,695 → 3,700+.
• 🟢 BUY SUPPORT 3,636 – 3,638 (SL 3,630)
Deep discount accumulation zone targeting 3,655 → 3,670 → 3,680+.
________________________________________
📊 Trading Ideas (Scenario-Based)
🔺 Buy Setup – FVG Reclaim (3,674–3,665)
• Entry: 3,674 – 3,665
• Stop Loss: 3,660
• Take Profits:
o TP1: 3,685
o TP2: 3,695
o TP3: 3,700+
👉 Look for liquidity sweep into FVG before NY session/Fed.
🔺 Buy Setup – Deep Discount (3,636–3,638)
• Entry: 3,636 – 3,638
• Stop Loss: 3,630
• Take Profits:
o TP1: 3,655
o TP2: 3,670
o TP3: 3,680+
👉 High risk-to-reward setup if stops are hunted before Fed decision.
🔻 Sell Setup – Premium Trap (3,696–3,694)
• Entry: 3,696 – 3,694
• Stop Loss: 3,703
• Take Profits:
o TP1: 3,690
o TP2: 3,685
o TP3: 3,680
👉 Expect engineered stop-runs into premium before fading lower.
________________________________________
🔑 Strategy Note
Gold’s break above $3,700 highlights strong bullish sentiment, but the Fed decision risk suggests smart money may sweep liquidity both ways. Stay flexible: short from premium zone (3,696–3,694), and defend longs at demand zones (3,674–3,665 and 3,636–3,638). Use lighter position sizing until post-Fed clarity emerges.

FOMC XAUUSD: Time to Hold Super SELL before FOMC🟡 XAUUSD Daily Trading Plan – Ahead of FOMC
📊 Market Context
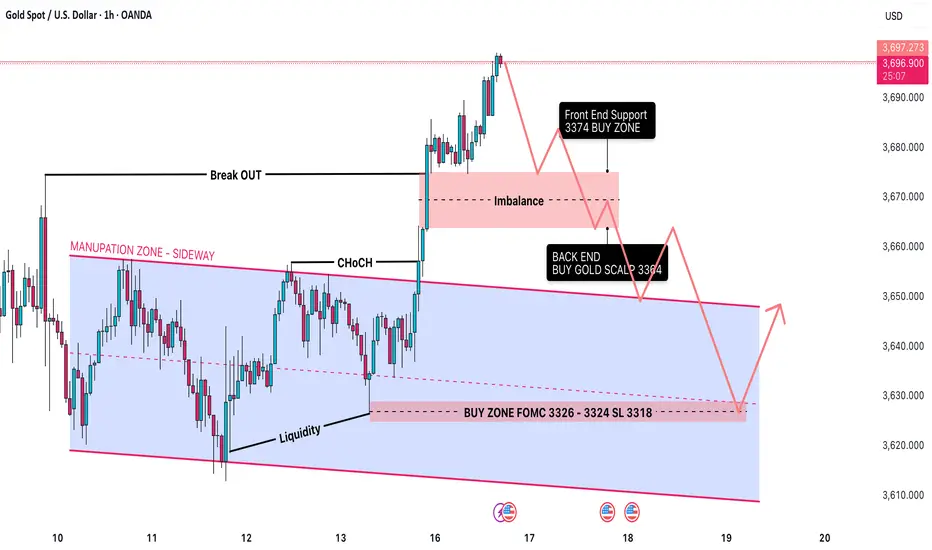
Gold (XAUUSD) has recently moved out of its accumulation/manipulation zone and is now trading in the 3,684–3,690 range.
The market structure is bullish after a Change of Character (CHoCH) followed by a Break of Structure (BOS).
Still, imbalances remain below the present price level, suggesting the possibility of a retracement before further upside continuation.
Liquidity pools are forming around 3,721–3,725, which increases the risk of false breakouts (liquidity traps) near the FOMC.
🔎 Technical Analysis (SMC Perspective)
Structure: Bullish bias on H1/H4, confirmed by higher highs and BOS.
Imbalance Zone: 3,674 → 3,664 (likely to be revisited).
Liquidity Pools:
Buy-side liquidity: 3,721–3,725 (Sell Zone).
Sell-side liquidity: 3,626–3,624 (Equal Low Zone).
🔑 Key Levels
Resistance / Sell Zones
3,686.88 (Immediate resistance)
3,721–3,725 (Liquidity Sell Zone)
Support / Buy Zones
3,668 (Front End Buy – imbalance retest)
3,656–3,654 (Back End CP Buy Zone)
3,626–3,624 (Equal Low Liquidity Zone)
✅ Priority Scenario – BUY
Entry 1
Buy Limit: 3,668 (Front End Zone – imbalance retest)
SL: 3,661
TP: 3,690 → 3,700 → 3,721
Entry 2
Buy Limit: 3,656–3,654 (Back End CP Buy Zone)
SL: 3,648
TP: 3,690 → 3,700 → 3,721
Entry 3
Buy Limit: 3,626–3,624 (Equal Low Liquidity)
SL: 3,618
TP: 3,690 → 3,700 → 3,721
🔻 Alternative Scenario – SELL (Counter-trade)
If the price touches 3,721–3,725 (Liquidity Zone) before revisiting the lower buy zones → look for rejection patterns.
Enter SELL if bearish confirmation appears.
SL: 3,730
TP: 3,698 → 3,690 → 3,676
⚠️ Risk Management & Notes
Expect high volatility during FOMC – liquidity traps are very likely.
Reduce lot size before the news release to minimise risk.
Take trades only with confirmation (avoid blind buys/sells).
Main directional bias: Bullish as long as 3,648 holds.
“Gold Shines Bright | Bullish Momentum Targeting $3,700🔎 Technical Analysis – XAU/USD (1H Chart)
Trend: Strong bullish trend confirmed, with price making higher highs and higher lows.
Buy Zone: Around 3,590 – 3,600 USD, where buyers stepped in aggressively.
Short-Term Target 🎯: 3,650 – 3,700 USD (already highlighted on chart).
Key Support Levels:
3,561 USD (near-term support)
3,490 USD (major support, bullish structure invalidation if broken)
📌 Outlook: As long as price holds above the buy zone, momentum favors bulls with potential continuation toward 3,700+ USD.
🌍 Fundamental Drivers for Gold Bullishness ✨
Federal Reserve Rate Cuts Expectations 🏦⬇️ – If the Fed signals easing or holds a dovish stance, real yields fall → Gold strengthens.
Weakening US Dollar (DXY) 💵📉 – A softer dollar makes gold more attractive to global investors.
Geopolitical Risks 🌍⚠️ – Rising global tensions increase demand for safe-haven assets like gold.
Central Bank Demand 🏦🔒 – Many central banks are adding gold reserves to hedge against currency risks.
Inflation Hedge 📊🔥 – Gold remains attractive when inflationary pressures stay elevated.

BTCUSD 4.5R sell side beautiful scenarioBTCUSD is in range from last 5 days but now it is showing Smart Money’s interest. And it appears a down side trade is being developed as it has swept upside liquidity and forming CISD after displacement.
1. It has taken upside liquidity.
2. Formed CISD after displacement.
3. It has formed FVG and BPR on 1h time frame and price is inside POI.
4. POI is created inside OTE zone confirming good RnR.
5. Most probably price will take liquidity of FVG and OTE zone and create MSS/TS in LTF.
6. Price should show rejection/reversal in LTF (5m,1m) at FVG zone.
All these combinations are signalling a high probability and 4.5R trade scenario.
Note – if you liked this analysis, please boost the idea so that other can also get benefit of it. Also follow me for notification for incoming ideas.
Also Feel free to comment if you have any input to share.
Disclaimer – This analysis is just for education purpose not any trading suggestion. Please take the trade at your own risk and with the discussion with your financial advisor.

Gold 1H – Breakout Liquidity Trap Ahead of ExpansionGold on the 1H timeframe is consolidating around 3,652 after sweeping discount liquidity and reclaiming structure. Price has tapped the breakout zone and is currently trading between the scalp supply in premium and the higher liquidity pools. The structure indicates engineered moves into 3,656–3,658 or deeper liquidity around 3,672–3,674 before the next expansion. Discount demand remains protected at 3,614–3,612.
________________________________________
📌 Key Structure & Liquidity Zones (1H):
• 🔴 SELL ZONE 3,672 – 3,674 (SL 3,679): Premium supply pocket for engineered rejection, targeting 3,660 → 3,650 → 3,640.
• 🔴 SELL SCALP 3,656 – 3,658 (SL 3,663): Short-term premium sweep zone for intraday liquidity grabs, targeting 3,645 → 3,640.
• 🟢 BUY ZONE 3,614 – 3,612 (SL 3,607): Discount demand block aligned with bullish order flow, targeting 3,630 → 3,640 → 3,655.
________________________________________
📊 Trading Ideas (Scenario-Based):
🔻 Sell Setup – Premium Scalp Rejection
• Entry: 3,656 – 3,658
• Stop Loss: 3,663
• Take Profits:
TP1: 3,645
TP2: 3,640
👉 Intraday scalp opportunity if price sweeps into shallow premium liquidity.
🔻 Sell Setup – Deeper Premium Sweep
• Entry: 3,672 – 3,674
• Stop Loss: 3,679
• Take Profits:
TP1: 3,660
TP2: 3,650
TP3: 3,640
👉 Expect an engineered sweep into higher premium before reversal.
🔺 Buy Setup – Discount Demand Reaction
• Entry: 3,614 – 3,612
• Stop Loss: 3,607
• Take Profits:
TP1: 3,630
TP2: 3,640
TP3: 3,655
👉 A high R:R trade if price retraces to the protected demand before expansion.
________________________________________
🔑 Strategy Note
Smart money is likely to manipulate both premium and discount zones near the breakout point. The directional bias favours:
• Scalp sells at 3,656–3,658
• Swing sells at 3,672–3,674
• Discount buys at 3,614–3,612
Strict risk management is essential — expect liquidity sweeps on both sides before the actual expansion.

Trading Analysis for Gold Spot / U.S. Dollar (15-Minute Chart)Buy XAU/USD now at 3644.00 level and hold at 3631.00 and target will be specific.
Entry Range 3642.00 to 3644.00
Take Profit 1 = 3646.00
Take Profit 2 = 3650.00
Take Profit 3 = 3654.00
Take Profit 4 = 3658.00
Stock Loss 3631.00
Key News Timings Chart Per.
i will try to update continue.

Gold 1H – Fed Week: Liquidity Sweeps Before FOMCGold on the 1H timeframe is range-bound around 3,643 after a series of ChoCH/BOS prints. Liquidity is stacked above the intraday buy zone at 3,658–3,656 and higher at 3,676–3,678, while discount liquidity sits near 3,615–3,613. With markets pricing a possible Fed cut this week and the dot-plot in focus, expect engineered spikes into premium followed by mean reversion before any sustained move.
________________________________________
📌 Key Structure & Liquidity Zones (1H):
• 🔴 SELL ZONE 3,676 – 3,678 (SL 3,683): Premium resistance for an engineered sweep/rejection targeting 3,665 → 3,655 → 3,645.
• 🟢 BUY ZONE 3,658 – 3,656 (SL 3,651): Intraday demand within prior consolidation targeting 3,665 → 3,670 → 3,675+.
• 🟢 BUY SUPPORT 3,615 – 3,613 (SL 3,610): Discount demand at the base of structure targeting 3,630 → 3,645 → 3,655+.
________________________________________
📊 Trading Ideas (Scenario-Based):
🔺 Buy Setup – Intraday Reclaim (3,658–3,656)
• Entry: 3,658 – 3,656
• Stop Loss: 3,651
• Take Profits:
TP1: 3,665
TP2: 3,670
TP3: 3,675+
👉 Look for a sweep into the zone and an H1 close back above 3,656 to confirm order-flow continuation.
🔺 Buy Setup – Deep Discount Sweep (3,615–3,613)
• Entry: 3,615 – 3,613
• Stop Loss: 3,610
• Take Profits:
TP1: 3,630
TP2: 3,645
TP3: 3,655+
👉 High R:R if liquidity runs into protected demand before the New York session.
🔻 Sell Setup – Premium Sweep to Resistance (3,676–3,678)
• Entry: 3,676 – 3,678
• Stop Loss: 3,683
• Take Profits:
TP1: 3,665
TP2: 3,655
TP3: 3,645
👉 Expect a stop-run above recent highs into premium; invalidate on a firm H1 close above 3,683.
________________________________________
🔑 Strategy Note
Into Fed week, smart money often runs both sides of the book. Bias today favours: discount buys at 3,658–3,656 and 3,615–3,613, and a premium fade at 3,676–3,678. Use reduced size, wait for structure confirmation, and avoid holding through any unexpected Fed headlines or USD spikes.

GOLD SHOWING A GOOD UP MOVE WITH 1:10 RISK REWARD GOLD SHOWING A GOOD UP MOVE WITH 1:10 RISK REWARD
DUE TO THESE REASON
A. its following a rectangle pattern that stocked the market
which preventing the market to move any one direction now it trying to break the strong resistant lable
B. after the break of this rectangle it will boost the market potential for break
C. also its resisting from a strong neckline the neckline also got weeker ald the price is ready to break in the outer region
all of these reason are indicating the same thing its ready for breakout BREAKOUT trading are follws good risk reward
please dont use more than one percentage of your capitalfollow risk reward and tradeing rules
that will help you to to become a bettertrader
thank you

Trading Analysis for Gold Spot / U.S. Dollar (15-Minute Chart)Sorry I am late in giving the signal but I will say that manipulation in XAU/USD is at extreme level. Keep portfolio at least $1000.
Take buy position in XAU/USD as much as possible.
Not more than $3630.00.
Target 1 3353.00
Target 2 3358.00
Target 3 3365.00
Target 4 3372.00
SL 3630.00
Based on the provided 15-minute chart for Gold Spot / U.S. Dollar (XAU/USD), published by NaviPips on TradingView.com on June 30, 2025, at 17:53 UTC, here’s a suggested trading setup for a buy position:
Current Price and Trend: The current price is 3,241.875, with a slight increase of +0.250 (+0.01%). The chart shows a recent downtrend that appears to be stabilizing near the current level, suggesting a potential reversal point.
Buy Entry: Enter a buy position at 3,312.875 (current price), as it aligns with a support zone where the price has found a base, indicated by the horizontal dashed line and recent consolidation.
Stop Loss: Place a stop loss at 3,295.250, below the recent low, to protect against further downside. This level is approximately 10.625 points below the entry, defining the risk.
Take Profit Levels:
Take Profit 1: 3,317.875, a conservative target about 20.000 points above the entry, aligning with a minor resistance zone.
Take Profit 2: 3,324.750, a mid-range target approximately 31.875 points above the entry.
Take Profit 3: 3,332.500, a deeper target about 45.625 points above the entry, indicating a potential trend reversal.
Price Action: The chart indicates a downtrend with a possible bottoming pattern near the current level. The support zone and upward candlestick suggest a buy opportunity if the price holds.
Risk-Reward Ratio: The distance to the stop loss (10.625 points) compared to the take profit levels (20.000 to 45.625 points) offers a favorable risk-reward ratio, ranging from approximately 1:1.9 to 1:4.3.
Conclusion
Enter a buy at 3,241.875, with a stop loss at 3,295.250 and take profit levels at 3,317.875, 3,324.750, and 3,332.500. Monitor the price action for confirmation of an upward move, and be cautious of a potential continued downtrend if the price breaks below the stop loss level. (Note: I assume "take profot" was a typo for "take profit" and have corrected it accordingly.)

Gold - Buy near 3640, target 3657-3674Gold Market Analysis:
Yesterday, gold prices saw a wild swing throughout the day due to the CPI. Gold initially fell, breaking support at a low near 3613. Buying activity took off immediately on the data. Today, we're still looking for volatility. Keeping in mind the broader trend, buying into volatility is more likely to follow a pullback. Furthermore, this volatility has broken through the previous downtrend channel. Today marks the weekly close, and barring any major surprises, the weekly chart will likely close positive. Next week, gold will continue to reach new highs, and a break of 3700 is imminent. The daily moving average has already crossed the K-line, making further volatility less likely. Focus on buying into the upside today. Consider buying opportunities in the Asian session first.
The chart shows support near 3640, the primary support level for the day. Today, we'll target 3640 for buy orders, keeping an eye on resistance at 3657. If it breaks through and then retraces in the Asian session, we can buy directly. The recent trend in gold requires aggressive buying, otherwise it's often difficult to find significant support. Since it's Friday, gold is unlikely to behave normally, so we must be wary of unusual fluctuations.
Support is at 3640 and 3629, while resistance is at 3657 and 3674. 3640 is the dividing line between strength and weakness.
Fundamental Analysis:
The CPI estimate was 2.7%, while the market expected 2.9%, and the price also reached 2.9%. Both market expectations and results were higher than the estimate, which would have weighed on gold in the long term. However, gold did not fall, but instead surged.
Trading Recommendations:
Gold - Buy near 3640, target 3657-3674

How long can the gold "carnival" last?Market News:
Spot gold maintained its overnight volatile trend in early Asian trading on Friday (September 12), currently trading around $3,636/oz. International gold prices fluctuated sharply due to the impact of US CPI and initial jobless claims data. London gold prices rebounded sharply after a sharp drop, paring most of the day's losses and ultimately closing slightly lower. Weak employment and a decline in the PPI have reinforced market expectations of a Federal Reserve rate cut next week. With interest rate expectations shifting toward easing, gold is expected to maintain its strength, but key factors remain in the Fed's policy stance following the meeting. The Fed's monetary policy direction remains the strongest indicator for the gold market, and current market consensus sees a rate cut next week as a certainty. Focus on the UK's July GDP data and the US University of Michigan's preliminary September Consumer Confidence Index on August 8 this trading day, and monitor geopolitical developments.
Technical Analysis:
Weaker-than-expected inflation and initial jobless claims data reinforced expectations of a Fed rate cut. The US dollar index fell in response, ultimately closing down 0.31. Technically, the daily chart showed alternating bearish and bearish trends, with the price closing above the 5-day moving average. Yesterday, support was found again after testing 3612/15. The 10/7-day moving averages moved up to 3690/16, and the RSI indicator was converging above the 70 level. From a 4-hour perspective, support is currently focused around 3610-15. Buying on intraday dips to this level will continue to support the bullish trend. The short-term buying barrier remains at 3600. If the daily chart stabilizes above this level, continue buying on dips. On the 4-hour chart, the price has retreated to the middle Bollinger Band at 3630, converging with the moving average. The RSI indicator is trading above its mid-axis. On the hourly chart, the Bollinger Bands are closing, the RSI is flattening, and the moving averages are converging. The main trading strategy for Friday's pullback remains to buy at low prices. The weekly chart forecasts another bullish candlestick pattern. However, gold prices are trapped within a wide, volatile short-term structural channel, with high-priced selling participating.
Trading strategy:
Short-term gold: Buy at 3620-3623, stop loss at 3612, target at 3640-3660;
Short-term gold: Sell at 3657-3660, stop loss at 3669, target at 3630-3610;
Key points:
First support level: 3628, second support level: 3615, third support level: 3600
First resistance level: 3658, second resistance level: 3667, third resistance level: 3680

Gold: Buy around 3624, target 3660-3674Gold Market Analysis:
Yesterday, we placed a sell order at 3655, then sold all our profits at 3646 in the US market. Yesterday's market saw a surge followed by a decline. The market fluctuations we predicted in yesterday's blog post were all correct. Gold is currently fluctuating at a high level in the short term. In this market, there are opportunities for buying and selling if you capitalize on the market's rhythm. Today, I predict gold will continue to fluctuate and correct before the CPI data is released. Capitalizing on this rhythm, both buying and selling are possible. Today, we are focusing on 3620. If this level breaks, we will consider a short position. Otherwise, we are looking for high-level fluctuations. The long-term trend is still a buy. We made it clear yesterday that long-term trends require time and space to develop. Yesterday's small positive close on the daily chart confirms our analysis. The 5-day moving average is beginning to rise. The volatility will not last long, and results will be seen soon. During the Asian session, we're focusing on the strong support band of 3620-3625. This level is also a buying opportunity for a rebound. Resistance is at 3657, yesterday's rebound high. We anticipate the market to fluctuate within this range. A break above 3657 will open up further upside, and a pullback could be considered a buying opportunity. Volatility occurs when a surge reaches resistance, and further gains are more likely after the volatility ends.
Support is 3620-3625, with strong support at 3600. Resistance is at 3647 and 3657, with 3647 being the dividing line between strength and weakness.
Fundamental Analysis:
The most important CPI data this week will be released today. The recent surge in gold prices is driven by increased market expectations for a September rate cut by the Federal Reserve. This CPI may be the final reference data the Fed uses.
Trading Recommendation:
Gold: Buy around 3624, target 3660-3674

Analysis of subsequent gold price trendsMarket News:
Spot gold saw slight gains in early Asian trading on Thursday (September 11th), currently trading around $3,545 per ounce. International gold prices continued their strong performance. Amidst softening US inflation data and widespread market bets that the Federal Reserve will initiate an interest rate cut next week, spot gold prices are approaching all-time highs, with related gold stocks and mining company indices simultaneously reaching record closing highs. The current strength in the gold market stems from a combination of weak US economic data, geopolitical risks, and the Federal Reserve's policy shift. While gold prices may fluctuate in the short term due to CPI data, the overall bull market is firmly in place, with a year-to-date gain of over 39% suggesting further upside potential. Gold prices continue to approach record highs, driven by unexpectedly weak inflation data, market confidence in an imminent Fed rate cut, and increased safe-haven demand. Industry analysts predict that if the Federal Reserve embarks on an easing cycle, gold will likely continue to attract investors, potentially reaching $3,900 per ounce by the end of the year.
Technical Analysis:
Gold has entered a period of volatile adjustment. Yesterday, it fell before rising, consolidating in a wide range around 3620/3660. Technically, the weekly and daily charts remain within a buying trend channel. The daily chart retraced its course below 3620 before stabilizing and rising strongly above 3658, closing above 3640. The daily chart closed with another positive candlestick pattern. The moving averages remain upward, with the 5-day MA moving average moving up to 3626. The hourly Bollinger Bands are converging, with the moving averages converging. The RSI indicator is retracing to its mid-50 level. On the four-hour chart, gold prices remain within the upper Bollinger Bands, with the moving averages converging. Technically, gold trading continues to see wide range-bound adjustments, with buyers buying at low prices and selling high. Fundamentals: Today's US PPI inflation data will be a key focus!
Trading strategy:
Short-term gold: Buy at 3627-3630, stop loss at 3618, target at 3660-3680;
Short-term gold: Sell at 3660-3663, stop loss at 3672, target at 3630-3610;
Key points:
First support level: 3626, Second support level: 3612, Third support level: 3600
First resistance level: 3666, Second resistance level: 3680, Third resistance level: 3696
