Gold Faces Resistance, Buyers Should Stay Alert near Key SupportGold Futures (MCX) Analysis: Key Points to Watch
Current Price Range: Gold Futures are trading around ₹98,700 to ₹98,750.
Resistance Zone: Gold has been repeatedly rejected near its high around ₹101,500, showing strong selling pressure at this level.
Trendline Broken: Recently, gold broke an important upward trendline that had acted as a reliable bounce-back support.
Key Support Emerging: After this break, a key support level has appeared around ₹97,700 to ₹97,750. This zone will be important to watch for potential price stabilization.
Additional Support Levels: The chart also highlights other support zones that could provide buying interest if prices decline further.
Trader Outlook: Buyers need to remain cautious and vigilant at these levels. The market shows signs of short-term weakness, and how gold behaves around these supports will be crucial for the next move.
Gold is at a critical juncture where it faces both selling pressure and key supports. Watching the reaction around ₹97,700-₹97,750 will help gauge whether bulls regain control or further correction unfolds. Stay alert and manage risk carefully.
Goldmcx

Gold to loose its shine! Let's see how muchAfter a Fantastic Bull run for Gold.
I see it's loosing it shine to some extent.
It's time to kiss EMA20 (Monthly) after 2 Year when Gold last touches EMA 20 of Monthly time frame in OCT 2023 @ 62500. About 2 Years back.
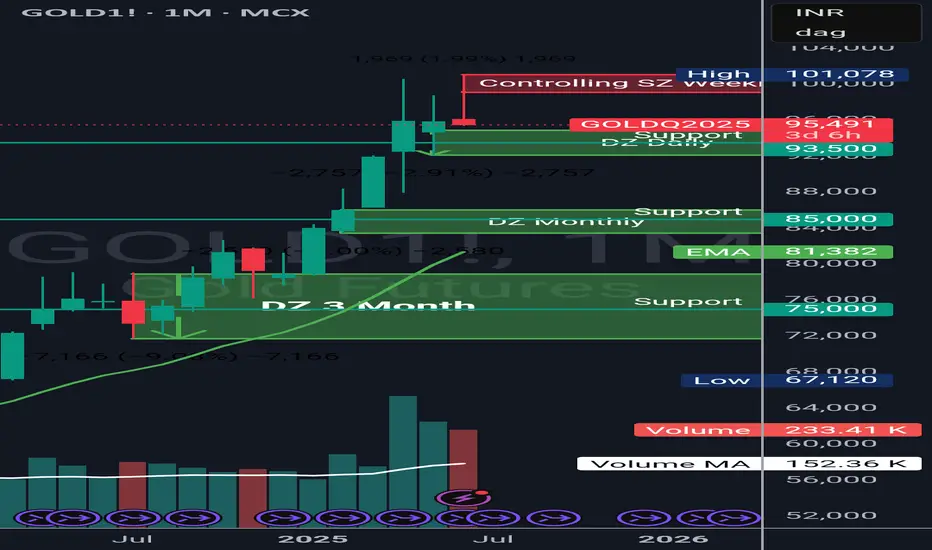
Today Gold Future in MCX is 95500 There is a good support @ 93500 but if it breaks this convincingly it should loose its shine till 85000 where it would meet the EMA20 (Monthly).
This should happen in next 1-2 months.
In case it can't hold 85000 then the next level of support it would find @ 75000 to make it fair and lovely again.
Gold - Long Term Elliot Wave Counts - Top is near!Gold has finally started it's last leg up, 5th of 5th on Weekly.
This can go another 3-5% to 90600, 9100 or so, or maybe slightly higher, however, when it ends, we are looking for a sharp fall, as an extended 5th with short retracement in 4th doesn't end well.
Lot of people would be trapped, and when it starts breaking levels it will create double pressure from bears shorting and bulls covering longs.
I am expecting around 75k.

GOLD MCX OUTLOOK FOR MARCH 2025GOLD MCX:
After a smart rally Seen in Gold MCX from 79,600/- levels in JAN 2025 we have seen gold accelerating towards Highs of 86,592/-. Approximately 7,000 Points mammoth rally)
What's Next:
If we analyze the technical chart on daily and weekly time frame. Observed a "Flag Pattern Formation" has been witnessed. If GOLD MCX closes above or sustains above 86400 (Flag Pattern Breakout levels) another leg of rally can be seen on the upside.
Any correction towards 84000-84200 (Flag Pattern Support) it will be best buying opportunity for the short term investors, If Gold MCX closes below 83800 then there can be correction in the yellow metal. So we suggest continue to HOLD long positions with Stop loss of 83800 and accumulate GOLD MCX on correction till 84000- 84200 Levels. (Do not forget the Stop loss)

GOLD MCX AT ALL TIME HIGHS, WHATS NEXT ?GOLD MCX:
GOLD MCX has crossed at time highs today (19-Feb-25, Wednesday) and Continue to Rally upwards. There are many reasons for GOLD to head higher, but will mention only Technical view (Via Chart) on GOLD.
Looking at the Technical Chart of GOLD MCX. It can be clearly seen Gold has breached its resent resistance levels of 86300. Till GOLD MCX holds above 86300 Levels one should stay long on the GOLD MCX with stoploss below 86200.
If we look at the GOLD STOP COMEX (CMX) Gold has crossed Resistance level of 2939 and till it holds above 2939 Level one should Stay on the Long Side on GOLD.

Gold - EW Analysis - Short Set-upGold is at an interesting juncture.
Weekly 3 done.
Wave 4 is forming an Expanding Flat in which A is done and B is going on.
2830-40 could be a good zone to look for shorts with 2860 as SL.
Targets are big. So, ride :)

This chart represents a detailed Elliott Wave analysis for Gold This chart represents a detailed Elliott Wave analysis for Gold (XAUUSD) in a 1-hour timeframe. Here's the explanation:
Elliott Wave Progression:
The chart shows waves labeled as (i), (ii), (iii), (iv), and (v) for a larger impulsive move down.
Following the completion of wave (v), a corrective structure (marked with W, X, Y, Z) appears, indicating a complex corrective wave.
Corrective Wave Structure:
The corrective wave appears to form a double or triple zigzag pattern (W-X-Y-(Z)).
The orange trendlines illustrate a wedge or channel pattern, suggesting consolidation or exhaustion in the corrective phase.
Current Status:
The blue circle marks the point of interest where the price breaks out or rejects the wedge pattern.
This could indicate the end of the corrective phase and the beginning of the next impulsive move.
Future Projections:
The red arrow pointing downward suggests continuing the decline to complete wave (c).
Key Fibonacci retracement levels (0.618 and 0.786) are marked at $2,551.15 and $2,527.49, respectively, as potential support zones.
The highlighted yellow area serves as a strong demand zone, potentially signaling where the price may reverse after completing the correction.
Long-Term Expectation:
After completing wave (c) near the demand zone, the upward red arrow suggests a significant bullish move. This aligns with Elliott Wave theory, where a strong impulsive wave follows a corrective wave.
Key Levels:
Resistance: Near the upper boundary of the corrective wedge/channel.
Support: Fibonacci retracement levels and the highlighted yellow zone.

GOLD Retracement faling can continueHello everyone,
MCX GOLD After registering lifetime high of 79775 fallen by more than 5% now trading at 75200 daily 200EMA still 5000 points away and if going to make 61% retracement then another 4000-6000 points fall can expect with supported volume for selling its overall bearish view.

Gold for the week 16th sep to 20th sep 2024.Gold is technically long above 2530.
Wait for a fall till 2560 and if it retraces and forms a green candle in 4hr time frame then buy above the high of the Candle
Sell below the low of the day candle close below 2530
Movement is based on FED's interest rate decision. My view is that FED may cut 0.50 basis point since the American economy is on the edge of falling into a recession.
Disclaimer.
The above views are my own and for educational purpose. You may do you own analysis before taking a position.

Gold Levels For 12 August-14 AugustImportant support and Resistance Levels For Gold.
When Market touches the level, the price action plays important roles.
For More Learning Reach out to us.

Bullish on Gold Gold screaming Buy Buy Buy
From 26th July'24
Time to buy the Dip in Gold Due to Slash in Custom Duty by the Government.
Buy on Dips strategy is good to go for Long term Investing This is the right time for Gold lovers to invest as Daily Timeframe Charts suggest the Fall in Gold prices are Done.
The bottom is made to be precise.
Buy Signal also generated on Silver too.

Gold looks sidewaysTrend analysis
Current week trend has less volumed when compare to last week.
Looks golds is in range bound between 2380 to 2280 per trend analysis pattern.
Three drive pattern gives short look below 2,270.
Please do your Own analysis before trading.
I just share my view.

Going against the trend on Gold (position Trade)after the gap on 21st the buying potential looks faded and we can see a strong rejection
then we have 4h bearish fvg and then filtered with 15mn another bearish fvg
which is at the level of 66400 could be the selling or short limit with sl of 66800 and target of 65200 and second target at 64400

#2 GOLD Update - know where to buy and sellIf, price below 61450 will trigger the liquidity of trades who entered recently
because the price have not mitigated the order block below it 61200 and 61100
On the upper side, above 62700
63200 - 63400 - 63800 will be the sellers order block and fair value they will look to sell
the remaining levels will be choppy
trade level to level

GOLD Future Intradayprice follow a trend line and price is respect lower low pattern.
Intraday resistance 1: 62251
Intraday resistance 2: 62404
Support :62062

GOld spot or XAUUSD DOwntrend movement . Target 1900SYmbol Gold SPot or XAUUSD
TImeframe Day chart
Analysis : Here we can conclude Selling pressure is more as we can observe a strong reverse pin bar and the breakout from the triangle pattern .
We can expect a target of 1985/1900
HOPE our analysis is adding value to your Trading Journey.
NOTE: Published Ideas are for ‘’EDUCATIONAL PURPOSE ONLY’’ trade at your own risk.
NOTE: RESPECT The risk. SL should not be more than 2% of the capital.

GOLD BUYING ZONE - Paitence is KEY (2024 #1)5888 - 57500 will be investor buying zone , which is 6-8% away from friday close,
and for trader they been looking the triangle pattern breakout
would rather wait and buy
instead of shorting the gold (following the long term trend)
based on my fib projection the price here has reached overbought zone which needs a correction for futher continuing the uptrend
will update further as per market movement
follow for more

Gold Mini Futures Intraday Prediction Levels for 7 Dec 2023Gold Mini Futures Intraday Prediction Levels for 7 Dec 2023
The chart indicates 15 min time frame. These Levels act as Support and Resistance according to position of price . They are strictly for Intraday Trading only. Execution only after break out and close above the Resistance zone/Line or after break down and close below the Support zone/Line.
These levels act as support and resistance. You have to trade according to level breakout or breakdown.
If You are a new trader then just watch (No Trade) these levels for some days.
Happy trading.
Disclaimer:
I am not a SEBI Registered Analyst. Anything posted here is my own analysis and views. This is created for educational purposes only. Always consult your Financial Advisor before taking any decision or trade.

GOLD AT 60,000 , WHATS NEXT ??Short Recap - Gold had good rally from 6th oct , to the upside from 56500 to 61250
Currently - price is hovering around the higher time frame bearish order block which is resulting a resistance phase to gold price from (61500 to 60500 zone)
there is been a internal CHOC (trend change) from bullish to bearish
although the bearish continous will be confirmed if price breakdown and close below 60200 - 60,000
What to do -
after the break and close of 60,000 short trade can enter with quick targets
as this could be pullback on major time frame
where as those willing to go long will need to wait for specific levels
consider 58250-58000 zone as a value buying zone
this can be tracked based on price shifting the stucture from lower low and lower high towards higher high to higher low as Long Indication

Gold MCX Short Opportunity: Key Levels to WatchPotential Gold MCX Short Setup: A short position may be considered in Gold MCX if the price falls below 60620, with a stop loss set at 61150. Please note that this trade setup is only valid if the price does not breach 61120 before activating the short.
Disclaimer: Trading involves risks, and this is not financial advice. Always perform your own analysis and risk assessment before making any trading decisions.

Gold MCX Long Strategy with Key PointsConsider a long position in Gold MCX around the current price of 61160.
Initiate 30% of your standard position size.
Add to your position within the 60960-61000 range.
Set a stop loss at 60550 for risk management.
Potential profit targets are at 61380, 61600, and potentially 61800 or higher.
Please note that this is a suggested approach and not financial advice. Make informed decisions and conduct your own analysis.

Gold MCX: Trading in one thousand-Point RangeGold MCX has settled into a range, possibly confined within a 1000-point zone, specifically between 60125 and 61125 . It's prudent to exercise patience and await a decisive breakout from this range before considering new trades.
Stay connected for forthcoming trade ideas.
Disclaimer: Trading involves risk, and past performance is not indicative of future results. Always conduct thorough research and consider your risk tolerance before making any trading decisions.

Gold MCX - Trade UpdateHey traders, here's an important update on our Gold MCX positions:
We've successfully booked our long position and are currently completely out of our short-term long trade.
In order to consider re-entering a long trade, we'll be closely monitoring the market for a break above the key level of 61,130 , and it's crucial that the price sustains above this level.
As of now, our focus is on initiating a short trade entry around 60,750 , while maintaining a disciplined stop loss at 61,150.
Stay tuned for more updates and trade responsibly. Happy trading, everyone!
