GOLD MCX AT ALL TIME HIGHS, WHATS NEXT ?GOLD MCX:
GOLD MCX has crossed at time highs today (19-Feb-25, Wednesday) and Continue to Rally upwards. There are many reasons for GOLD to head higher, but will mention only Technical view (Via Chart) on GOLD.
Looking at the Technical Chart of GOLD MCX. It can be clearly seen Gold has breached its resent resistance levels of 86300. Till GOLD MCX holds above 86300 Levels one should stay long on the GOLD MCX with stoploss below 86200.
If we look at the GOLD STOP COMEX (CMX) Gold has crossed Resistance level of 2939 and till it holds above 2939 Level one should Stay on the Long Side on GOLD.
Goldprediction

Gold price analysis February 17⭐️Fundamental Analysis
Gold prices continued to rise after eight consecutive weeks, supported by the weakening of the USD and US Treasury yields. The market expects the Russia-Ukraine conflict to end soon as Donald Trump is expected to meet Vladimir Putin in Saudi Arabia.
Decreasing geopolitical risks and expectations of the Fed cutting interest rates twice in 2025 due to weak retail sales have negatively impacted the USD, helping gold prices rise. However, profit-taking pressure has limited the increase of gold.
In addition, the US-EU trade tension over tariff policies also boosted demand for gold. This week, gold prices may fluctuate strongly due to the US holiday and statements from Fed officials before the Monetary Policy Meeting Minutes.
⭐️Technical Analysis
Gold is facing a resistance zone and the resistance zone accepted by sellers is around 2905-2907. At the end of the Asian session or the beginning of the European session, if we cannot break this zone, we can implement SELL GOLD strategies to 2890. When GOLD breaks 2906, pay attention to around 2915 and 2929 for SELL strategies. 2887 is considered the most important support of today and can set up buy signals in that zone.

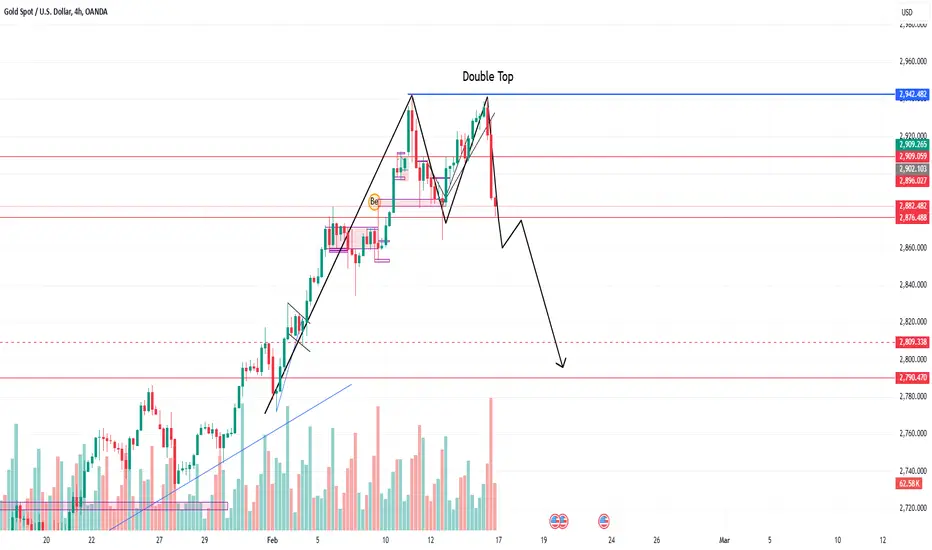
XAUUSD Double Top PatternOANDA:XAUUSD
Hi All, here you can see that XAUUSD has created Double top pattern in 4HR Time frame. so if it breakes down the drawn level we can short and capture some pips.
Gold Trading Plan for 13th Feb 2025Gold Trading Levels
🔹 Buy Setup:
Buy Above: The high of the 1-hour candle that closes above 2917
📍 Targets: 2930, 2939, 2950
🔹 Sell Setup:
Sell Below: The low of the 1-hour candle that closes below 2890
📍 Targets: 2878, 2868, 2858
📌 Analysis:
Instead of entering trades immediately at 2917 or 2890, this strategy ensures confirmation by waiting for a full 1-hour candle close above or below these levels.
This approach helps filter out false breakouts and improves trade reliability.
If gold closes above 2917, traders should enter at the high of that closing candle for a potential bullish move.
If gold closes below 2890, traders should enter at the low of that closing candle for a possible bearish move.
📢 Disclaimer:
This trading analysis is for informational purposes only and does not constitute financial advice. Trading in commodities and financial markets involves significant risk, and past performance does not guarantee future results. Always conduct your own research and consult with a professional before making any trading decisions. The author or publisher is not responsible for any financial losses incurred based on this information. 🚨

GOLD Futures84537₹ Level has to be broken for next big fall, be prepared and look out for breakdown.
Failed breakout mayalso happen that's why I would suggest buy small and if trade moves in favour, then add more quantity

bearish view | gold | Short TermHi,
Overall looking to the charts and analyzing Elliot wave patterns,
I have this bearish view on gold.. this time i have given time target also..
finger crossed, lets see if we get another opportunity to buy gold at lower levels..

GOLD - TRADING AT CHANNEL RESISTANCE - TIME TO SELL?Symbol - XAUUSD
CMP - 2858
Gold has reached a new all-time high (ATH) of $2861 & trading at rising channel resistance, amidst heightened risks of tariff conflicts and persistent inflation, encountering resistance at the channel trend. However, due to potential political manipulation, the possibility of a market correction exists.
Currently, gold is consolidating above $2840 following its ATH, as it awaits key data such as US employment figures and speeches from Federal Reserve officials. Increased volatility has been observed, driven by conflicting statements regarding former President Trump's tariff policies: tariffs were initially imposed, only to be rescinded a few hours later, highlighting the influence of political decisions. Following a false breakout at the resistance of the ascending channel, gold is now undergoing a correction, partly prompted by news of the temporary suspension of tariff hikes by the United States. Despite these fluctuations, gold remains resilient, supported by the Fed’s cautious stance on rate cuts.
Key Resistance levels: $2860 and $2872
Key Support levels: $2845, $2840, $2818
Should the price fall below the $2840 mark and consolidate beneath this level, a short-term correction towards $2824 - $2815 may occur. However, no significant trend reversal is indicated, and growth may resume from these key support areas.

GOLD TRADING POINT UPDATE > READ THE CHAPTIAN Buddy'S dear friend 👋
SMC Trading Signals Update 🗾🗺️ Gold traders SMC trading poi nt update you on New technical analysis setup list time post signals 🚀 Hit sucksfully My target 🎯 point 2877 Now ✅ update you on New technical analysis update on gold 🪙 Gold still going to bullish trend 📈 🚀 today us session. More bullish on Gold take a New ATH 2904 I'm long Now 2869 + 2904 Good luck 💯🤞
Key Resistance level 2880 + 2904
Key Support level 2866 - 2854 - 2845
Mr SMC Trading point
Plaes support boost 🚀 analysis follow)

Gold Break All Time High Again And Again🌍 Market Overview: Gold Bullish Expansion
Continues bullish momentum, reaching a new All-Time High (ATH).
Driven by USD weakness and improved global sentiment.
Key Drivers:
🔹 Postponed Tariffs: Delay on tariffs for Canada & Mexico boosted investor confidence.
🔹 China's Retaliation: Symbolic tariff actions by China, with minimal real economic impact.
15-Minute Chart
• Key Observations:
o Strong bullish momentum is evident, with price repeatedly breaking previous highs.
o A key support zone is established around $2,840, reflecting strong buying interest.
o Recent bullish movement aligns with improved investor confidence due to postponed
tariffs on Canada & Mexico and symbolic Chinese tariff retaliation.
• Market Sentiment:
o Bullish sentiment is dominant, likely fueled by favorable
geopolitical and economic developments.
o Immediate resistance is near the all-time high levels;
a clear breakout could indicate further upside.
________________________________________
4-Hour Chart
🚀 Key Observations:
Price is trading within an upward parallel channel, confirming a consistent bullish trend.
A breakout and successful retest of the upper boundary of the channel signals potential continuation of the bullish move.
The price has established higher highs and higher lows, indicating a strong uptrend.
Technical Levels:
Resistance: Near $2,860-$2,865 (current high levels).
Support: $2,820 (middle channel boundary).
________________________________________
Conclusion:
• Overall Bias: Strongly bullish in both short and medium time frames.
• Trading Strategy:
o 🔵For buyers: Consider entries on pullbacks toward $2,840-$2,845 (support zone).
o For breakout traders: A clear break above $2,865 with strong volume may
present an opportunity to ride the trend.
o For risk management: Place stop-loss below $2,820,
as a breach could indicate a potential reversal.
⚡️The Result?
👉Gold continues to break records, hitting 2848 - 2850 this morning, a key Fibonacci
Extension (FE) resistance zone. However, selling pressure remains weak, and price
action still favors bulls. NO FOMO SELL at this level!
👉 Always follow TP/SL to protect your capital and maximize profits!
Stay tuned for updates once the confirmations are in place !
Please support me with your likes and comments to motivate me to share more analysis with you and share your opinion about the possible trend of this chart with me !
📢 Best Regards , Silver Wolf Traders Community
Disclaimer: This is for educational purposes only.
Always trade responsibly and manage your risk effectively

GOLD TRADING POINT UPDATE > READ THE CHAPTIAN Buddy'S dear friend 👋
SMC Trading Signals Update 🗾🗺️ Gold traders SMC trading point update you on New technical analysis setup for Gold 🪙 Gold still holding it up rising Gold 🪙 today take again 💪 new ATH 2845 I will see again for New ATH 2880 ) Gold Traders SMC-Trading Point update technical patterns b. SMC ) Gold recovery samll trade Short 😀 2830 - 2817 that is good support level of buying zone ☺️ 🥂 good luck 🤞
Key Resistance level 2845 + 2880
Key Support level 2830 - 2817 - 2772
Mr SMC Trading point
Pales support boost 🚀 analysis follow)

GOLD Trading Strategy for 04th Feb 2025 GOLD Trading Strategy:
Buy Strategy:
Entry Point: Buy above the high of the 15-minute candle that closes above 2832
Targets:
First Target: 2840
Second Target: 2851
Third Target: 2860
Stop-Loss: The stop-loss will be set at the low of the candle that breaks out above 2832.
Sell Strategy:
Entry Point: Sell below the low of the 15-minute candle that closes below 2796
Targets:
First Target: 2790
Second Target: 2781
Third Target: 2772
Stop-Loss: The stop-loss will be set at the high of the candle that breaks down below 2796.
Time Frame:
15-Minute Time Frame: This strategy is based on the 15-minute time frame, allowing for shorter-term trading opportunities and quicker responses to market movements.
Important Points:
Stop-Loss Orders: Always use stop-loss orders to manage risk and protect your capital.
Monitor Market Conditions: Continuously monitor market conditions and news that could impact the GOLD price.
Technical Indicators: Consider using technical indicators and chart patterns to confirm entry and exit points.
Disclaimer: Please conduct your own research and consult a professional financial advisor before making any investment decisions. Trading and investing involve significant risk of loss and are not suitable for every investor.

SILVER VIEW⚠️Education Purpose only!!!!
Key Support area:-87,100
Key Resistance area:-96,200
Silver has long been considered a 🏦 store of value and a 🛡️ hedge against inflation.
Riskier but suitable for speculation and hedging.
🔧 Industrial Demand – Used in ⚡ tech, ☀️ solar, 🚗 EVs
💰 Monetary Hedge – Safe-haven in 🔥 inflation & 📉 downturns
⛏️ Supply Constraints – Limited mining, rising demand 📊
📊 Growing Investment – ETFs & retail piling in 🚀
⏳ Long-Term View
If industrial demand and inflation persist, silver could see 📈 strong appreciation over the next decade.
🔍 Investors should monitor global economic trends, 📉 interest rates, and ⛏️ mining supply data to make informed decisions. 🚀
Price Action applied :-
⭕️50 Day Moving averages
⭕️Channel Pattern Formation
⭕️Range Breakout
⭕️Triangle Pattern Formation
⭕️Demand Zone
⭕️Major Resistance area
✅Check out my Trading View profile to see how we analyze charts and execute trades.
🙋♀️🙋♂️If you have any questions about this stock, feel free to reach out to me.
📍📌Thank you for exploring our idea! We hope you found it valuable.
🙏FLLOW for more !
👍LIKE if useful !
✍️COMMENT Below your view

GOLD TRADING POINT UPDATE >READ THE CHAPTIAN Buddy'S dear friend 👋
SMC Trading Signals Update 🗾🗺️ Gold traders SMC trading point update you on New technical analysis setup for Gold 🪙 Gold list week take a New All Time high ATH 2817 ) Gold Traders SMC-Trading Point still ses a bullish trend 📈 🚀 this week take a New 🆕 ATH 2837 fisrt take support breakdown moving 😃 up trand that expect it. Next week Two strong 🪨💪 support level 2785 2772 that entry buying said if close below 👇 that level that expect Short Trade. 2724 2703 )
Key Resistance level 2817+ 2837
Key Support level 2785 - 2772 - 2724 - 2703
Mr SMC Trading point
Pales support boost 🚀 analysis follow)

Analysis Of Gold (XAUUSD)💡 Key Economic Updates for the Week:
Nonfarm Payrolls (Friday):
Expected to indicate solid job growth.
Likely to influence USD strength.
Impact on Gold: May react inversely to USD performance based on labor market data.
ISM Services PMI (Thursday):
Provides insights into economic activity and inflation trends.
Federal Reserve Watch:
Traders will monitor speeches from Fed officials for hints on future rate decisions.
________________________________________
📊 1. Trend Analysis:
• Higher Timeframe (4H Chart):
o The price is trading within an ascending channel (marked by red trendlines),
indicating a bullish structure overall.
o However, the recent rejection from the upper boundary of the channel and
subsequent pullback suggests a potential retracement phase.
• Lower Timeframe (1H and 15M Charts):
o The price has entered a significant demand zone (highlighted in light blue)
after breaking below a minor consolidation range.
o Fibonacci retracement levels are being used to determine possible
Take Profit (TP) levels during the pullback.
________________________________________
2. Key Levels Identified:
• Resistance Levels (Supply Zones):
o $2,788–$2,790 (Red Zone):
A strong supply area where price has rejected multiple times.
This zone aligns with liquidity above recent highs.
• Immediate Resistance:
o $2,796 (Liquidity Zone):
A potential target if price attempts to retest liquidity near this level.
________________________________________
• 📊 Support Levels (Demand Zones):
o $2,764 (Fib TP1):
This is the first target level from Fibonacci retracement analysis.
o $2,751.5 (Fib TP2):
A deeper retracement target, aligning with a significant
point of interest (POI) on the chart.
o Channel Support (~$2,750):
The lower boundary of the ascending channel, acting as dynamic support.
________________________________________
⚠️ Possible Scenarios:
1. Bullish Scenario:
o If price holds above $2,764 (Fib TP1), expect a reversal toward
$2,788–$2,790 (supply zone) or even the liquidity zone at $2,796.
2. Bearish Scenario:
o If price breaks below $2,764, further downside toward $2,751.5 (Fib TP2) or
the ascending channel support near $2,750 is likely.
________________________________________
4. Key Takeaways:
• Short-Term Levels:
o Support: $2,764, $2,751.5, and $2,750.
o Resistance: $2,788, $2,790, and $2,796.
• Mid-Term Levels:
o Focus on how the price reacts at $2,764 and the ascending channel's
lower boundary for clearer direction.
________________________________________
👉 Always follow TP/SL to protect your capital and maximize profits!
Stay tuned for updates once the confirmations are in place!
Please support me with your likes and comments to motivate me to share more analysis with you and share your opinion about the possible trend of this chart with me !
📢Best Regards , Silver Wolf Traders Community
Disclaimer: This is for educational purposes only.
Always trade responsibly and manage your risk effectively

GOLD Trading Strategy FOR 02 Feb 2025GOLD Trading Strategy:
Buy Strategy:
Entry Point: Buy above the high of the 15-minute candle that closes above 2813
Targets:
First Target: 2818
Second Target: 2824
Third Target: 2833
Stop-Loss: The stop-loss will be set at the low of the candle that breaks out above 2813.
Sell Strategy:
Entry Point: Sell below the low of the 15-minute candle that closes below 2790
Targets:
First Target: 2782
Second Target: 2775
Third Target: 2770
Stop-Loss: The stop-loss will be set at the high of the candle that breaks down below 2790.
Time Frame:
15-Minute Time Frame: This strategy is based on the 15-minute time frame, allowing for shorter-term trading opportunities and quicker responses to market movements.
Important Points:
Stop-Loss Orders: Always use stop-loss orders to manage risk and protect your capital.
Monitor Market Conditions: Continuously monitor market conditions and news that could impact the GOLD price.
Technical Indicators: Consider using technical indicators and chart patterns to confirm entry and exit points.
Disclaimer:
Please conduct your own research and consult a professional financial advisor before making any investment decisions. Trading and investing involve significant risk of loss and are not suitable for every investor.

What Next in Gold After Fed Interest rate
💡 Key Observations
1. Ranging Market (15-Minute Timeframe):
o The price is consolidating within a tight range near $2762, showing indecision in the
market. This is a typical behavior before a breakout or breakdown.
2. Order Blocks (OB):
o OB on 1H: The $2771-$2772 zone is still acting as a strong resistance. Multiple price
rejections confirm this as a supply zone.
o OB on 30M: A minor order block is visible near $2760-$2762, suggesting short-term demand
in this area.
3. Trendline Support:
o The upward red trendline continues to act as dynamic support. Price is respecting this
trendline, maintaining a bullish structure for now.
4. Demand Zone at POI Level:
o The $2745-$2742 zone remains a critical support area. If the price retraces, this zone is
likely to attract buyers.
5. Fed Interest Rate Impact:
o The Fed's decision to keep interest rates unchanged at 4.5% has added to the ranging
behavior as traders await clearer cues.
6. Overall Trend:
o The broader structure is still bullish, supported by the 200 EMA (blue line) and the
ascending trendline. However, the price is struggling to gain momentum near
the resistance.
________________________________________
💡Key Levels
• Resistance Levels:
o $2771-$2772 (Major Resistance): Watch for a breakout here for further bullish momentum.
o $2790 (All-Time High): If $2772 is cleared, this is the next target.
• Support Levels:
o $2760-$2762 (30-Minute Order Block): Short-term support zone within the range.
o $2745-$2742 (POI Level): Strong demand zone and key level to hold for bullish
continuation.
________________________________________
📊 Market Outlook
1. Bullish Case:
o A breakout above $2772 with strong volume could push the price toward the all-time high
of $2790.
o The bullish trendline and 200 EMA provide strong support for this scenario.
2. Bearish Case:
o A breakdown below the trendline and the $2745-$2742 demand zone could lead to a deeper correction, potentially targeting the $2730 level or lower.
________________________________________
💡Trading Strategy Suggestions
1. For Buyers:
o Enter long positions near the $2745-$2742 demand zone or on a breakout above $2772,
targeting $2790.
o Keep a tight stop-loss below the trendline or $2740 to limit risk.
2. For Sellers:
o Consider short positions near the $2772 resistance if the price continues to reject this
level, targeting $2760 or lower.
o A break below the trendline could also signal a shorting opportunity, aiming for $2730.
________________________________________
⚠️Conclusion
Gold is in a consolidation phase near the $2762 level, with a strong resistance zone at $2771-$2772. While the overall structure remains bullish, a breakout or breakdown from the range will determine the next move. Keep an eye on key support and resistance levels, along with market news or economic triggers, for clearer direction.
👉 Always follow TP/SL to protect your capital and maximize profits!
Stay tuned for updates once the confirmations are in place!
Please support me with your likes and comments to motivate me to share more analysis with you and share your opinion about the possible trend of this chart with me !
📢Best Regards , Silver Wolf Traders Community
Disclaimer: This is for educational purposes only.
Always trade responsibly and manage your risk effectively

Gold Trading Strategy for 29th January 2025Buy Strategy:
Buy Above: The high of the 15-minute candle that closed above 2772
Targets: 2780, 2795, 2806
Stop-Loss: Below the low of the 15-minute candle that closed above 2772
Sell Strategy:
Sell Below: The low of the 15-minute candle that closed below 2745
Targets: 2738, 2730, 2719
Stop-Loss: Above the high of the 15-minute candle that closed below 2745
Disclaimer:
This analysis is based on historical data and market trends. Past performance is not indicative of future results. Trading and investment involve risks, and you should conduct your own research or consult with a financial advisor before making any decisions.

GOLD TRADING POINT UPDATE >READ THE CHATPIAN Buddy'S dear friend 👋
SMC Trading Signals Update Gold Traders SMC-Trading Point update you on New technical analysis update) Gold still going to buying zone ☺️ 🥂 running BSS AND CHO) patterns Now Gold making a new Bss again back up trand safe buying zone 2759) And Next buying target 🎯 point 2800) fundamental analysis / trump telling more rates cute ) that is expected it more gold)))
Key resistance level 2788 +2797 +2800
Key support level 2764 -2759
Mr SMC Trading point
Support 💫 My hard analysis Setup Lik like and following me 🤝 that star ✨ game 🎮

Gold Trading Strategy for 27th January 2025Gold Trading Strategy
Buy Strategy:
Buy Above: The high of the 15-minute candle that closed above 2780
Targets: 2788, 2796, 2804
Stop-Loss: Below the low of the 15-minute candle that closed above 2780
Sell Strategy:
Sell Below: The low of the 15-minute candle that closed below 2751
Targets: 2743, 2735, 2723
Stop-Loss: Above the high of the 15-minute candle that closed below 2751
Disclaimer:
This analysis is based on historical data and market trends. Past performance is not indicative of future results. Trading and investment involve risks, and you should conduct your own research or consult with a financial advisor before making any decisions.

Gold Trading Strategy for 23rd January 2025Gold Trading Strategy
Buy Strategy:
Condition: Wait for the 15-minute candle to close above 2764.
Trigger: Buy when the price moves above the high of the 15-minute candle that closed above 2764.
Targets: 2773, 2779, 2785
Stop-Loss:
Set a stop-loss order below the low of the 15-minute candle that closed above 2764 to limit potential losses.
Trailing Stop-Loss:
Use a trailing stop-loss to lock in profits as the price moves towards the targets. For example, set a trailing stop of 10 points below the current price.
Sell Strategy:
Condition: Wait for the 15-minute candle to close below 2742.
Trigger: Sell when the price moves below the low of the 15-minute candle that closed below 2742.
Targets: 2738, 2732, 2726
Stop-Loss:
Set a stop-loss order above the high of the 15-minute candle that closed below 2742 to limit potential losses.
Trailing Stop-Loss:
Use a trailing stop-loss to lock in profits as the price moves towards the targets. For example, set a trailing stop of 10 points above the current price.
Discipline:
Stick to the trading plan and do not deviate from the strategy. Avoid making impulsive decisions based on emotions.
Disclaimer:
This analysis is based on historical data and market trends. Past performance is not indicative of future results. Trading and investment involve risks, and you should conduct your own research or consult with a financial advisor before making any decisions.

Gold Trading Strategy for 22nd January 2025Gold Trading Strategy
Buy Strategy:
Entry Point:
Condition: Wait for the 15-minute candle to close above 2758.
Trigger: Buy when the price moves above the high of the 15-minute candle that closed above 2758.
Targets:
First Target: 2769
Second Target: 2781
Third Target: 2793
Stop-Loss:
Set a stop-loss order below the low of the 15-minute candle that closed above 2758 to limit potential losses.
Trailing Stop-Loss:
Use a trailing stop-loss to lock in profits as the price moves towards the targets. For example, set a trailing stop of 10 points below the current price.
Profit Booking:
As the price reaches each target, consider booking partial profits to secure gains. For instance, sell a portion of the position at 2769, another portion at 2781, and the remaining position at 2793.
Sell Strategy:
Entry Point:
Condition: Wait for the 15-minute candle to close below 2730.
Trigger: Sell when the price moves below the low of the 15-minute candle that closed below 2730.
Targets:
First Target: 2721
Second Target: 2708
Third Target: 2696
Stop-Loss:
Set a stop-loss order above the high of the 15-minute candle that closed below 2730 to limit potential losses.
Trailing Stop-Loss:
Use a trailing stop-loss to lock in profits as the price moves towards the targets. For example, set a trailing stop of 10 points above the current price.
Profit Booking:
As the price reaches each target, consider booking partial profits to secure gains. For instance, sell a portion of the position at 2721, another portion at 2708, and the remaining position at 2696.
Risk Management:
Position Sizing:
Use proper position sizing to ensure you do not risk more than 1-2% of your trading capital on a single trade. This helps to manage risk and protect your capital.
Diversification:
Avoid putting all your capital into a single trade or asset. Diversify your trades across different assets to minimize risk.
Discipline:
Stick to the trading plan and do not deviate from the strategy. Avoid making impulsive decisions based on emotions.
Disclaimer:
This analysis is based on historical data and market trends. Past performance is not indicative of future results. Trading and investment involve risks, and you should conduct your own research or consult with a financial advisor before making any decisions.

GOLD SHOWING A GOOD UP MOVE WITH 1:10 RISK REWARDGOLD SHOWING A GOOD UP MOVE WITH 1:10 RISK REWARD
DUE TO THESE REASON
A. its following a rectangle pattern that stocked the market
which preventing the market to move any one direction now it trying to break the strong resistant lable
B. after the break of this rectangle it will boost the market potential for break
C. also its resisting from a strong neckline the neckline also got weeker ald the price is ready to break in the outer region
all of these reason are indicating the same thing its ready for breakout BREAKOUT trading are follws good risk reward
please dont use more than one percentage of your capitalfollow risk reward and tradeing rules
that will help you to to become a bettertrader
thank you

My #XAUUSD short side viewWe can see 2 times before that XAUUSD has crossed last resistance after slowly buy side run, fast bearish move expected after crossing 2725.
It can repeat same.
Let's see
