XAUUSD (Gold) | Technical Outlook | 9th Jan'2026XAU/USD – Gold Technical Outlook (Jan 9, 2026)
Gold (XAU/USD) is trading near 4,474 and continues to show a strong bullish structure across intraday and higher timeframes. Price is holding firmly above all major moving averages (MA 5–MA 200), signaling sustained buying strength.
Momentum indicators remain supportive with RSI around 59, MACD positive, and ADX above 30, confirming trend continuation rather than exhaustion.
As long as price holds above 4,470, the upside remains favored toward 4,481 → 4,489 → 4,501. Any dip toward 4,462–4,450 may be viewed as short-term profit booking, while the broader trend stays bullish unless 4,430 breaks decisively.
⚠️ Disclaimer: This content is for educational purposes only. Not financial advice.
Goldpreis

Gold may continue rising — Trading around 4,150–4,200 range📊 Market outlook:
• Spot gold is currently around 4,150 USD/oz.
• It is up roughly +0.20% (≈ +8 USD) over the past 24 hours.
• The rise is supported by expectations that the Federal Reserve (Fed) may cut interest rates soon, making non-yielding assets like gold more attractive.
📉 Technical view (short-term):
• Support zone: ~ 4,130 – 4,140 USD/oz — watch for a retracement bounce.
• Resistance zone: ~ 4,180 – 4,200 USD/oz — a breakout could trigger further gains.
• In a low-interest environment and with ongoing macro uncertainties, gold remains a safe-haven asset — bullish bias continues.
📌 Interpretation:
• In the short term, gold is likely to rise further if expectations of rate cuts remain strong.
• If U.S. economic data comes in stronger and the Fed turns hawkish → a minor correction is possible.
• Current bias: upside, but sensitive to U.S. economic data and Fed signals.
💡 Trading Strategy:
🔺 BUY XAU/USD: 4,135 – 4,132
🎯 TP: 40 / 80 / 200 pips
🛑 SL: 4,129
🔻 SELL XAU/USD: 4,185 – 4,188
🎯 TP: 40 / 80 / 200 pips
🛑 SL: 4,192

Sell Projection for XAUUSD (Gold/USD) dated 28.10.25Market Structure
Price Action: The chart shows a sideways channel breakout followed by a strong bearish engulfing candle.
This indicates a shift from consolidation to bearish momentum.
📈 Entry Setup
Entry Zone: Around the retest area near 3,984 (highlighted in blue).
Price is expected to pull back to this zone before continuing downward.
The “ENTRY FOR SELLERS & RETEST ZONE” is marked clearly in the chart.
🛑 Stop Loss
Stop Loss Level: ~ 4,008.551
Positioned above day resistance, giving enough buffer to avoid fake breakouts.
🟢 Target
Target Price: ~ 3,950.397
This level aligns with monthly support, giving a clean RR (Risk-to-Reward) structure.
⚡ Additional Notes
Day Resistance: 3,984.320
Monthly Support: 3,950.397
Breaked the sideways channel: This is the key trigger zone that shows bearish pressure building.
If price rejects the retest zone strongly, it can accelerate toward the target quickly.
📊 Summary of the Trade Idea
Setup Element Details
Pair XAUUSD / Gold
Direction Sell
Entry Zone 3984
Stop Loss 4008.551
Target 3950.397
Structure Sideways Breakout → Retest → Sell
Confirmation Candle Bearish Engulfing
✅ Trading Tip: Wait for clear rejection or bearish confirmation at the entry zone (e.g., wick rejection or engulfing candle) before executing the sell.

GOLD (XAUUSD) 1H CHART ANALYSIS – BEARISH SETUP AHEADGOLD (XAUUSD) 1H CHART ANALYSIS – BEARISH SETUP AHEAD
🔍 Technical Overview
Current Price: Around $4,036 – $4,040
Trendline: A key uptrend line (blue) has been broken, signaling weakening bullish momentum.
Resistance Zone: Between $4,058 – $4,062, marked by red arrows 🚫
Support Zone: Near $3,930 – $3,940, highlighted by the purple box 🟪
📊 Market Structure
The market recently made a lower high formation after failing to break above $4,062, indicating bearish divergence.
Multiple rejection candles at the resistance zone confirm selling pressure 💣.
The blue projection lines suggest a potential bearish retracement back toward the support zone around $3,930.
🧭 Key Levels
Type Price Level Notes
🔺 Resistance 4,058 – 4,062 Double top zone, strong sellers present
⚖️ Mid-Level 4,000 Psychological round number, interim support
🟣 Support 3,930 – 3,940 Major buying interest, possible reversal zone
📉 Expected Price Action
🔻 Scenario 1 (Primary):
Price may retest $4,050 – $4,060 resistance area, form another rejection, and drop toward $3,940 support.
Potential short entry near $4,050 – $4,060
Target $3,940
Stop loss above $4,070
🔄 Scenario 2 (Alternative):
If the price holds above $4,060, a breakout could trigger a bullish continuation toward $4,100+.
🧠 Trader’s Insight
⚠️ Bearish bias remains valid while below $4,060.
🕒 Watch for price reaction around the trendline retest and confirmation candles (bearish engulfing or pin bars).
📈 Smart traders might wait for confirmation below $4,000 before adding short positions.
💬 Summary
➡️ Bias: Bearish below $4,060
➡️ Target: $3,940
➡️ Invalidation: Break and close above $4,070
📍 “Trendlines break fast, but support zones hold stronger — trade smart, not fast.”

Gold - Buy near 3640, target 3657-3674Gold Market Analysis:
Yesterday, gold prices saw a wild swing throughout the day due to the CPI. Gold initially fell, breaking support at a low near 3613. Buying activity took off immediately on the data. Today, we're still looking for volatility. Keeping in mind the broader trend, buying into volatility is more likely to follow a pullback. Furthermore, this volatility has broken through the previous downtrend channel. Today marks the weekly close, and barring any major surprises, the weekly chart will likely close positive. Next week, gold will continue to reach new highs, and a break of 3700 is imminent. The daily moving average has already crossed the K-line, making further volatility less likely. Focus on buying into the upside today. Consider buying opportunities in the Asian session first.
The chart shows support near 3640, the primary support level for the day. Today, we'll target 3640 for buy orders, keeping an eye on resistance at 3657. If it breaks through and then retraces in the Asian session, we can buy directly. The recent trend in gold requires aggressive buying, otherwise it's often difficult to find significant support. Since it's Friday, gold is unlikely to behave normally, so we must be wary of unusual fluctuations.
Support is at 3640 and 3629, while resistance is at 3657 and 3674. 3640 is the dividing line between strength and weakness.
Fundamental Analysis:
The CPI estimate was 2.7%, while the market expected 2.9%, and the price also reached 2.9%. Both market expectations and results were higher than the estimate, which would have weighed on gold in the long term. However, gold did not fall, but instead surged.
Trading Recommendations:
Gold - Buy near 3640, target 3657-3674

How long can the gold "carnival" last?Market News:
Spot gold maintained its overnight volatile trend in early Asian trading on Friday (September 12), currently trading around $3,636/oz. International gold prices fluctuated sharply due to the impact of US CPI and initial jobless claims data. London gold prices rebounded sharply after a sharp drop, paring most of the day's losses and ultimately closing slightly lower. Weak employment and a decline in the PPI have reinforced market expectations of a Federal Reserve rate cut next week. With interest rate expectations shifting toward easing, gold is expected to maintain its strength, but key factors remain in the Fed's policy stance following the meeting. The Fed's monetary policy direction remains the strongest indicator for the gold market, and current market consensus sees a rate cut next week as a certainty. Focus on the UK's July GDP data and the US University of Michigan's preliminary September Consumer Confidence Index on August 8 this trading day, and monitor geopolitical developments.
Technical Analysis:
Weaker-than-expected inflation and initial jobless claims data reinforced expectations of a Fed rate cut. The US dollar index fell in response, ultimately closing down 0.31. Technically, the daily chart showed alternating bearish and bearish trends, with the price closing above the 5-day moving average. Yesterday, support was found again after testing 3612/15. The 10/7-day moving averages moved up to 3690/16, and the RSI indicator was converging above the 70 level. From a 4-hour perspective, support is currently focused around 3610-15. Buying on intraday dips to this level will continue to support the bullish trend. The short-term buying barrier remains at 3600. If the daily chart stabilizes above this level, continue buying on dips. On the 4-hour chart, the price has retreated to the middle Bollinger Band at 3630, converging with the moving average. The RSI indicator is trading above its mid-axis. On the hourly chart, the Bollinger Bands are closing, the RSI is flattening, and the moving averages are converging. The main trading strategy for Friday's pullback remains to buy at low prices. The weekly chart forecasts another bullish candlestick pattern. However, gold prices are trapped within a wide, volatile short-term structural channel, with high-priced selling participating.
Trading strategy:
Short-term gold: Buy at 3620-3623, stop loss at 3612, target at 3640-3660;
Short-term gold: Sell at 3657-3660, stop loss at 3669, target at 3630-3610;
Key points:
First support level: 3628, second support level: 3615, third support level: 3600
First resistance level: 3658, second resistance level: 3667, third resistance level: 3680

Gold: Buy around 3624, target 3660-3674Gold Market Analysis:
Yesterday, we placed a sell order at 3655, then sold all our profits at 3646 in the US market. Yesterday's market saw a surge followed by a decline. The market fluctuations we predicted in yesterday's blog post were all correct. Gold is currently fluctuating at a high level in the short term. In this market, there are opportunities for buying and selling if you capitalize on the market's rhythm. Today, I predict gold will continue to fluctuate and correct before the CPI data is released. Capitalizing on this rhythm, both buying and selling are possible. Today, we are focusing on 3620. If this level breaks, we will consider a short position. Otherwise, we are looking for high-level fluctuations. The long-term trend is still a buy. We made it clear yesterday that long-term trends require time and space to develop. Yesterday's small positive close on the daily chart confirms our analysis. The 5-day moving average is beginning to rise. The volatility will not last long, and results will be seen soon. During the Asian session, we're focusing on the strong support band of 3620-3625. This level is also a buying opportunity for a rebound. Resistance is at 3657, yesterday's rebound high. We anticipate the market to fluctuate within this range. A break above 3657 will open up further upside, and a pullback could be considered a buying opportunity. Volatility occurs when a surge reaches resistance, and further gains are more likely after the volatility ends.
Support is 3620-3625, with strong support at 3600. Resistance is at 3647 and 3657, with 3647 being the dividing line between strength and weakness.
Fundamental Analysis:
The most important CPI data this week will be released today. The recent surge in gold prices is driven by increased market expectations for a September rate cut by the Federal Reserve. This CPI may be the final reference data the Fed uses.
Trading Recommendation:
Gold: Buy around 3624, target 3660-3674

Analysis of subsequent gold price trendsMarket News:
Spot gold saw slight gains in early Asian trading on Thursday (September 11th), currently trading around $3,545 per ounce. International gold prices continued their strong performance. Amidst softening US inflation data and widespread market bets that the Federal Reserve will initiate an interest rate cut next week, spot gold prices are approaching all-time highs, with related gold stocks and mining company indices simultaneously reaching record closing highs. The current strength in the gold market stems from a combination of weak US economic data, geopolitical risks, and the Federal Reserve's policy shift. While gold prices may fluctuate in the short term due to CPI data, the overall bull market is firmly in place, with a year-to-date gain of over 39% suggesting further upside potential. Gold prices continue to approach record highs, driven by unexpectedly weak inflation data, market confidence in an imminent Fed rate cut, and increased safe-haven demand. Industry analysts predict that if the Federal Reserve embarks on an easing cycle, gold will likely continue to attract investors, potentially reaching $3,900 per ounce by the end of the year.
Technical Analysis:
Gold has entered a period of volatile adjustment. Yesterday, it fell before rising, consolidating in a wide range around 3620/3660. Technically, the weekly and daily charts remain within a buying trend channel. The daily chart retraced its course below 3620 before stabilizing and rising strongly above 3658, closing above 3640. The daily chart closed with another positive candlestick pattern. The moving averages remain upward, with the 5-day MA moving average moving up to 3626. The hourly Bollinger Bands are converging, with the moving averages converging. The RSI indicator is retracing to its mid-50 level. On the four-hour chart, gold prices remain within the upper Bollinger Bands, with the moving averages converging. Technically, gold trading continues to see wide range-bound adjustments, with buyers buying at low prices and selling high. Fundamentals: Today's US PPI inflation data will be a key focus!
Trading strategy:
Short-term gold: Buy at 3627-3630, stop loss at 3618, target at 3660-3680;
Short-term gold: Sell at 3660-3663, stop loss at 3672, target at 3630-3610;
Key points:
First support level: 3626, Second support level: 3612, Third support level: 3600
First resistance level: 3666, Second resistance level: 3680, Third resistance level: 3696

XAU/USD(20250911) Today's AnalysisMarket News:
The U.S. PPI annual rate for August hit 2.6%, the lowest since June. Traders are increasing bets on a Federal Reserve rate cut.
Technical Analysis:
Today's buy/sell levels:
3639
Support and resistance levels:
3676
3662
3653
3625
3616
3602
Trading Strategy:
If the market breaks above 3653, consider buying, with the first target at 3662.
If the market breaks below 3639, consider selling, with the first target at 3625.

Gold: Buy near 3604, target 3640-3668Gold Market Analysis:
Yesterday, we placed buy orders at 3643, 3635, 3642, and 3651. Yesterday's strategy was to maintain a bullish outlook. Gold surged and then retreated, with the daily chart closing at a tombstone, signaling new short-term resistance. Many investors believe this is a top, but the current top still needs to be confirmed. The broader trend indicators and pattern are still bullish. On the daily chart, a break below 3600 today will not change the strength of the daily chart and the candlestick pattern. Therefore, it's too early to call a top. This weekly rally is a weekly one, and a top requires time and space to be established. Today, we'll focus on a correction and volatility. Don't insist on buying today, but consider selling opportunities. After all, a correction isn't a one-sided rally, and there's plenty of room for subsequent fluctuations.
The above analysis chart represents our estimated correction. Focus on 3649 in the Asian session. If it fails to break above, we'll look for strong support below and then rally again. If the market defies our guidance and rises directly, we can consider buying at this point. However, yesterday's high of 3674 was also a selling zone. Today, we need to observe the market and adjust our strategy accordingly. Regardless of fluctuations, the overall trend remains bullish. Currently, there's no sign of a break below major support. The first major support is at 3600. We'll focus on its gains and losses today.
Minor support lies at 3620 and 3630, while resistance lies at 3649 and 3658. The dividing line between strength and weakness lies at 3649.
Fundamental Analysis:
Today, focus on the EIA crude oil inventory data. The CPI will be released tomorrow, and this week's major move will also be tomorrow.
Trading Recommendations:
Gold: Sell near 3649, target 3620-3600
Gold: Buy near 3604, target 3640-3668

Global central banks are buying gold! Gold prices are soaring!Market News:
In early Asian trading on Tuesday (September 9), spot gold prices fluctuated at high levels, currently trading around $3,636 per ounce. London gold prices, like a runaway force, broke through the $3,600 per ounce mark and ultimately reached a new all-time high of $3,647. This was primarily due to the US non-farm payroll data released last week, which fell far short of expectations, reinforcing the possibility of a Federal Reserve interest rate cut next week, with a 10% chance of a 50 basis point reduction. In addition to monetary policy expectations, continued gold purchases by global central banks have provided solid support for the international gold market. Meanwhile, global political dynamics are also fueling gold's upward trend. Any rapid rise in asset prices is accompanied by increased volatility. When positive news is fully digested by the market, be wary of the possibility of a volatile pullback triggered by profit-taking by long positions. Investors await Wednesday's Producer Price Index (PPI) and Thursday's Consumer Price Index (CPI) data to gauge the Federal Reserve's policy path. The Bureau of Labor Statistics will release revised non-farm payroll figures this trading day, which investors should pay close attention to. Furthermore, investors should monitor news related to the Russia-Ukraine geopolitical situation.
Technical Analysis:
Gold's trend-buying structure remains intact, reaching a new all-time high of 3646. The daily chart is currently moving upwards along the 5-day moving average, with the 10-day and 7-day moving averages opening at 3524 and 3570, respectively. The RSI indicator has reached the overbought zone at the high 80s, prompting caution for a pullback and correction. The recent consecutive gains require some technical adjustments, so we should remain cautious about overly bullish gold prices and remain wary of potential pullbacks. Looking at the 4-hour gold chart, short-term support is currently focused on the 3610 level, with particular attention focused on the 3575-83 support level. This level also serves as a strong short-term buying zone. Continued buying at this level within the day maintains a bullish outlook. As long as the daily chart does not break below this level, buying at lower prices on a pullback is the primary strategy. The 4-hour moving average remains upward, with prices within an ascending channel and within the upper Bollinger Band. The RSI is at a high of 80. Gold's technical outlook remains bullish, and the key trading strategy remains to buy on dips (short-term buying) and sell on highs (swing trading). Be wary of potential pullbacks after overbought conditions.
Trading strategy:
Short-term gold: Buy at 3610-3613, stop loss at 3600, target at 3640-3660;
Short-term gold: Sell at 3667-3670, stop loss at 3679, target at 3620-3600;
Key points:
First support level: 3620, second support level: 3613, third support level: 3600
First resistance level: 3640, second resistance level: 3655, third resistance level: 3678

XAU/USD(20250909) Today's AnalysisMarket News:
New York Fed Survey: Consumers expect unemployment and job losses to rise, and the Fed is expected to cut interest rates next week.
Technical Analysis:
Today's Buy/Sell Levels:
3620
Support and Resistance Levels:
3686
3661
3645
3595
3579
3554
Trading Strategy:
If the market breaks above 3545, consider buying, with the first target at 3661.
If the market breaks below 3620, consider selling, with the first target at 3595.

Gold's historic rally continues!Market News:
In early Asian trading on Monday (September 8), spot gold prices fluctuated within a narrow range, currently trading around $3,597/oz. Influenced by exceptionally weak US non-farm payroll data, spot gold prices surged, reaching $3,600/oz in London, a record high. The market now believes there is approximately a 10% chance that the Federal Reserve will cut interest rates by 50 basis points in September. Investors should be wary of the risk of a significant rate cut at this meeting. From a broader perspective, the fundamentals of international gold are exceptionally strong. Non-yielding gold has stood out in an environment of low interest rates and high uncertainty. This rally is not a flash in the pan; it is built on a solid foundation of multiple factors, including a weak US dollar and expectations of a global economic slowdown. Another major pillar of gold's gains is continued central bank buying. In addition to domestic US economic factors, international geopolitical turmoil has also provided strong support for gold. Gold traders are focused on this week's US Consumer Price Index (CPI) data. If progress is made in combating inflation, this will strengthen the case for a rate cut at the September 16-17 meeting. Market sentiment for rate cuts has reached its limit. A slight rise in the CPI may lead to temporary caution in international gold prices, but the overall bull market remains intact.
Technical Analysis:
Non-farm payroll data fueled gold buying, extending the trend structure and reaching a new all-time high. Spot gold prices hit another all-time high, posting their strongest single-week gain. Weak US non-farm payroll data further heightened expectations of a Fed rate cut, and amidst growing global economic uncertainty, gold's strong rally has gained new momentum. The weekly chart showed a strong bullish trend. After seven consecutive daily gains, the eighth candlestick formed a small bearish retracing line, retracing to the 3516 level. After a correction, the 5-day moving average regained support. Following Friday's positive non-farm payroll data, gold once again broke through its all-time high, reaching the 3600 mark, driven by the convergence of technical and fundamental factors. The daily candlestick structure remains a buy signal! Price is trading within the upper Bollinger Band, with the RSI nearing the 80-day mark. The latest 10/7-day moving averages are moving upward to 3498/35. The daily and weekly trends remain bullish, but the RSI is approaching overbought territory, prompting caution for potential corrections. On the four-hour chart, price is trading within the upper middle Bollinger Band, with the moving averages remaining upward, maintaining its upward trend. The trading strategy for gold at the start of the week continues to be primarily buy-on-low.
Trading Strategy:
Short-term gold buy at 3572-3575, stop loss at 3564, target at 3600-3620;
Short-term gold sell at 3636-3639, stop loss at 3648, target at 3590-3570;
Key Points:
First Support Level: 3572, Second Support Level: 3555, Third Support Level: 3538
First Resistance Level: 3600, Second Resistance Level: 3616, Third Resistance Level: 3636

Gold: Buy around 3578, target 3599-3620Gold Market Analysis:
Friday's gold buying was strong again, driven by two factors: a pre-existing buying trend, and the disappointing non-farm payroll data, which bolstered gold's safe-haven appeal. We also placed buy orders at 3544. Before the non-farm payroll report, the price broke through 3561 again, and all of our buy orders were profitable. The weekly chart ultimately closed with a large, clear bullish candlestick. The buying trend is undeniable. I've always adhered to the principle of not speculating on tops or trends; we aim to follow them, not fight them. Currently, both indicators and patterns clearly indicate a buying trend. This week, we'll focus on the gains and losses of 3523 on the weekly chart. Unless it breaks, it's difficult to call a top, nor will it disrupt the buying pattern. Let's look for buying opportunities in the Asian session. First, focus on support at 3578-3572. 3578 represents the previous top of the pattern and also serves as a minor short-term support level. The low point of Friday's correction from the high was 3572, indicating this level has become a new minor support level. Consider buying at this level in the Asian session. Slightly stronger support is the 1H support at 3562, also the daily moving average. Buying here is certain to trigger another rebound. Friday's gains were quite significant, and with the 3600 mark approaching, we predict either a pullback and subsequent rally, or a direct break below 3600. A direct decline is unlikely. For the first option, wait for a buying opportunity; for the second option, consider buying directly.
Support is 3578-3572, strong support is 3562, resistance is 3500, and the strength-weakness dividing line is 3562.
Fundamental Analysis:
Last week's non-farm payroll data showed a figure of 22,000, compared to expectations of 75,000 and a previous estimate of 79,000. This result is quite disappointing. In short, fewer US jobs mean a weakening economy, which in turn leads to a rise in gold prices. This week, we'll keep an eye on the CPI.
Trading Recommendations:
Gold: Buy around 3578, target 3599-3620

Analysis of subsequent gold price trends!Market News:
In early Asian trading on Wednesday (September 10), London gold prices fluctuated downward, currently trading around $3,621 per ounce. After hitting a record high of $3,674, the spot price plummeted nearly $50, ultimately ending the day in the red. International gold prices have recently seen a sharp rise, with some investors taking profits ahead of the release of key US inflation data, triggering a pullback from their highs. Although the revised employment data released by the US Department of Labor fell short of market expectations, gold buyers took advantage of the opportunity to take profits. The rebound of the US dollar index from a seven-week low and US Treasury yields from a near five-month low also made gold buyers cautious. Furthermore, the continued rise of US stocks to new record highs has slightly weakened gold's safe-haven demand. Investors are currently awaiting US producer price data (PPI) to be released on Wednesday and consumer price data (CPI) to be released on Thursday, hoping for clues on further interest rate cuts before next week's Federal Reserve meeting. These data are expected to provide new guidance for gold prices.
Technical Analysis:
Gold closed with an inverted hammer candlestick pattern on the daily chart. After hitting a record high of 3674 following yesterday's US market data, the price, as expected, capitalized on the data to drive selling, resulting in the largest single-day correction since August 20th. The daily chart currently maintains an ascending channel buying trend. The 10-day and 7-day moving averages remain open and rising to 3550/3590, while the New York closing price remains above the 5-day moving average of 3605. After the RSI indicator on the four-hour chart reached overbought levels above 80, gold prices followed the expected surge and then retreat to a correction, falling back to 3623 in late trading. However, gold prices remain within the upper Bollinger Bands, with the moving averages converging. The main strategy for gold trading today is to see wide range fluctuations, with selling high and buying low as a strategy. The initial intraday range is 3610/3660. Overall, gold is expected to experience repeated high-level fluctuations in the short term, and any strong rebound may not be sustainable. If this week's correction breaks below the strong support of $3,600 and further declines, we will need to adjust our strategy!
Trading Strategy:
Short-term gold buy at 3,603-3,606, stop loss at 3,595, target at 3,640-3,660;
Short-term gold sell at 3,650-3,653, stop loss at 3,662, target at 3,620-3,600;
Key Points:
First Support Level: 3,612, Second Support Level: 3,603, Third Support Level: 3,590
First Resistance Level: 3,650, Second Resistance Level: 3,663, Third Resistance Level: 3,676

Gold - Buy around 3627, target 3680-3699Gold Market Analysis:
Is gold trading aggressive today? Those who prefer to intercept and counter-trend trades and avoid losses are already questioning their lives. The market is like this; it's always right. Yesterday, we analyzed a long position at 3578, but the lowest point was only 3579. It's better to miss out on such a market than to make a mistake. In a one-sided rally, making a mistake is the most damaging. Today's approach remains bullish, and we're watching for buying activity. A surge doesn't have a top, and no one knows where it will be. Based on the current momentum, 3700 is just around the corner. Gold is advancing cautiously, with the daily chart pattern beginning to rise, and buying indicators are also rising. The 5-day moving average has already reached around 3594. There are essentially no selling opportunities above 3594. Yesterday's Monday rally actually exceeded market expectations. This week, I predict gains from Monday to Wednesday, with a daily correction expected on Thursday and Friday, but it will only be a correction, not a major drop. In today's Asian session, we will look for buying opportunities at support at 3627. This level provides minor support in the 1-hour chart and also supports hourly indicators. The Asian session has already reached a new high, indicating continued strength. Buying is recommended. If the price unexpectedly breaks below 3627, we will look for support in the 4-hour chart before buying. We are not considering selling during the Asian session.
Support is 3627, with strong support at 3600 and 3594. Resistance is not visible, and the market's strength-weakness dividing line is 3600.
Fundamental Analysis:
The previous sharp drop in non-farm payroll data led to a surge in gold prices. This week, we will monitor CPI data.
Trading Recommendations:
Gold - Buy around 3627, target 3680-3699

Crazy gold! Buy or wait for a pullback?Market News:
Spot gold prices fluctuated narrowly in early Asian trading on Friday (September 5th), currently trading around $3,550 per ounce. International gold, a traditional safe-haven asset, hit a record high of $3,578 per ounce on Wednesday amid growing global economic uncertainty. The London gold price declined after reaching a record high, primarily due to profit-taking by traders. After a strong rally, the market accumulated a large amount of long positions, and many investors chose to cash in their profits at the peak, leading to a short-term price decline. Traders are focused on the upcoming US non-farm payroll report, which could directly influence the pace of the Federal Reserve's interest rate cuts and, in turn, the price of gold. In the current environment, weak employment indicators reinforce expectations of rate cuts and support gold's safe-haven demand. However, if the data exceeds expectations, gold may face further pressure.
Technical Analysis:
After seven consecutive days of gains, gold experienced a sharp drop yesterday, closing with a long lower shadow on the daily chart. Technically, this closing pattern is often a continuation of an upward trend, as prices remain within the ascending channel. Furthermore, a double top or head-and-shoulders top pattern has yet to emerge and establish. The daily chart retreated to yesterday's 5-day moving average at 3511, then bottomed out and rebounded. The European and American markets strengthened again, pulling back towards the 3559/60 levels. The 10-day and 7-day moving averages remained open and moved upward to 3504/3467, and the RSI indicator remained above 70. On the short-term four-hour chart, gold prices are trading within the upper middle Bollinger Band, with the moving averages converging and the hourly Bollinger Bands closing. Regarding news data, focus on the non-farm payroll report today. The market's estimate is slightly bearish, but the 4.3% increase in the unemployment rate is favorable for buying. The main strategy for intraday trading is to focus on wide range fluctuations, primarily buying on dips and selling on highs.
Trading Strategy:
Short-term gold buy at 3535-3538, stop loss at 3527, target at 3570-3590;
Short-term gold sell at 3577-3580, stop loss at 3588, target at 3540-3520;
Key Points:
First support level: 3536, second support level: 3523, third support level: 3510
First resistance level: 3562, second resistance level: 3576, third resistance level: 3590

Gold - Buy near 3540, target 3558-3578Gold Market Analysis:
The market's greatest allure lies in its ever-changing nature. Yesterday, gold plummeted in the Asian session, plummeting to around 3510. It then hit the 5-day moving average on the daily chart and rebounded rapidly. It then went on to not only rebound, but also rise in a V-shaped pattern. Your supposed sell-off was a lie. The daily chart ultimately closed with a bearish hammer candlestick pattern. The long lower shadow suggests yesterday's sharp drop was fleeting. Gold has not yet shifted its buying trend. Today is the time for the non-farm payroll report, and I predict a period of volatile correction with a buying bias. If gold can rally to a new high in the Asian session today, consider buying directly. Our approach in the Asian session is to buy low and then wait for the non-farm payroll data. It's difficult to determine whether 3578 on the daily chart is the high point, and the pattern doesn't signal a peak. The 1-hour chart shows a new support level near 3540. Buying in the Asian session is possible based on this support level. Furthermore, support from moving averages and indicators is near 3531. This level, which represents daily support, presents a buying opportunity. If gold reaches 3578 during the Asian session, do not consider selling. The strategy of buying at low prices can be maintained until the release of the non-farm payroll data.
Support levels are 3531 and 3540, while resistance levels are 3578 and 3560. The dividing line between strength and weakness is 3540.
Fundamental Analysis:
Recent fundamentals have not significantly stimulated the market. Today, we will focus on the US non-farm payroll data.
Trading Recommendation:
Gold - Buy near 3540, target 3558-3578

Gold - Sell around 3532, target 3500-3480Gold Market Analysis:
Yesterday, we planned to buy gold at 3531, and the blog post clearly stated buying at 3526. Almost all of the purchases were made at the lowest point. Gold surged to 3578 in the European and American trading sessions, closing with a strong positive daily candlestick pattern. However, gold plummeted in the Asian session, giving back all of yesterday's gains in just a few hours. Does this signal a topping? A technical pullback after a significant surge is normal, but the magnitude of the pullback has disrupted the short-term buying structure, allowing gold to re-enter a new pattern. This week is a data week, and the further into the future, the more critical the market for gold. I believe the current sharp drop is merely profit-taking ahead of the data releases, and it's not yet a definitive peak signal. The overall trend should continue to be buying today. Don't blindly buy in the Asian session. Consider selling on a short-term rebound. The 3526 level has been broken. This level is the hourly low and also the daily support level. A break of this level indicates a weakening trend. Another level is the 5-day moving average of the daily chart, 3508-3500. A significant drop below this level would confirm a short-term Yin-enclosing Yang pattern, potentially signaling the start of a major correction. We can buy and sell intraday, capitalizing on this trend. Furthermore, the 4-hour chart's consecutive reversals into the red are causing market confusion.
Support is 3508-3500, while resistance lies at 3566, 3553, and 3542. The dividing line between strength and weakness is 3526.
Fundamental Analysis:
Today we will have ADP employment and unemployment benefit data.
Trading Recommendation:
Gold - Sell around 3532, target 3500-3480

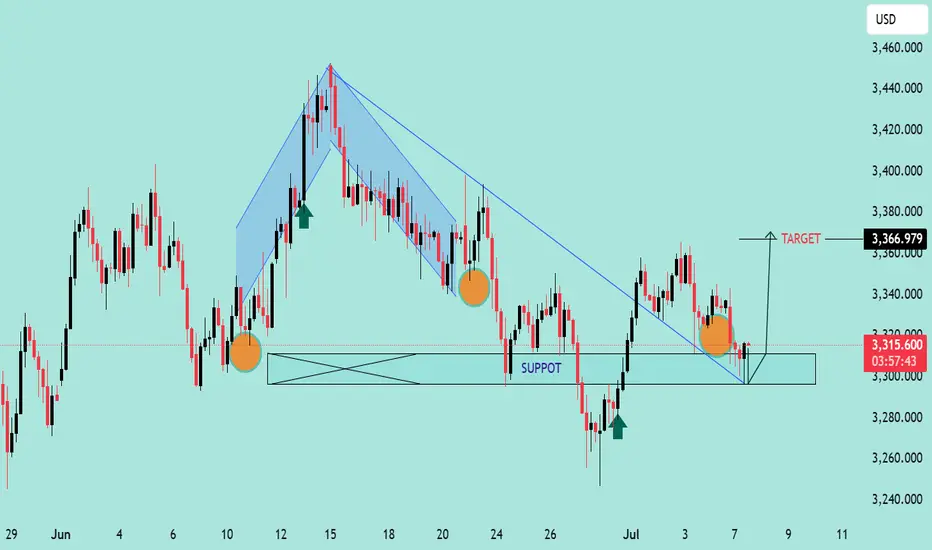
Gold/USD Bullish Reversal from Support Zone Gold/USD Bullish Reversal from Support Zone 🟢📈
Technical Analysis:
Support Zone: Price is consistently respecting the horizontal support range near 3,305 – 3,310, confirming it as a strong demand zone (marked by multiple orange circles and previous bounce reactions).
Bullish Structure: After breaking the descending trendline, the price has retested the trendline and horizontal support zone, forming a higher low — a classic bullish reversal signal.
Target Projection: The measured move projection targets a potential upside near 3,366.979, aligned with previous highs.
Bullish Candlestick Patterns: Green arrows highlight bullish price action at significant reversal points, confirming buyer strength at support.
Harmonic Pattern: The shaded harmonic pattern suggests completion near the previous lows, which aligns with the reversal zone.
Conclusion:
As long as the price holds above the support area and respects the trendline retest, bulls may push toward the projected target. A break below the zone would invalidate this bullish setup.
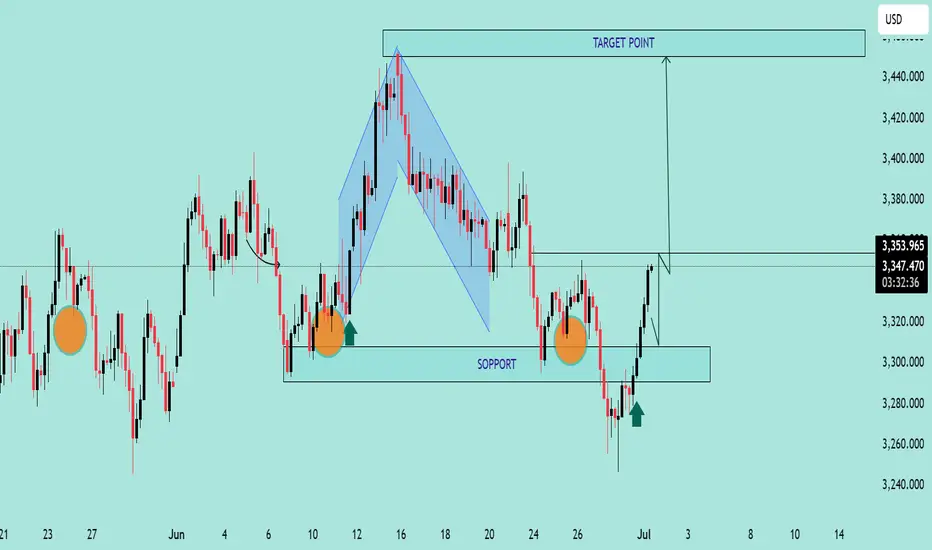
Bullish Reversal Setup on GOLD/USD Bullish Reversal Setup on GOLD/USD 💰📈
🔍 Chart Analysis:
The chart illustrates a clear bullish reversal structure forming off a strong support zone:
📌 Key Observations:
Multiple Rejections at Support 🟠
The price has reacted to the 3,300 - 3,280 USD support zone multiple times, forming a triple bottom pattern, indicating strong buyer interest.
Bullish Harmonic Pattern ✅
A bullish harmonic pattern (likely a Bat or Gartley) completed right at the support level, triggering a strong reversal with a bullish engulfing candle.
Break of Minor Structure 📊
Price broke through minor resistance near 3,340 USD, confirming bullish momentum. The breakout is supported by a retest shown with the green arrow 🟢.
Target Point Identified 🎯
The projected target is 3,460 USD, marked clearly as the next significant resistance zone. This aligns with previous price rejection areas, making it a high-probability target.
📈 Trading Outlook:
✅ Buy Confirmation: Break and retest of 3,340 USD zone.
🎯 Target: 3,460 USD.
🛡️ Support Zone: 3,300 – 3,280 USD (watch for any breakdown below this).
📌 Conclusion:
The chart signals a high-probability bullish continuation, with strong support, harmonic confluence, and structural breakout. Traders may look for buy opportunities on pullbacks with the target set at 3,460 USD. 🚀📊
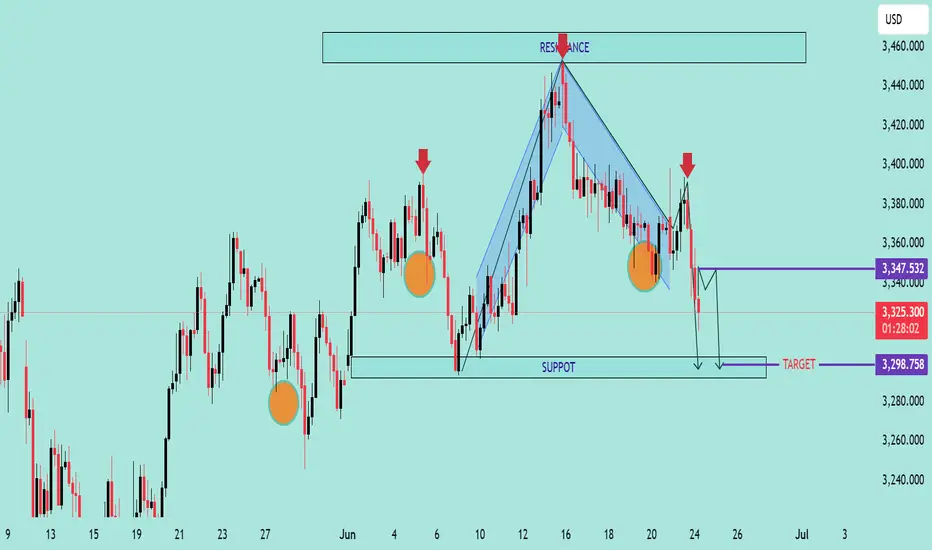
Bearish Continuation Pattern Detected on GOLD/USD Bearish Continuation Pattern Detected on GOLD/USD 📉
📊 Chart Analysis Summary:
The GOLD/USD chart shows a clear bearish continuation pattern, following a rejection from a major resistance zone.
🔍 Key Technical Highlights:
🔺 Resistance Zone:
Strong resistance at 3,420 – 3,440 USD, marked by multiple rejections (🔴 red arrows).
Price formed a Bearish Harmonic Pattern (likely a Gartley or Bat), suggesting reversal from this resistance.
🔻 Bearish Momentum:
After the pattern completed, price broke below the minor support structure and is currently forming lower highs and lower lows, indicating bearish structure.
📉 Support Level:
Strong horizontal support zone around 3,298 – 3,300 USD, marked as “TARGET.”
This area was previously tested (🟠 orange circles) and now projected to act as a target level again.
🔄 Minor Retracement Zone:
Expecting a minor pullback to 3,347 USD (purple line) before potential continuation downward.
This zone aligns with the previous support turned resistance (classic SR flip).
🎯 Target Projection:
Based on the bearish impulse and measured move, the projected target is around 3,298.758 USD, which coincides with the previous support zone.
📌 Conclusion:
The price action suggests a high-probability bearish continuation, targeting the 3,298 USD zone unless the price breaks and holds above 3,347 USD. Traders may consider selling on rallies with a confirmation of rejection at resistance.
📉 Bias: Bearish
📍 Invalidation: Break and daily close above 3,347 USD
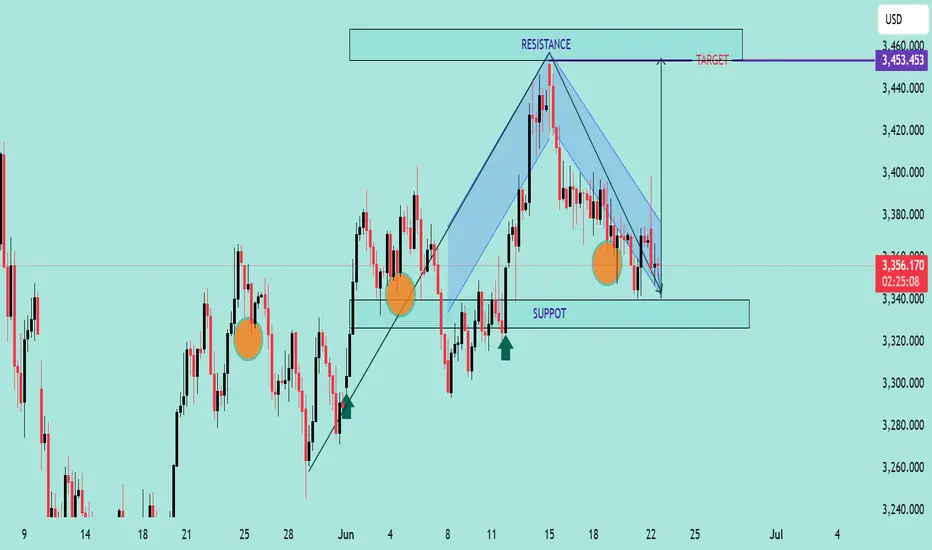
GOLD/USD Falling Wedge Breakout PotentialChart Analysis:
The chart illustrates a Falling Wedge Pattern, a bullish reversal setup typically signaling a breakout to the upside.
📌 Key Observations:
📉 Downward Channel: Price has been compressing within a falling wedge (highlighted in blue), indicating potential exhaustion of sellers.
💪 Support Zone: Strong support observed near the 3,340 level, with price rejecting this zone multiple times (highlighted with orange circles).
🔼 Bullish Signals: Price recently tested the lower wedge boundary and bounced, suggesting potential reversal.
🎯 Breakout Target: Projected target after breakout is around 3,453.453 USD, aligned with previous resistance zone.
🟢 Buy Pressure Arrows: Green arrows signal previous bullish reactions from similar demand zones.
📈 Conclusion:
If price breaks above the wedge’s upper boundary with volume confirmation, a bullish rally toward 3,453 is expected. Keep an eye on breakout retest for entry validation.
✅ Trading Plan Suggestion:
Entry: On breakout above wedge resistance
SL: Below recent swing low (~3,330)
TP: 3,453 zone 🎯
🔔 Note: Wait for a confirmed breakout before entering to avoid false signals.