GOLD/USD Bearish Rejection at Resistance ZoneGOLD/USD Bearish Rejection at Resistance Zone 📉🟥
📊 Technical Overview:
The chart for GOLD/USD shows a clear price action behavior between a well-defined resistance zone (~3,480–3,510) and a support zone (~3,260–3,280).
🔻 Bearish Signals:
The price has tested the resistance zone multiple times (highlighted with red arrows and orange circles) but failed to break above it, indicating strong selling pressure.
The current price action suggests another lower high formation, which is a bearish signal 📉.
Recent candles are rejecting the upward move, pointing to potential downside movement.
🟩 Support Confirmation:
Previous reactions from the support zone (green arrows) show that buyers have consistently stepped in near the 3,260–3,280 range.
This level remains a key demand zone where a bounce might be expected.
🔁 Outlook:
If the price continues to reject the resistance and follows the pattern, we might see another drop towards the support area.
A break below the support zone would confirm a bearish breakout and could open the door to deeper downside targets.
📌 Conclusion:
GOLD/USD is trading within a range, but the repeated failures at resistance suggest bearish momentum might take control in the short term. A move back toward the support zone is likely unless a breakout above resistance occurs.
📉 Resistance: 3,480–3,510
🟩 Support: 3,260–3,280
🔍 Bias: Short-term Bearish unless resistance breaks
Goldpreis

XAU/USD Bullish Continuation SetupThe chart illustrates a bullish market structure for XAU/USD, with price action currently trending upwards. Key technical observations:
Support Zone:
Price has recently bounced from a support zone around 3,399.710, indicating strong buying interest.
Bullish Projection:
A bullish continuation is expected. The chart outlines a potential scenario with a minor retracement towards 3,432.835 or 3,399.710, followed by a strong upward move.
Targets:
Immediate resistance is around 3,502.669.
If broken, price may aim for 3,550.351.
Final projected target lies near 3,680.000, which aligns with a historical supply zone.
Indicators:
The green enveloping bands suggest increasing volatility, with the price respecting the upper band, supporting bullish momentum.
Conclusion:
XAU/USD appears poised for a bullish breakout continuation. A potential pullback could offer a buy opportunity, targeting higher resistance zones as long as the structure remains intact.

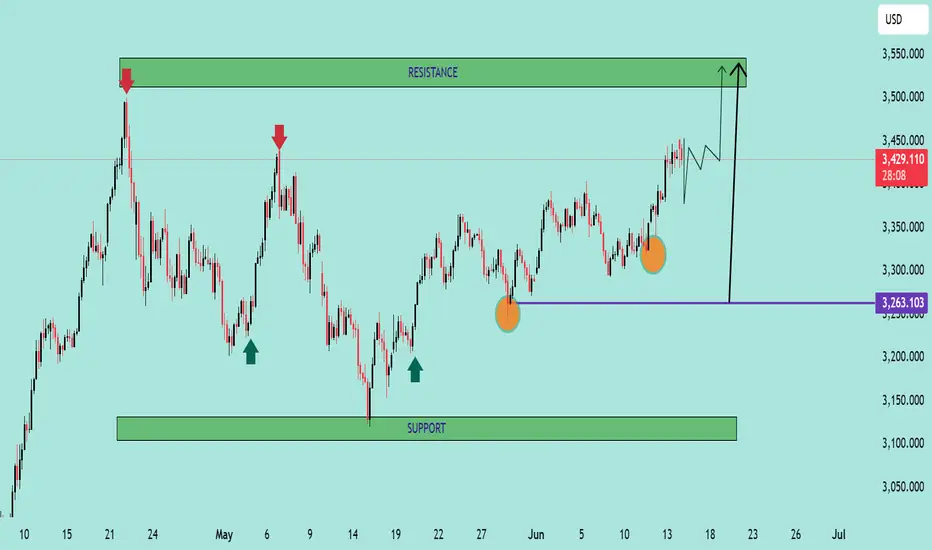
GOLD/USD – Bullish Reversal Pattern ForminGOLD/USD – Bullish Reversal Pattern Forming 🟢📈
📊 Chart Analysis:
The chart shows a strong Inverse Head and Shoulders pattern forming, which is a classic bullish reversal signal:
🔹 Left Shoulder and Right Shoulder – Marked with orange circles, both found support near the 3,263 level (purple line), suggesting strong buying interest at this zone.
🔹 Head – The lowest point in between the shoulders, also bouncing from support.
🔹 Resistance Zone – Marked with red arrows around 3,500–3,520. This zone has rejected price action multiple times in the past.
🔹 Support Zone – Marked below 3,200, where previous consolidation and buying took place.
📈 Projected Move:
The neckline breakout suggests a potential move toward the 3,520+ level. A minor pullback is expected before continuation. If price breaks above resistance, we could see a strong bullish rally.
📌 Key Levels:
Support: 3,263 🟩
Resistance: 3,500–3,520 🟥
Potential Target After Breakout: 3,550+ 🎯
✅ Bias: Bullish above 3,263 support
⚠️ Invalidation: A break below the neckline would cancel the bullish setup
GOLD/USD Bullish Breakout Confirmation GOLD/USD Bullish Breakout Confirmation 🚀📈
📊 Technical Analysis Overview:
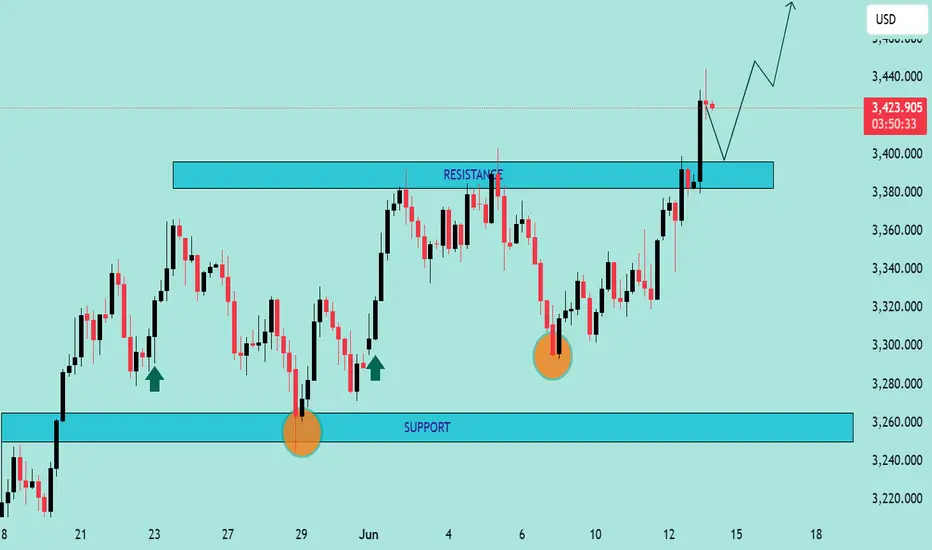
The chart illustrates a bullish breakout above a well-defined resistance zone around $3,390–$3,400. Price action has decisively closed above this resistance, suggesting strong bullish momentum.
🔍 Key Observations:
🟦 Support Zone:
Marked clearly between $3,250–$3,280, this level has held firm multiple times (highlighted with green arrows and orange circles), confirming buyer interest and market structure.
🟦 Resistance Turned Support:
The previous resistance zone around $3,390–$3,400 has now potentially turned into a new support. Price retesting this zone and holding would further validate the breakout.
📈 Future Projections:
The chart anticipates a retest-pullback-continuation scenario:
Pullback to new support 📉
Bullish continuation toward $3,460+ 🎯 if support holds.
✅ Bias:
Bullish as long as price remains above the $3,390 zone. Break and hold below would invalidate the bullish setup.
📌 Strategy Tip:
Look for confirmation on the lower timeframes (e.g., bullish engulfing or pin bar) on the retest before entering long.
GOLD PRICE ACTION ANALYSIS – June 11, 2025 GOLD PRICE ACTION ANALYSIS – June 11, 2025 🟡
Technical Breakdown & Bearish Scenario Ahead ⚠️📉
🔍 Overview:
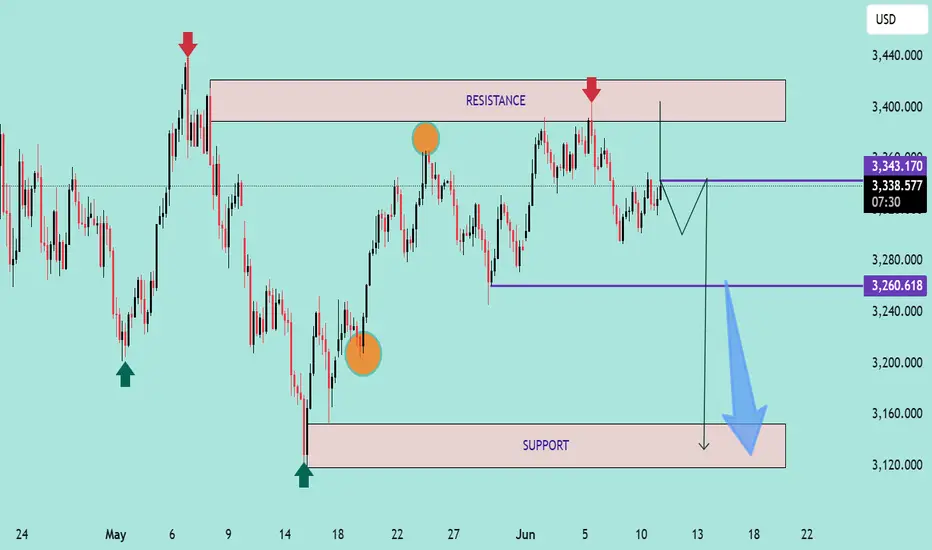
The chart presents a clear range-bound structure with strong horizontal resistance around the $3,400–$3,420 zone and support around the $3,120–$3,160 level. Price is currently trading near the upper range of the consolidation.
📊 Key Technical Levels:
🔴 Resistance Zone: $3,400 – $3,420
➤ Price has been rejected here multiple times (highlighted by red arrows and orange circles), showing strong supply pressure.
🟣 Intermediate Support: $3,260.618
➤ This level acted as a minor support and could be tested again if the current pullback deepens.
🟤 Major Support Zone: $3,120 – $3,160
➤ A key demand area where price previously bounced significantly.
📉 Bearish Setup:
A potential lower high is forming just below the resistance zone.
The projected path suggests a minor pullback to form a bearish retest, followed by a potential breakdown below $3,260.
If the $3,260 support is broken decisively, further downside toward the $3,120–$3,160 support is likely (blue arrow projection).
🔄 Bullish Scenario (Invalidation):
A breakout and strong close above $3,420 could invalidate the bearish structure.
In that case, price might attempt to target higher resistance levels beyond $3,440.
📌 Conclusion:
Gold remains in a range with a bearish bias unless the $3,420 resistance is breached.
🔽 Watch for confirmation below $3,260 for bearish continuation.
✅ For bulls, wait for a strong breakout above resistance with volume.
XAUUSD/GOLD 4H BUY PROJECTION 25.05.25🟢 Overall Bias: BUY Projection
The chart suggests a bullish outlook, predicting that gold will rise significantly after a breakout and retest pattern.
🔍 Key Technical Elements:
Trendlines:
4H Downtrendline: This was a significant resistance trendline that has now been broken.
4H Uptrendline: Indicates a recent shift to bullish momentum.
Support & Resistance Zones:
Support S1: A solid demand zone around 3,275–3,300 USD.
Immediate Support: Zone around 3,325 USD.
Resistance R1, R2, and R3: Key resistance levels.
R1: ~3,375 USD
R2: ~3,425 USD
R3 & ATH (All-Time High): ~3,500+ USD
Breakout Confirmation:
The price broke above the 4H Downtrendline and Resistance, and then retested that area successfully, confirming it as new support (highlighted by the box labeled "BREAKER RESISTANCE RETESTED AND BROKE TRENDLINE").
Change of Character:
Marked in the zone labeled "CHANGE OF CHARACTER APPEARED HERE", indicating a shift from bearish to bullish market structure.
📈 Price Projection:
The price is projected to move upwards through multiple resistance zones, eventually targeting the 3,500 USD+ region.
Arrows indicate a bullish path with minor pullbacks, moving towards:
Resistance R1 → Resistance R2 → Resistance R3 (ATH).
🟥🟩 Risk Management:
Stop-Loss Zone (Red Area): Below 3,300 USD – in case the breakout fails and the price re-enters the downtrend.
Target Zone (Green Area): Extends to 3,500+ USD – aligning with historical highs.

Gold (XAU/USD) Bullish Breakout Trade Setup – Targeting $3,4201. Entry Point Zone (~3,302.88 - 3,317.09):
This is the area where a long position (buy) is suggested.
The price has already moved slightly above this zone, indicating the trade may have already been triggered.
2. Stop Loss (~3,260.41 - 3,299.02):
Positioned below the entry zone to limit downside risk.
Suggests that if the price drops below this support zone, the trade idea is invalidated.
3. Target Point (3,420.41):
A bullish target suggesting a potential upside move of ~117.62 points (or ~3.56%).
This zone acts as a take-profit level.
4. Technical Indicators:
Moving averages (possibly 50 EMA in red and 200 EMA in blue) show a bullish crossover recently, supporting the upward momentum.
5. Pattern Outlook:
The chart implies a possible cup-and-handle or bullish consolidation breakout pattern, anticipating continuation upward.
Summary:
The strategy depicted is a bullish breakout setup:
Buy near 3,302.88–3,317.09
Stop Loss near 3,260–3,299
Take Profit near 3,420
This setup favors buyers as long as the price remains above the stop-loss zone. If the market holds this structure, there's a good risk-reward ratio for a move to 3,420.41.

XAU/USD) Buy Trade Setup – Entry, Target & Risk Management Plan Entry Point:
3,140.34 USD
This is the suggested level to enter a long (buy) trade.
Stop Loss (SL):
3,121.66 USD
A protective level to limit losses if the trade goes against the setup.
Target Point (Take Profit - TP):
3,251.33 USD
This is the EA target point — where profits are expected to be taken.
---
3. Risk/Reward Ratio:
Risk: From 3,140.34 to 3,121.66 = 18.68 points
Reward: From 3,140.34 to 3,251.33 = 110.99 points
Risk/Reward Ratio ≈ 1:6, which is very favorable.
4. Resistance Point:
Around 3,222.45 - 3,227.27
This area might act as a challenge for price movement, potentially leading to temporary retracements.
5. Indicators:
Moving Averages: Red (shorter period) and Blue (longer period) lines help indicate trends.
The price is moving above the short-term MA but currently under the long-term MA, which might suggest a short-term bullish move within a broader downtrend or sideways range.
Conclusion:
This is a bullish setup, anticipating a reversal or continuation to the upside after a pullback:
Buy Zone: 3,140.34
Stop Loss: 3,121.66
Take Profit: 3,251.33
If the price drops to the entry point zone

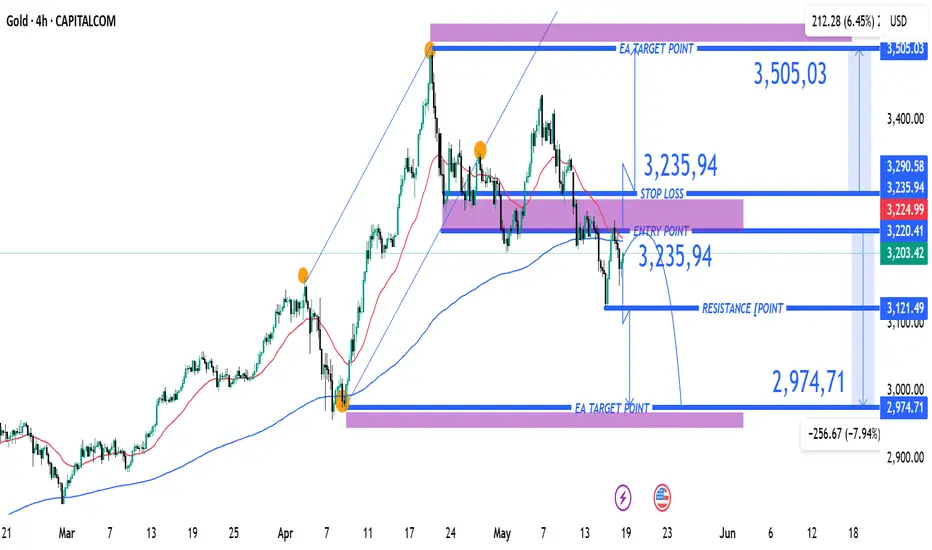
XAUUSD Bearish Setup with Key Entry, Stop Loss & Target LevelEntry Point: $3,235.94
Stop Loss: $3,235.94 (above current price, suggesting a SELL trade)
Target Points:
EA Target Point (Downside): $2,974.71 (Short target)
EA Target Point (Upside): $3,505.03 (Long target — likely alternate scenario)
Resistance Level: $3,121.49
Nearby Support Zone: Around $3,000–$2,975
📉 Trade Strategy Implied
This appears to be a short position setup:
Sell at: ~$3,220–$3,235
Stop Loss: $3,235.94
Take Profit: $2,974.71
Risk/Reward Ratio: ~1:3 (very favorable setup if thesis holds)
The upside target ($3,505.03) might be for a different scenario — if price reverses and breaks above resistance.
🧠 Market Structure Observations
Trend: A bearish break from a previous ascending channel.
Momentum: Price has bounced slightly after hitting support, but the moving averages suggest bearish momentum may persist.
Key Risk: If price breaks above $3,236 convincingly, it could invalidate the short setup and trigger a bullish run.
📌 Summary
Bias: Bearish (based on current setup)
Setup: Short with tight stop above resistance
Confirmation Needed: Watch for rejection at the $3,220–$3,236 zone and a breakdown below $3,200 for follow-through.
XAU/USD) Bullish Trade Setup – Targeting $3,506.52 with Entry atEntry Point: $3,221.19
Stop Loss: $3,169.80
Resistance Zone: Around $3,277.98 to $3,280.64
Target (TP) Point: $3,506.52 (Approx. 9.05% upside)
📊 Technical Indicators and Markings:
Moving Averages:
Likely a 50-period (blue) and 200-period (red) moving average.
Price is currently below both MAs, signaling a short-term downtrend.
Support & Resistance Zones:
Strong support around $3,207.67–$3,221.19 (entry area).
Resistance at $3,244.25–$3,280.64.
Stop-loss is strategically placed below support to limit downside risk.
Target Area:
Projected upside target is $3,506.52, with a potential 9.05% gain from the entry.
This is marked as the EA (Expert Advisor) Target Point, possibly suggesting this is a strategy from an automated trading system.
Orange Circles:
Likely indicate swing highs and lows, used to identify trend patterns and potential reversal points.
📈 Trading Idea Summary:
Bullish Setup: Buying at support, aiming for breakout above resistance to reach target.
Risk-Reward Ratio: Favorable, assuming price holds above $3,207.
Watch for Confirmation: Price needs to break above resistance around $3,280 for momentum continuation

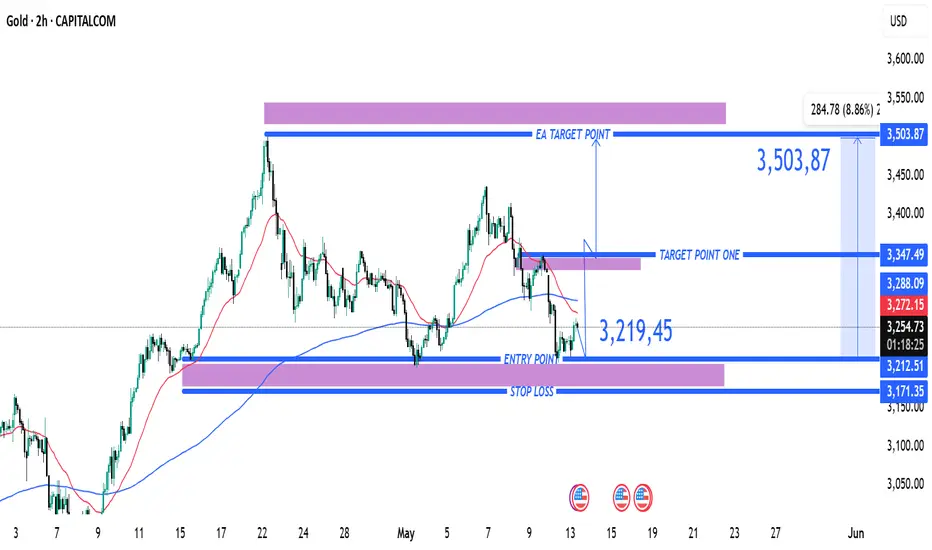
XAU/USD) 2H Trade Setup – Long Entry from Support with Targets aEntry Point: 3,219.45
Stop Loss: 3,171.35
Target Point One: 3,347.49
EA Target Point (Final Target): 3,503.87
Trade Plan:
Risk Zone: Between entry (3,219.45) and stop loss (3,171.35). The trader risks roughly 48.1 points.
Reward Zone: From entry to:
Target Point One: ~128 points.
Final Target (EA Target): ~284.4 points.
Risk-Reward Ratios:
To Target Point One: ~2.66:1
To EA Target Point: ~5.9:1
Indicators and Signals:
Price appears to be bouncing off a support zone near 3,212–3,219, indicating a potential reversal.
200 EMA (blue) and 50 EMA (red) are shown; price is slightly above the 200 EMA, suggesting long-term support.
There is a downtrend before the bounce, so this might be a counter-trend trade or the start of a new trend.
Summary:
This setup is a classic bounce from a demand/support zone with a clear upside potential. The risk is tightly managed, and the reward is significantly higher, aligning with favorable risk-reward principles. However, the position is speculative and relies on bullish follow-through from the support level. Watch price behavior near the 3,288 and 3,347 resistance zones to assess momentum.
(XAU/USD) Bearish Trade Setup – Targeting $3,222 with 1:6 Risk/R(Sell) setup.
Entry Point: Around 3,409.33 - 3,408.41 USD.
Stop Loss: 3,437.87 USD.
Target (Take Profit): 3,222.53 USD.
Risk/Reward Ratio: Approximately 1:6, which is favorable.
📉 Price Action & Trend Analysis:
A rising wedge (or channel) appears to have formed and broken to the downside — a bearish signal.
The current price at 3,341.47 has broken below a minor support zone (highlighted in purple), indicating bearish momentum.
Price is now approaching the 200 EMA, which is acting as potential dynamic support.
📌 Key Levels Highlighted:
Support Zones: Near 3,347.47 (previous minor support) and 3,222.53 (main target zone).
Resistance Zones: At the entry level and above, near 3,437.87 (Stop Loss zone).
🔄 Indicators:
Moving Averages (Red and Blue Lines): Shorter-term moving average (red) is below the longer-term (blue), indicating downward pressure.
Momentum Shift: The sharp drop suggests a likely continuation of the bearish trend.

XAU/USD) Bullish trand line analysis Read The ChaptianSMC Trading point update
Technical analysis of Gold Spot (XAUUSD) on the 4-hour timeframe, featuring key support and resistance levels, price action projections, and RSI for momentum evaluation. Here's a breakdown of the idea:
Key Points in the Analysis:
1. Support & Resistance Zones:
Big Support / Buying Zone: Around 3,222 – 3,240. This zone has seen previous bullish reversals and is supported by the 200 EMA.
Intermediate Support Level: Around 3,270–3,290, where price might bounce before attempting a breakout.
Key Resistance Level: Around 3,350–3,365. Price must break this area to move toward higher targets.
2. Price Action Projections:
The analysis shows two bullish potential scenarios:
Scenario 1: Price breaks above the resistance level directly and moves toward the target point at 3,535.83.
Scenario 2: A retracement to the lower support or even the big buying zone before a bullish rally to the same target.
3. RSI (Relative Strength Index):
Currently near the neutral zone (around 49), suggesting there's room for movement in either direction.
No extreme overbought/oversold signals right now.
4. EMA (200):
The price is currently hovering above the 200 EMA (3,222.01), which acts as a long-term support and trend indicator.
Mr SMC Trading point
Summary of the Trading Idea:
Bias: Bullish
Entry Zones: Look for long entries at either the support level (3,270–3,290) or lower buying zone (around 3,222).
Target: 3,435.05 initially, then 3,535.83.
Invalidation: A clear breakdown below the 3,222 support level could invalidate the bullish bias.
Pelas support boost 🚀 analysis follow)

XAU/USD) Bullish reversal analysis Read The ChaptianSMC Trading point update
technical analysis of Gold Spot (XAU/USD) on the 4-hour timeframe, projecting a bullish outlook. Here's a breakdown of the main ideas conveyed:
1. Support Level & Double Bottom
A strong support level is marked around the 3,177 area, with the price bouncing from it twice (highlighted by two black dots), indicating a potential double bottom pattern, which is typically a bullish reversal signal.
2. EMA 200 Support
The 200 EMA (Exponential Moving Average) lies just below the current price (~3,177), acting as dynamic support. The fact that price is holding above it adds strength to the bullish argument.
3. Bullish Divergence on RSI
The RSI (Relative Strength Index) shows a bullish divergence, where the price made lower lows but RSI made higher lows—another potential reversal indicator.
4. Price Projection
If the bullish move plays out, the chart outlines two upward targets:
Target Point: ~3,501.67
Next Target Point: ~3,729.23
These are based on measured moves from previous impulse legs (shown by vertical blue projections).
5. Entry Setup
The chart suggests a break above the short-term consolidation could trigger the bullish run toward the first target, aligning with bullish price structure and support confirmation.
Mr SMC Trading point
---
Overall Idea: The chart expects a bullish reversal from support, confirmed by double bottom, EMA 200 support, and RSI divergence, targeting higher resistance zones.
Pales support boost 🚀 analysis follow)

XAU/ USD) bullish trend analysis Read The ChaptianSMC Trading point update
analysis for XAUUSD (Gold vs. USD) on the 2-hour timeframe appears to suggest a bullish continuation setup after a correction. Here's a breakdown of the idea:
Key Points from the Chart:
1. Rising Channel:
The price is moving within an ascending channel.
After a breakout and strong rally, it is currently in a flag or wedge-like correction pattern.
2. Correction Zone:
The price is consolidating downward inside a small descending wedge (a bullish pattern), potentially forming a bull flag.
This is typically a sign of continuation after a strong upward impulse.
3. Support Zone:
A 4H support level is marked around 3,301.416, which aligns with the lower boundary of the flag pattern.
This is a potential buy zone for price to react and bounce.
4. Target Point:
The target is projected at 3,404.254, implying a breakout to the upside if the support holds.
5. RSI Indicator:
RSI is currently around 65, with previous values near 80, suggesting a slight cooldown but still in bullish territory.
A slight drop in RSI might occur before the next bounce.
6. EMA 200:
The EMA 200 is well below current price (around 3,137), indicating a strong bullish trend.
Mr SMC Trading point
Possible Trade Idea:
Entry: Around the 3,301–3,305 support area.
Confirmation: Wait for a bullish reversal pattern (engulfing candle or strong bounce).
Target: Around 3,404 (as per the marked target zone).
Stop Loss: Below the support zone (e.g., below 3,295), depending on risk tolerance.
Pales support boost 🚀 analysis follow)

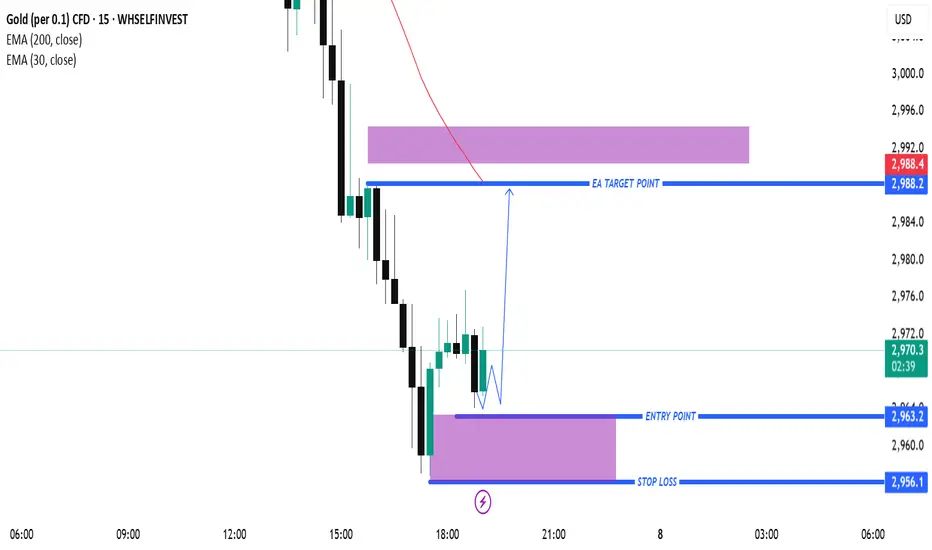
Gold (XAU/USD) Intraday Buy Setup – Demand Zone Reversal with 3.Timeframe: Appears to be intraday (possibly 5-15 minutes).
Indicators:
EMA 30 (red): Showing recent bearish momentum.
EMA 200 (blue): Positioned above, indicating a longer-term bearish trend.
Candlestick Pattern: After a steep drop, price shows signs of consolidation and potential reversal.
📌 Trade Setup (Long/Bullish Bias)
Entry Zone: Around $2,963.2
Price is expected to pull back into this purple demand zone before moving up.
Stop Loss (SL): $2,956.1
Placed below the support zone to limit downside risk.
Take Profit (TP / Target Point): $2,988.2
A previous supply zone near the EMA 30, where selling pressure could return.
📊 Risk-Reward Ratio
Risk: $2,963.2 - $2,956.1 = $7.1
Reward: $2,988.2 - $2,963.2 = $25
RRR (Reward-to-Risk Ratio): ~3.5:1
This is a solid ratio, suggesting a high-potential trade if the setup plays out.
📈 Bullish Scenario
Price pulls back into the demand zone (entry).
A bullish candlestick confirmation or wick rejection could trigger a buy.
Target is the previous structure + EMA zone.
XAU/USD) Bearish trand analysis Read The ChaptianSMC Trading point update
This chart analysis is for Gold Spot (XAU/USD) on the 1-hour timeframe. Here’s a breakdown of the idea shown:
---
Key Points in the Analysis:
1. Current Price:
XAU/USD is around $2,982.92 at the time of the chart.
2. Trend:
The chart suggests a bearish outlook.
Price has been consistently rejected from the yellow supply zone (around 3,020–3,033).
EMA 200 (blue line) is above the current price, confirming downward momentum.
3. Rejection Zone:
Marked in yellow between 3,020 and 3,033. Labeled as “Reject points”.
Price failed to break above this zone multiple times.
4. Breakout Pattern:
Two descending rectangles highlight bearish continuation patterns.
A bearish flag or wedge is visible, followed by a breakout downward.
5. Target Zone:
Highlighted in yellow between 2,900 and 2,921, with target point at 2,920.615.
Price is expected to move down to this level.
6. RSI (Relative Strength Index):
RSI is declining and shows bearish divergence, supporting downside move.
Currently around 39.19, which is closer to oversold territory but still has room to drop.
Mr SMC Trading point
---
Trade Idea Summary:
Bias: Bearish
Entry Area: Rejection near 3,020–3,033 zone
Target: 2,920.615 (highlighted support zone)
Stop Loss: Could be placed above 3,033 (supply zone or EMA 200)
Confluence Factors:
EMA 200 rejection
Bearish RSI divergence
Repeated supply rejection
Breakout from bear flag structures
Pales support boost 🚀 analysis follow)

XAU/USD) bearish rejected fvg analysis Read The ChaptianSMC Trading point update
This chart analysis of Gold (XAU/USD) on the 2-hour timeframe appears to be a bearish setup based on Smart Money Concepts (SMC). Here's a breakdown
Key Elements:
1. Price Channel Break & CHoCH:
The price was in a rising channel.
A clear Change of Character (CHoCH) occurred after the price broke below the structure, signaling a shift from bullish to bearish.
2. Fair Value Gap (FVG):
There's a bearish Fair Value Gap (FVG) highlighted in the yellow box around the 3,047–3,075 level.
The expectation is that price may retrace into this FVG before continuing downward.
Mr SMC Trading point
3. Target Zone:
A major demand zone or target point is marked around 2,940, indicating a potential bearish move of around -148 points (~4.8%) from the FVG.
4. EMA & RSI:
200 EMA is around 3,047, acting as dynamic resistance now.
RSI is below 40 and trending down, showing bearish momentum with slight bullish divergence, hinting at a short retracement before another drop.
---
Summary of the Idea:
Bias: Bearish
Trade Plan:
Wait for price to retrace into the FVG zone (~3,047–3,075).
Look for bearish confirmation (like bearish engulfing or rejections).
Enter short with a target at 2,940, stop above FVG.
Pales support boost 🚀 analysis follow)

This chart shows a potential bullish setup for Gold (XAUUSD) on This chart shows a potential bullish setup for Gold (XAUUSD) on the 15-minute timeframe, with some key technical elements and a projected trade idea. Here's a breakdown of the analysis:
1. Current Market Overview
Price: Trading around $3,038.51.
Trend: Recent downtrend followed by a minor recovery.
Indicators:
EMA 200 (Blue): Currently at $3,090.41, acting as a dynamic resistance.
EMA 30 (Red): Positioned below the EMA 200, indicating a still bearish trend but with potential for a pullback.
2. Key Zones & Labels
Limit Entry Zone: Highlighted around $3,025.72 (bottom purple zone)
Labeled as “LIMIT ENTRY”, indicating a potential buy entry.
This area corresponds with a fair value gap (fvg) — often used in smart money concepts as a sign of institutional interest.
Target Zone: Around $3,082.22 (top purple zone)
Labeled as “target point EA”.
Lies just below the EMA 200 resistance level, which is a likely take-profit area for a bullish move.
3. Projected Price Action
A possible bullish retracement is anticipated:
Dip into the limit entry/fvg zone at ~$3,025.
Then, a rally targeting the $3,082 zone, possibly extending toward the EMA 200 at ~$3,090.
4. Trade Setup (Based on the Chart)
Entry: Around $3,025.72 (limit buy)
Target: Between $3,082.22 - $3,090.41
Risk: Likely below the FVG zone (~$3,015–$3,020), depending on risk appetite.

Gold (XAU/USD) Technical Analysis: SMC Trading point update
This chart is a technical analysis of Gold (XAU/USD) on a 4-hour timeframe. Here’s a breakdown
1. Ascending Channel:
The price is moving within an upward channel, showing a bullish trend.
Higher highs and higher lows confirm the uptrend.
2. Support and Resistance Zones:
Yellow Boxes: Key support zones where price previously consolidated before moving higher.
Red Arrows: Marking resistance zones where the price faced rejection.
Green Arrows: Indicating support levels where the price bounced.
3. Current Price Action:
Price recently dropped to a key support zone (around $3,050).
A bullish reaction is expected from this level.
If support holds, the price may continue the uptrend toward the target of $3,186.
4. Projected Move:
The black zigzag line suggests a potential bounce from support.
If the support level holds, price could move back up within the channel.
Mr SMC Trading point
Conclusion:
If price respects the support zone, there could be a good buying opportunity.
A break below the support zone would signal potential bearish movement.
Monitoring price action around the yellow zone is crucial for confirming direction.
Pales support boost 🚀 analysis follow )

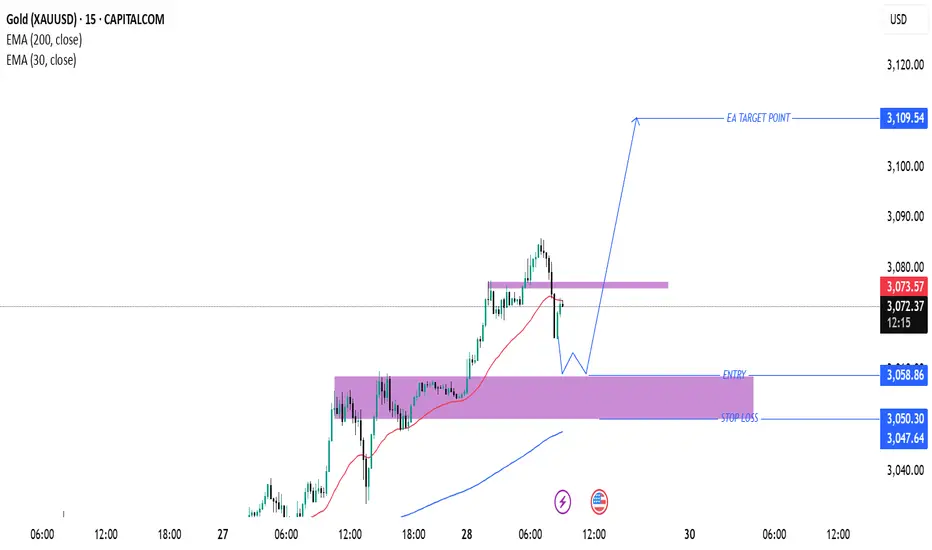
Gold (XAU/USD) Trade Setup & Analysis – March 28, 2025Gold (XAU/USD) Trade Analysis – March 28, 2025
Current Market Overview:
Price: $3,073.77
Recent High: $3,074.00
Recent Low: $3,070.29
EMA (30): $3,073.71 (Short-term trend)
EMA (200): $3,047.40 (Long-term trend)
Technical Analysis:
Support & Demand Zone:
The highlighted purple area represents a strong support zone around $3,050 - $3,058, where buyers may step in.
The price is currently pulling back into this area, indicating a potential bullish reversal opportunity.
Bullish Projection:
The chart suggests a retracement to the demand zone, followed by a strong bullish continuation.
A breakout from the minor resistance zone around $3,073 - $3,075 would confirm the uptrend.
Target & Stop Loss:
Entry Zone: Around $3,058.86 (near the demand zone).
Stop Loss: Below $3,047.40 (under the key support and EMA 200).
Target: $3,109.54 (significant resistance level and profit-taking point).
Trade Strategy:
Wait for confirmation of a bullish rejection at the support zone before entering.
If price breaks above the minor resistance, it could indicate momentum toward the target.
Risk-to-reward ratio looks favorable with a potential upside move of +50 points if the trend continues.
Conclusion:
The setup favors a bullish continuation after a pullback.
Key Levels to Watch: $3,058 (entry), $3,047 (stop loss), and $3,109 (target).
Traders should monitor price action at the demand zone before entering a long position.
Gold (XAU/USD) Bearish Outlook: Key Levels to WatchBuddy'S dear friend SMC Trading Signals Update 🗾 🗺️
This chart represents the price action of Gold (XAU/USD) on a 1-hour timeframe, showing potential areas of resistance, support, and liquidity zones. Here’s a breakdown of the analysis:
Analysis of the Chart:
1. Resistance Level (3,023-3,030 zone)
The price has reacted multiple times (red arrows), indicating strong selling pressure.
A fair value gap (FVG) is present, suggesting potential mitigation before further movement.
2. Current Price (3,011.76)
The price is trending downward after rejecting the resistance level.
It is approaching the diamond zone, a potential short-term support before continuation.
3. Key Support Levels:
Diamond Zone (~3,000 region)
Could cause a temporary bounce before further decline.
Order Block (~2,952-2,938 zone)
This is a strong demand zone and a potential target area for price action.
4. Target Levels:
The analyst expects a downward move toward 2,952, aligning with a liquidity grab scenario.
5. RSI Indicator:
RSI is at 44.27, suggesting bearish momentum, with the possibility of further downside.
A break below 40 RSI may confirm more selling pressure.
Mr SMC Trading point
Risk Management Considerations:
Entry: A possible short entry could be around the FVG level (~3,020-3,030) if price retraces.
Stop Loss: Above 3,035 to avoid being trapped in a fake breakout.
Take Profit: Around 2,952-2,938 as per the target point.
USD Update & Impact on Gold:
If USD strengthens, gold may drop further due to their inverse correlation.
Key upcoming economic data (interest rate decisions, inflation reports) could increase volatility.
Pales support boost 🚀 analysis follow)

GOLD TRDAING POINT UPDTAE > READ THE CHAPTIAN Buddy'S dear friend
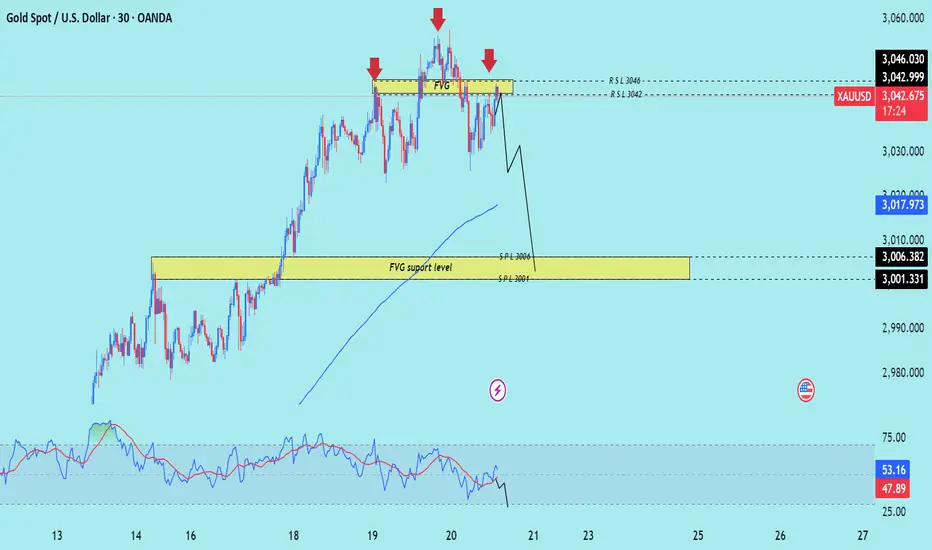
SMC Trading Signals Update 🗾🗺️ Gold Traders SMC-Trading Point update you on New technical analysis setup for Gold 🪙 list time post signals 💯 reached target point 3059. ). Analysis update on gold. Gold look 👀 patterns chart 📉 sellers recover and strong 💪. 30M time frame 🖼️ looking short trend 📉 target 🎯 point 3001 that entry buying said good luck 💯
Key Resistance level 3042 + 3046
Key Support level 3006 - 3001
Mr SMC Trading point
Palee support boost 🚀 analysis follow)