Gold Spot Ready For Big Move in Coming Days - 30 October 2025Gold prices may see a major breakout soon. Traders eye upcoming data and Fed signals for the next big move in the gold spot market.
Goldprice

How does today’s gold top compare to the 1980 and 2011 peaks?Gold is not just at a nominal high — it is trading at the highest real (inflation-adjusted) price in modern history.
How does today’s gold top compare to the 1980 and 2011 peaks?
1️⃣ GOLD MAJOR TOPS — NOMINAL vs REAL (TODAY’S MONEY)
🔴 1980 GOLD TOP (true panic peak)
Nominal price (1980): ~$850/oz
Inflation-adjusted to today: ~$3,200–3,400/oz
What the world looked like:
Double-digit inflation
Oil crisis
Cold War escalation
Dollar confidence collapse
Real rates deeply negative
Monetary panic
Meaning: This was a once-in-a-generation monetary crisis peak.
🟠 2011 GOLD TOP (QE / crisis fear)
Nominal price (2011) : ~$1,920/oz
Inflation-adjusted to today : ~$2,600–2,700/oz
What the world looked like:
Global Financial Crisis aftermath
QE everywhere
Eurozone debt crisis
Fear of currency debasement
Inflation still relatively controlled
Meaning: This was a financial-system fear peak, not a currency collapse.
🟡 TODAY (2025–26) GOLD ~ $4,584
Nominal price : ~$4,584/oz (new high)
Inflation-adjusted: $4,584 (today’s dollars by definition)
Compared to past real peaks:
~35–45% above the 1980 real peak (~$3,300 mid-range)
~70–75% above the 2011 real peak (~$2,650 mid-range)
This is extremely important : today’s gold price is already the highest real gold price in modern history.
2️⃣ TABLE SUMMARY
| Gold Peak | Nominal Then | Real Value Today |
| 1980 panic | ~$850 | ~$3,200–3,400 |
| 2011 QE | ~$1,920 | ~$2,600–2,700 |
| Today | ~$4,584 | $4,584 |
3️⃣ WHAT MAKES TODAY DIFFERENT FROM 1980 & 2011
Today:
Inflation already happened
Debt far higher than 1980 or 2011
Central banks trapped
Geopolitical fragmentation
De-dollarization pressure
Central banks buying gold aggressively
Takeaway: Today’s price reflects structural distrust , not just panic.
4️⃣ WHAT A REAL GOLD TOP USUALLY MEANS NEXT
Historically, after gold peaks in real terms:
Nominal price may still go higher briefly
Then:
Long consolidation
Sharp correction
Or years of underperformance vs inflation
Gold doesn’t crash like silver — it bleeds purchasing power over time . That’s how tops resolve.
Disclaimer:
This post is for educational and informational purposes only and does not constitute financial, investment, or trading advice. Readers should conduct their own research or consult a professional before making any financial decisions.


Entry Setup 1 for 2026Entry Setup 1 for 2026
If you are new to Forex Trade, first you will need to open a trading account .
Open a Trading Account Now:- ☛
Before Trade Entry Follow the Step:-
Step 1:- Identify the Trend
Step 2:- Bullish Trend Wait for Support Price & Reversal Candlestick(Take Buy)
Step 3:- Bearish Trend Wait for Resistance & Reversal Candlestick(Take Sell)
Step 4:- Fibonacci retracement confirm
Step 5:- Wait for Reversal candlestick
RISK WARNING:- All trading involves risk. Only risk capital you're prepared to lose. This video has not given any investment advice, only for educational purposes.

Gold Rejected at Highs as Bearish Harmonic Triggers🟡 Gold OANDA:XAUUSD Rejected at Highs as Bearish Harmonic Triggers 📉
Gold (Daily) has entered a major supply zone and witnessed a sharp rejection. A bearish harmonic pattern has completed near the highs, followed by aggressive selling pressure. Momentum is turning down and volatility is expanding — classic signals of a near-term top.
👉 Risk now favours a pullback or consolidation rather than fresh long positions at current levels
🟡 Gold (XAUUSD) – Medium-Term View
Gold has completed a bearish harmonic structure and faced strong rejection near 4550–4560, a key supply area. The sharp decline from highs reflects rally exhaustion and indicates a shift toward consolidation or correction.
➡️ As long as prices remain below 4560, upside is likely to stay capped.
🔑 Key Levels to Watch
Resistance: 4420 → 4550
Support: 4250 → 4000
🔮 Medium-Term Outlook
Base Case: Range-bound to corrective move between 4250–4550
Bearish Risk: A breakdown below 4245 opens downside toward 4100–4000
Bullish Scenario: Fresh upside only on a sustained breakout above 4560
🧠 Final Takeaway
Gold requires fresh macro triggers or sustained dollar weakness to resume its uptrend. Until then, expect time correction, higher volatility, and selective trading opportunities — not a one-way rally.

Chumtrades XAUUSD Any pullback is an opportunity to buy higher.This morning’s move was a corrective sell-off, best understood as profit-taking from BUY-side, not a trend reversal.
The overall structure remains within a rising trend channel, with no sign of a structural break → BUY bias stays intact, looking to buy pullbacks in line with the trend.
🟢 Key Support Zones
447x: near-term support (4476 – 4472 – 4470)
4450 – 4455
4430 – 4435
🔴 Key Resistance Zones
4548 – 4550
4560 – 4565
4599 – 4600 (upper resistance)
📌 Additional Note
453x is a mid-zone to watch closely for price reaction.
📊 Intraday Expectation
Price is expected to range sideways on the H2 timeframe
Range high: 4549
Range low: 4473
→ Possible BUY near the lower boundary and SELL near the upper boundary if the range holds.
⚠️ Risk Management
No major news at the moment; price is mainly driven by technical flows.
Holiday period → thin liquidity, higher risk of stop hunts.
Keep stops reasonable and avoid overtrading.
Wishing everyone a productive trading day.

XAUUSD H4 – Trading the Uptrend Channel with LiquidityXAUUSD H4 – Trading the Uptrend Channel with Liquidity and Volume Profile
Gold remains bullish on the H4 timeframe and continues to respect a well-defined rising channel. With price approaching extended areas, the higher-probability approach is to buy pullbacks at value zones and treat the upper boundary as a short-term profit-taking area rather than chasing momentum.
TECHNICAL CONTEXT
The uptrend structure is still intact, with price forming higher lows inside the channel.
After a strong impulsive leg, the market is now consolidating and rebalancing, which favours execution around Volume Profile and FVG zones.
The upper channel boundary often acts as a short-term exhaustion area, while value zones below offer better risk-to-reward long entries.
PRIORITY SCENARIO – MAIN PLAN
Buy the pullback at key value and liquidity zones
Buy POC: around 4485
Buy zone FVG support: around 4368
Rationale:
The 4485 POC is a high-volume area where price frequently reacts during pullbacks.
The 4368 FVG aligns with channel support and represents an imbalance area that price often revisits before continuation.
Expected behaviour:
A pullback into POC or the FVG zone, followed by a bullish reaction, can set up the next leg higher within the channel.
ALTERNATIVE SCENARIO – SECONDARY PLAN
Short-term sell scalp near the upper boundary
Sell scalping zone: around 4600
Note:
This is strictly a short-term scalp if price reaches the upper channel boundary and shows clear rejection. It is not a trend reversal thesis.
KEY TAKEAWAYS
The H4 trend remains bullish, but the channel range is wide, making chasing price riskier.
Volume Profile and FVG zones define higher-probability execution areas.
The best edge comes from buying pullbacks at value, while treating 4600 as a potential short-term reaction zone.

XAUUSD (H1) – Trading BUY Liquidity Stay bullish with the rising channel, buy the pullback into liquidity
Quick view
Gold is still moving inside a rising channel. After the strong impulsive push, price is now consolidating / compressing. For today, I’m prioritising BUY setups at liquidity + trendline retests, while keeping a reaction SELL plan at the premium Fibonacci zone above.
Macro context (why volatility can stay elevated)
Trump signing a record number of executive orders and the growing shift of power towards the executive branch increases policy uncertainty (tariffs, federal cuts, geopolitical moves). In uncertain environments, flows often rotate into safe-haven assets like gold.
That said, this kind of headline risk can also move the USD sharply, so the best approach is still: trade the levels, not emotions.
Key Levels (from your chart)
✅ Buy zone Liquidity: 4410 – 4413
✅ Buy trendline retest: 4480 – 4483
✅ Sell zone (Fibo 1.618): 4603 – 4606
Today’s trading scenarios (Liam style: trade the level)
1) BUY scenario (priority)
A. Trendline retest = best structural entry
Buy: 4480 – 4483
SL: below the zone (guide: 4472–4475, adjust on lower TF / spread)
TP1: 4515 – 4520
TP2: 4580 – 4600
B. Deeper liquidity buy (if we get a sweep)
Buy: 4410 – 4413
SL: below the zone (guide: 4402–4405)
TP: 4480 → 4520
Logic: These are the cleanest liquidity areas on the chart. No chasing mid-range — I only act when price returns to the zone and reacts.
2) SELL scenario (reaction only — no chasing)
Sell: 4603 – 4606
SL: 4612
TP1: 4550
TP2: 4483
Logic: The 1.618 premium zone often attracts profit-taking. I only sell if price taps the zone and shows clear weakness on the lower timeframe.
Notes
If price keeps holding the trendline and printing higher lows → BUY bias remains stronger.
If we break the trendline and fail to reclaim it → reduce size and wait for a fresh structure.
Which side are you leaning today: buying the pullback, or waiting for 4603–4606 to sell the reaction?

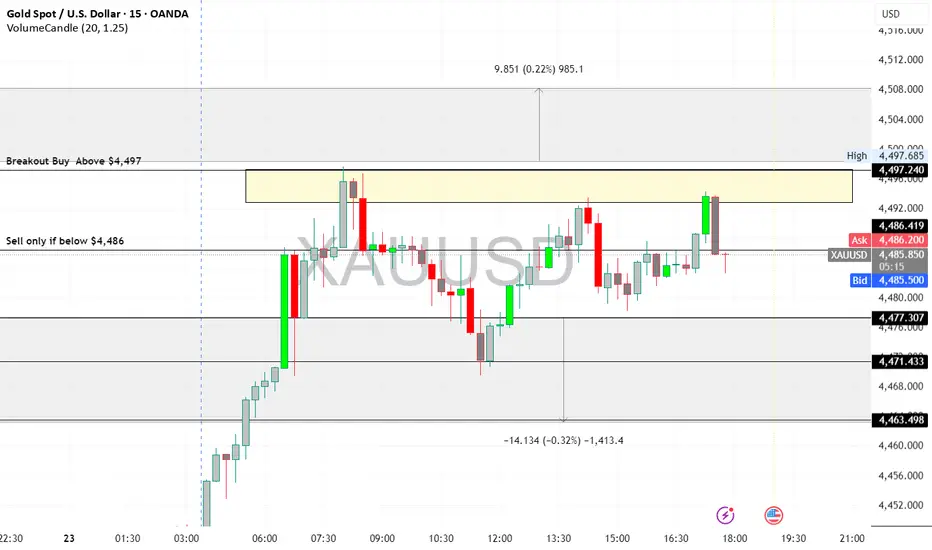
XAUUSD (Gold) Intraday Outlook - 23/12/2025XAU/USD Trend: Strong Bullish
Current Price: $4,491.99
Key Levels:
Support: $4,486 / $4,479
Resistance: $4,497 / $4,501 / $4,508
Pivot: $4,490
Strategy:
Buy on dips: $4,486–$4,479 → Target $4,497–$4,501
Breakout buy: Above $4,497 → Target $4,501–$4,508
Sell only if below $4,486
Gold remains bullish; prefer buying on dips or breakouts, keep stops tight near support.
Disclaimer: Trading involves risk. This analysis is for educational purposes only and is not financial advice. Trade responsibly.
XAUUSD ANALYSISI am posting a chart of XAUUSD this is the possible outcomes of the wave as per myview
3rd wave is completed and the current xauusd is in correction we can see abc correction on longterm as per trukit last wave now we can see trendline liquidity is need to be taken and in upcoming days we can see gold around 3820 from we can see 4-5wave as per my view.
Thanks

XAUUSD, Trade setup for coming weekOnce 4336.206 is broken, we can see 4320/4315 immediately this week, further towards 4230, based on FED

XAUUSD H1 Main Trend for the Weekend
Gold failed to confirm a sustainable upward momentum after yesterday's price reaction, prioritizing a short-term adjustment scenario before reassessing the trend
PRIORITY SCENARIO
Strategy to sell based on reactions at large volume areas, suitable for the current short-term structure
Focus sell area: 4332 – 4342
Technical basis: these are areas concentrated with volume according to the Volume Profile, where price is likely to show distribution reactions after a weak recovery
Expected movement: price recovers to the large volume area for distribution, then continues the adjustment phase
Daily target:
Heading towards the 4275 area, coinciding with the Fibonacci retracement area and underlying support
Position management:
Sell should only be held short-term. If the price surpasses and stabilizes above 4342, risk should be reduced and avoid holding sell orders.
ALTERNATIVE SCENARIO
Monitor price reactions at deeper support areas to reassess trading opportunities
Strong support area: around 4275
Technical context: this is the convergence area between structural support and Fibonacci retracement, likely to show defensive buying force
Expected movement: if the price reacts well at this area, the market may enter a re-accumulation state
MAIN REASON
On H1, the previous upward phase failed to maintain a clear upward structure, indicating weakening buying force
Volume Profile helps identify the 4332 – 4342 areas as advantageous entry points for the sell reaction scenario
The 4275 area serves as a reasonable adjustment target in the context of a typically momentum-lacking weekend market
MACRO CONTEXT AND MEDIUM-TERM OUTLOOK
While short-term fluctuations lean towards adjustment, major institutions still maintain a positive outlook for gold in the medium and long term. Goldman Sachs forecasts gold prices could reach $4,900/oz by the end of 2026, supported by strong buying demand from central banks and positive impacts from the Fed's interest rate cut cycle.
This suggests that short-term declines may be more of a technical adjustment rather than a reversal of the long-term trend.

XAUUSD (H1) – Friday Weekend
Lana prioritizes the adjustment phase towards the POC area, looking to Sell in the liquidity zone 💛
Quick Summary
Context: Friday, the market often tends to take profits and sweep liquidity before the week closes
Monitoring Frame: H1
Main Viewpoint: Prioritize a decrease during the day (adjustment phase)
Key Point to Note: 4308 has reacted multiple times, a sensitive point in the structure
Market Context
The weekend is usually a time when the cash flow is “lighter” and price behavior tends to lean towards profit-taking. Therefore, an adjustment phase to gain more liquidity is the scenario Lana prioritizes today.
From a medium-term perspective, some large institutions still maintain a positive view on gold. However, in intraday trading, Lana still prioritizes following the current price behavior and trading according to the liquidity zone.
Technical View H1
On H1, the price is fluctuating around the accumulation zone, and the POC/VAL area indicates this is a market zone that has been “back and forth” for quite a while. When the price returns to these areas, there is usually a clear reaction.
The 4308 area is noteworthy because the price has reacted multiple times, so this is a point that could determine whether the adjustment phase continues.
Today's Trading Scenario
Main Scenario – Sell at POC/VAL area (large liquidity)
Sell: 4335 – 4340
Lana prioritizes waiting for the price to rebound to this area to sell according to the adjustment phase. This is a large liquidity zone, suitable for finding a downward reaction during the day.
Alternative Scenario – Buy scalping at near support
Buy: 4284 – 4289
This Buy order is only for scalping when the price hits the support area and a bounce reaction appears. If the market continues to be weak, Lana will not hold the Buy for too long.
Session Notes
If the price continues to be rejected around resistance areas and cannot surpass the supply zone, the adjustment scenario will have an advantage.
For Friday, Lana prioritizes light trading, quick closing, avoiding holding positions too long over the weekend.
Lana's Notes 🌿
Each scenario is just a probability. Lana always sets a stop loss first, chooses the appropriate volume, and is ready to skip if the price does not reach the waiting area.

XAUUSD (Gold) Technical Outlook - 18/12/2025📊 XAU/USD Quick Outlook
Gold is trading near 4,326, showing short-term weakness, but the overall trend is still bullish on higher timeframes.
🔑 Key Levels
• Support: 4,320 – 4,300
• Resistance: 4,335 – 4,345
🟢 Bullish: Above 4,320 → targets 4,345 → 4,370+
🔴 Bearish: Below 4,320 → targets 4,300 → 4,260
📌 Intraday Tip:
Sell near resistance, buy near support only after confirmation.
⚠️ Expect volatility during USD news.
⚠️ Disclaimer: This analysis is for educational purposes only. Markets are volatile—trade with proper risk management and at your own risk.

Chumtrades XAUUSD Trading Plan NF todayMarket Psychology
Expect price to range sideways before a clear breakdown.
Market is waiting for NFP, smart money stays cautious → focus on range trading (4330–4280).
🔴 Resistance (Key Resistance)
4335 – 4340
4318 – 4322
Support (Key Support)
4260 → Short-term lower range
424X → Swing BUY zone
4204 → Deep pullback, strong swing BUY area
🎯 Trading Expectation
Before news:
Trade the range
Sell high – Buy low
Avoid FOMO in the middle
After news / Breakdown:
Look for deep BUY entries
Focus on 424X – 4204

XAUUSD H4 Medium Term Rising Channel and Key Liquidity ZonesXAUUSD H4 – Medium-Term Rising Channel and Key Liquidity Zones
Gold reacted sharply after touching the trendline, with the primary focus next week on buying pullbacks in line with the dominant trend
PRIORITY SCENARIO – MAIN STRATEGY
Trend-following buy strategy on a corrective move into key support and liquidity areas
Primary buy zone: 4175 – 4203
Technical context: this area represents a previously validated support zone and a clear pool of downside liquidity
Price expectation: a corrective dip into support, absorption of selling pressure, followed by a potential rebound back toward the upper balance area
Position management:
If price shows a strong reaction and H4 candles hold above the support zone, maintaining a swing-long bias remains favoured.
If price breaks decisively below support, risk should be reduced and deeper levels monitored.
ALTERNATIVE SCENARIO – SECONDARY STRATEGY
Deeper pullback buy opportunity near the lower trendline of the rising channel
Alternative buy zone: near the lower boundary of the rising channel, aligned with long-term liquidity
Technical context: this area acts as the last line of defence for the medium-term bullish structure and is suitable for longer-term positioning
Price expectation: a deeper liquidity sweep followed by recovery, reaffirming the rising channel
KEY TECHNICAL POINTS
On the H4 timeframe, price continues to trade within a rising channel. The sharp 100-point drop after touching the upper trendline highlights profit-taking pressure at higher levels
The 4175 area and the lower channel trendline remain the most important liquidity zones for trend-aligned buying
Upper resistance and the FVG-liquidity zone are better suited for trade management rather than aggressive new longs
MACRO AND MARKET CONTEXT
Markets are reacting to growing expectations of a potential shift in future Federal Reserve leadership and policy direction.
The probability of Kevin Warsh becoming the next Fed Chair has increased, alongside comments indicating a preference for significantly lower interest rates.
Such expectations may remain supportive for gold in the medium term, although short-term technical corrections should still be respected after strong upside moves.
RISK MANAGEMENT AND MONITORING
Avoid chasing price near the upper boundary of the rising channel.
Any sell positions should be treated as short-term countertrend trades and only considered with clear rejection signals.
The bullish scenario weakens if price breaks and fails to reclaim the rising channel structure.
Remain alert to volatility around policy-related headlines and key economic data, as liquidity sweeps are likely.

ChumTrades XAUUSD intraday outlookXAUUSD – Intraday Plan (M15)
Market Context
Price is currently ranging in a very tight consolidation.
Momentum is weak → market favors intraday range trading rather than chasing breakouts.
Short-term structure remains intact; focus on price reaction at key levels.
Daily Strategy
Main approach: trade the range, trade the reaction.
Buy at predefined support / Fibonacci zones, sell at clear resistance.
If a breakout occurs, wait for a retest before following the move.
Avoid entries in the middle of the range.
Key Buy Zones
4246 – 4244 (Fibo 0.5)
4236 – 4233 (Fibo 0.618)
4210 – 4208 (deep support reaction)
❌ Bullish structure invalidation:
M15 close below 4200
Key Sell Zones
4300 – 4305 (psychological resistance)
4310 (Fibonacci extension – reaction sell)
Special Notes (Friday)
No major economic news today, but it is Friday – end of week.
Price action may become choppy and unpredictable, especially during the US session (a pattern seen in recent weeks).
Risk management is key:
Focus on short-term trades
Take profits early
Avoid holding positions over the weekend
Good luck Bro !

XAUUSD – Brian | After the rate cutXAUUSD – Brian | After the rate cut, Volume Profile still favours further downside
1. Market snapshot
After the rate cut, gold saw a bounce but failed to sustain the upside and is still hovering below last week’s highs.
In the Asian session, price only ticked up slightly before being sold off again – a sign that buying pressure is not particularly strong at these levels.
Risk-on sentiment has returned and the USD is seeing a modest recovery, which is weighing on XAU/USD.
That said, expectations for the Fed to maintain a dovish tone could still cap USD strength in the medium term.
Overall, in the short term Brian still leans towards a downside move, preferring to sell into liquidity above rather than chase buys.
2. Volume Profile view – Key levels to watch
On the H1 chart, Volume Profile highlights three main areas:
VAL – Buy scalping zone: around 4,207
→ Current lower value area, where a short technical bounce may appear.
Liquidity / Sell zone: around 4,222
→ Liquidity pocket above, lining up with VAH and a volume cluster – an attractive area to look for sells if price is pushed back up for a retest.
Deeper buy zone: around 4,166
→ Broader demand area below; if price flushes lower after sweeping liquidity, this is where dip-buying interest may show up.
3. Trade scenarios (for reference)
Scenario 1 – Sell at the 4,222 liquidity zone (primary idea)
Idea: Wait for price to retrace into the 4,222 liquidity zone and then look for rejection signals on H1/M15.
Sell zone: 4,220–4,223
Suggested SL: Above 4,230
Targets:
TP1: 4,207 (VAL)
TP2: 4,190–4,185
TP3: 4,170–4,166 (deeper buy zone)
This setup follows the current bearish bias, using the logic of “sell the rally into high-volume + liquidity zones”.
Scenario 2 – Light buys at VAL 4,207 & buy zone 4,166
Scalp buy at VAL:
Entry zone: 4,204–4,207
Target: bounce back towards 4,217–4,220 and then exit, not a long hold.
Buy at the deeper 4,166 zone (cleaner level):
Entry zone: 4,164–4,168
SL: Below 4,158
TP: 4,190 → 4,210 if a clear bullish candle reaction forms and the Fed does not turn overly hawkish.
Both buy scenarios are purely short-term corrective plays, so position size should be kept modest as the main bias remains to the downside.
Be patient and only start thinking about sells once price tags the 4,222 area – avoid forcing entries when price is stuck in the middle of the range.
In summary: Selling around 4,222 is the primary plan, while buys at 4,207 and 4,166 are secondary strategies that only come into play if there is a clear reaction from Volume Profile and price action.

XAUUSD Short | 15m |Gold revisited the upper band of the intraday structure and showed clear signs of weakening momentum. Price failed to sustain above the model’s trailing zone, indicating a shift from short-term accumulation to distribution.
The short entry was executed as price broke back below the cloud, supported by a clean loss of intrabalance strength.
Stop is placed above the most recent structural failure.
Primary target sits near the liquidity cluster around 4175.

Holding Breath for FOMC News - Will History Repeat?XAUUSD Trading Idea Today 10/12/25 (FOMC - Big News)
Will history repeat:
Before the news: Sideway | News release: prioritize SELL
Today's range: 417X–423X
Expectation: FOMC release leads to selling (Powell is usually hawkish → price drops like in September & October)
1) Intraday Trading (catching the Sideway range)
Upper range:
4218–4220
4230–4233
Lower range:
4170–4173
4180–4182
→ Morning & afternoon prioritize catching the range – trade within the range for safety before the news.
2) During the news (for those who trade the news)
Not suitable for those who are risk-averse, so you can skip if you can't handle it. Limit if you want to learn and profit using a very small account.
1) 4218–4220 (Risk-only) (if it doesn't break all day)
• High reaction area
• Safe → skip
• Risk → Probe sell, small SL
2) 4230–4233 (Main Sell)
• Strong resistance within the range
3) 4240–4244–424X (Best Sell)
• Liquidity zone
• If spike during/before news → High RR sell
3) Target down
TP1: 418X
TP2: 416X-5x
TP3: 409X (main target – swing + FVG + fibo)
4) BUY?
Attention area:
4150-52
4128-32
4102-96
5) Note on the news
This scenario holds if Powell maintains a hawkish tone.
If Powell is more "dovish" → it may go against expectations.
Risk-averse traders → do not trade the news.
News traders → use a small account to test market reactions.
Quick Summary
Before the news → Sideway, catch the range 417X–423X
News release → prioritize SELL
SELL zone: 4218, 4230–4233, 4240–4244
Main target: 409X
The price will move with each statement from the Fed Chairman and keep an eye on Trump too.
Wishing everyone a victorious day.

XAUUSD – Brian | Volume Profile before FedXAUUSD – Brian | Volume Profile before Fed: watch for a rebound to sell down
Market snapshot
Ahead of the Fed's interest rate announcement, gold is moving sideways within a fairly wide range, not yet choosing a clear direction.
In the H1 timeframe, the price fluctuates around the value area, making it very suitable for short-term trading according to the Volume Profile instead of trying to predict the meeting outcome.
Volume Profile – Key price areas
Nearest VAL: around 4.197 – the bottom of the current value area, where there was previous buying support.
Above, the FVG area + VAH/POC cluster is around 4.210 – this is an "air pocket" area where selling pressure can easily appear when the price fills the liquidity gap.
Below, the target for a downward wave if the Fed is not too dovish is around 4.13x (area 4.130–4.135) – coinciding with the old buy zone on the chart.
Trading scenario according to Volume Profile
Watch for a light Buy reaction at VAL 4.197
If the price slides to 4.197 and a nice rejection candle appears on H1/M15, a short scalp buy can be considered:
Idea: capture the rebound from VAL back to the middle/top of the value area, do not hold the position long.
Sell when the price fills FVG around 4.210 (priority scenario)
After the rebound from VAL, the FVG area 4.210 will be where Brian prioritizes watching for a Sell:
Reference sell entry: around 4.208–4.212
TP1: 4.185–4.180
TP2: 4.165–4.160
TP3: area 4.13x (4.130–4.135) if a strong sell-off occurs after the Fed
SL should be placed neatly above the FVG/VAH area (e.g., 4.218–4.220), avoid setting it too far.
Fed context – Why trade cautiously?
The focus this week is the FOMC meeting:
The market is waiting to see if Chairman Powell can create enough consensus to continue cutting interest rates with very few members opposing, similar to the previous 25 bps cut.
If the Fed maintains a dovish tone → USD weakens, yields cool down, gold is likely to bounce back after the sweep.
If Powell signals a "hawkish rate cut" (concern about inflation, cut less – talk tough) → yields rise, gold may complete a deep decline to the 4.13x area before stabilizing again.

XAUUSD – Brian | H1 Volume ProfileXAUUSD – Brian | H1 Volume Profile: risk of deep decline as market awaits PCE data
Market snapshot
On H1, gold is declining in a rather "clean" structure, continuously creating lower highs and lower lows.
The 4.175 area is currently the nearest support – if breached, the decline could extend another 50–60 points to lower areas.
Price remains below 4.250 USD, as the market awaits PCE data (Fed's preferred inflation measure) to find a clearer direction.
Technical map – Volume Profile & price areas
Important areas today: 4.210 – 4.200 – 4.175 – 4.164 – 4.133
4.210–4.200: upper area, coinciding with the nearest POC/VAH cluster – selling pressure likely when price retraces here.
4.175: short-term support + area with sell-side liquidity; if this area is lost, price could be pulled to a deeper demand cluster.
4.164–4.133: potential Buy zone in a deep decline scenario – Volume Profile shows significant buying occurred around this area previously.
In short: on H1, the trend is down, prioritize selling according to volume; consider buying only when price falls to a lower discount area.
Trading scenario reference
(Not personalized advice – adjust volume & SL according to your account)
Scenario 1 – Sell following the downtrend structure (priority)
Sell area: 4.210–4.200 (POC/VAH + technical retracement area)
Idea: Wait for price to retrace to this area, observe H1/M15 for rejection candles (long upper tail, pin bar, engulfing…) before activating a Sell order.
Suggested take profit areas: TP1: 4.175
TP2: 4.164
TP3: 4.133 (in case of a strong 50–60 point decline)
Scenario 2 – Buy at deep discount area
Buy area: 4.164–4.133
Idea: Only consider buying when price has "dumped" deeply enough into the buy zone, with clear reversal candles on H1.
At that point, this is a technical retracement play, not trying to catch the bottom of a major trend.
Suggested take profit areas:
TP1: return to 4.175
TP2: 4.200
Macroeconomic context – Why is gold still hesitant?
Gold recorded a slight increase on Friday, but remains within the narrow trading range of the week.
Expectations of a dovish Fed continue to pressure the USD, generally supporting gold in the medium term.
However, buyers are waiting for US PCE data before taking larger positions:
If PCE cools significantly → reinforces the story of an early Fed rate cut → gold could easily rebound.
If PCE remains stubborn → market fears a "hawkish rate cut" scenario from the Fed → yields may rise, adding selling pressure on gold.
Risk management
For the Sell scenario, avoid chasing price in the middle of the area – prioritize waiting for a retracement to POC/VAH before entering, with a tight SL above the 4.210–4.215 area.
If participating in the Buy play at 4.164–4.133, consider splitting TP and moving SL to breakeven as soon as TP1 is reached to avoid constant chart monitoring.

what do you think about today's gold price?Hello Traders, what do you think about today's gold price?
Today the market will have news related to Unemployment Benefits, so I expect the trading range to be slightly narrow and liquidity relatively low. Please be more cautious in placing orders and managing capital.
Below are the important support – resistance zones I am monitoring today:
🔵 BUY ZONE (Support)
4180 – 4184
4160 – 4165
4150 – 4155
4130 – 4133
➡️ These are strong support zones – prioritize watching for Buy in the Sideway range.
🔴 SELL ZONE (Resistance)
4240 – 4244
4250 – 4255
➡️ These are the upper resistance zones – suitable for watching for Sell when the price rebounds to the range.
👀 NEAREST OBSERVATION ZONE
4217 – 4220
➡️ This is the directional zone, observe price reactions to determine continuation or adjustment forces.
🎯 Trading orientation for the day
Personal style: SL10 price – TP10 price.
Trade within the Sideway range, Buy low – Sell high.
Break any zone, trade that zone, avoid holding orders against the trend.
Low liquidity → trade lightly & manage capital tightly.
⚠️ Note: This is a personal trading plan, not investment advice. Please consider it as reference material.
Wishing you a successful trading day – enter and win! 💹✨
